Faculty of Engineering and Surveying
3D Hydrologic Features Mapping with
Imaging Rover
A dissertation submitted by
Declan Pettersson
in fulfilment of the requirements of
ENG4111 and ENG4112 Research Project
towards the degree of
Bachelor of Spatial Science (Honours) (Surveying)
1
ABSTRACT
Severe weather events and flooding have damaged waterways in Toowoomba in the summer of 2011; however with the aid of flood mapping, the damage can be greatly reduced. Flood mapping has always been of major importance to local councils and communities as it identifies flood prone areas and allows the authorities to mitigate the risk to reduce damage. New technology has emerged that can accurately create 3D image models of flood prone sites in an attempt to map hydrological features and the potential risks. The Trimble V10 Imaging Rover can create a spatially accurate image model and point cloud that can later be processed and measured off to create flood mitigation solutions. The aim of the project is to see whether the Trimble V10 Imaging Rover is a viable solution for flood mapping and hydrologic feature modelling within small catchments and creeks.
A section of West Creek in the centre of Toowoomba was selected for the site and a survey using the Trimble V10 and R10 GNSS receiver was completed. The data was processed in Trimble Business Centre to create a useable model. The automatic tie-point method was selected for the registration of the images to create an image model and later, a point cloud was generated.
2 University of Southern Queensland
Faculty of Health, Engineering and Sciences
ENG4111/ENG4112 Research Project
Limitations of Use
The Council of the University of Southern Queensland, its Faculty of Health, Engineering & Sciences, and the staff of the University of Southern Queensland, do not accept any responsibility for the truth, accuracy or completeness of material contained within or associated with this dissertation.
Persons using all or any part of this material do so at their own risk, and not at the risk of the Council of the University of Southern Queensland, its Faculty of Health, Engineering & Sciences or the staff of the University of Southern Queensland.
3 University of Southern Queensland
Faculty of Health, Engineering and Sciences
ENG4111/ENG4112 Research Project
Certification of Dissertation
I certify that the ideas, designs and experimental work, results, analyses and conclusions set out in this dissertation are entirely my own effort, except where otherwise indicated and acknowledged.
I further certify that the work is original and has not been previously submitted for assessment in any other course or institution, except where specifically stated.
Declan Pettersson
4
ACKNOWLEDGEMENTS
I would like to acknowledge that the research was performed under the supervision of Dr. Xiaoye Liu. Her continued assistance has been extremely valuable.
5
CONTENTS
ABSTRACT ... 1
ACKNOWLEDGEMENTS ... 4
LIST OF FIGURES ... 8
LIST OF TABLES ... 9
CHAPTER 1 – INTRODUCTION ... 10
1.1 Introduction ... 10
1.2 Aim, Objectives and Scope ... 11
1.3 Conclusion ... 12
CHAPTER 2 – LITERATURE REVIEW ... 13
2.1 Introduction ... 13
2.2 What is Photogrammetry? ... 13
2.3 Types of Photogrammetry ... 14
2.3.1 Aerial Photogrammetry ... 14
2.3.2 Terrestrial Photogrammetry ... 14
2.4 Trimble V10 Imaging Rover Properties ... 15
2.5 Image Registration ... 15
2.5.1 Aerial Image Registration... 15
2.5.2 Terrestrial Image Registration ... 16
2.5.3 Trimble V10 Image Registration ... 16
2.6 Current Applications of Photogrammetry ... 17
2.6.1 Engineering Applications ... 17
2.6.2 Police Applications ... 17
2.6.3 Medical Applications ... 18
6
2.7 Flood Mapping ... 18
2.8 Modelling Hydrological Features ... 19
2.9 Application of Trimble V10 ... 20
2.10 Conclusion ... 21
CHAPTER 3 – METHODOLOGY ... 22
3.1 Introduction ... 22
3.2 Study Area ... 22
3.3 Equipment ... 24
3.4 Method ... 25
3.4.1 Field Procedure ... 26
3.4.2 Post Processing ... 30
3.4.3 3D Hydrological Feature Extraction ... 33
3.5 Conclusion ... 33
CHAPTER 4 – RESULTS AND DISCUSSION ... 35
4.1 Introduction ... 35
4.2 Analysing Features in the Image Model ... 35
4.3 Analysing Features in the Point Cloud ... 39
4.4 Viability of the Point Cloud ... 41
4.5 Generation of the Point Cloud ... 44
4.6 Comparison of Models ... 45
4.7 Conclusion ... 47
CHAPTER 5 – CONCLUSION AND RECOMMENDATION ... 48
5.1 Conclusion ... 48
5.2 Further Research and Recommendations ... 50
REFERENCES ... 51
7
Appendix B – Risk Assessment and Quality Assurance... 54
Risk Assessment ... 54
Special Requirements ... 55
Quality Assurance Plan ... 55
8
LIST OF FIGURES
Figure Descriptor Page
3.1 Location Map of Toowoomba (WhaTech, 2015) 22
3.2 Satellite Image of the survey site (NearMap, 2016) 23
3.3 Trimble V10 Imaging Rover (Trimble, 2016) 24
3.4 Trimble V10 Range Pole Set Up (Trimble, 2016) 25
3.5 Location map of permanent survey marks used for control (Google Earth, 2016)
26
3.6 Layout of photo stations within TBC 30
3.7 Photo station view in TBC 32
4.1 Photo point displayed in photo station view 36
4.2 Photo points attribute data 36
4.3 Inverse function in TBC 37
4.4 Analysis of eastern culvert 38
4.5 View of the point cloud showing inconsistency of data generation 40
4.6 Eastern culvert in the point cloud 42
4.7 Eastern culvert in the point cloud 42
4.8 Point cloud representation of the bridge in the centre of the site 43
[image:9.595.83.520.158.507.2]9
LIST OF TABLES
Table Descriptor Page
3.1 Coordinate Block Shift 28
10
CHAPTER 1 – INTRODUCTION
1.1 Introduction
3D modelling is fairly old news in the world of spatial science however it is progressively becoming more accurate and cost effective (MacLeod 2014). Arguably the most common form of 3D modelling is laser scanning with many survey firms offering scanning solutions of their own; however other areas include UAV’s and photogrammetry. The surveying industry is moving away from traditional surveying practices in favour of 3D point cloud technology (Jones 2013) as it provides a much more in-depth model of the environment. Similar to terrestrial laser scanning instruments, Trimble has developed an imaging rover which takes 360 degree images of the terrain rather than millions of 3D points. From these images, spatially accurate points can be extracted and used in later applications. Due to the added benefit of having a visual representation of the terrain as well as data points, the Trimble V10 Imaging Rover was chosen to use for my research project.
Although the V10 imaging rover is essentially an advanced form of terrestrial photogrammetry, there is very limited research on the topic as was discovered by completing a literature review. It differs to traditional terrestrial photogrammetry because it captures 360 degree imagery (Trimble, 2015) from a single station compared to a single image from a single station. The V10 should allow for a more complete model that includes numerous similar points within the images; which should ultimately lead to a more accurate three-dimensional model.
11
Floods occur due to poor planning and rainwater management; however the objects that contribute to the flood are not always known. Mapping the hydrologic features within the site provides documentation and a model to identify flood hazards such as bridges and culverts. Once identified, the features can be removed or redeveloped to mitigate the flood hazard depending on their impact. Hydrologic feature modelling provides a key resource in an attempt to rectify the past floods.
1.2 Aim, Objectives and Scope
Although there are already flood mapping systems in place, they mainly deal with larger areas and do not identify the source of the flood. The aim of the project is to see whether the Trimble V10 Imaging Rover is a viable solution for flood mapping and hydrologic feature modelling within small catchments and creeks. The objectives that are hoped to be achieved within the project are:
To determine how accurate the Trimble V10 Imaging Rover is and whether it is suitable for the application of mapping/modelling hydrological features.
To calculate the volume of the selected site using the point cloud and
determine how much water it can handle during sever weather events.
To determine whether the point cloud/image model is a sufficient dataset to use for future applications related to the site.
12
survey process. The site is suitable for the necessary scope and it should meet the requirements of the project.
1.3 Conclusion
13
CHAPTER 2 – LITERATURE REVIEW
2.1 Introduction
The purpose, aim and objectives of the project were discussed in Chapter 1. In this chapter, a literature review is performed to identify the existing knowledge on photogrammetry and the Trimble V10 in order to better understand how the technology can be applied to modelling hydrologic features. The purpose of the literature review was to gather information about:
Terrestrial photogrammetry and the theory behind it
Geo-referencing of images and point clouds to create 3D hydrological features
Data selection and filtering for optimum information
2.2 What is Photogrammetry?
14
2.3 Types of Photogrammetry
2.3.1 Aerial Photogrammetry
In aerial photogrammetry, a camera or sensor is mounted in an aircraft. The type of aircraft can range from a fixed wing plane through to a multi-rotor copter or UAV. The camera is generally mounted to the underside of the aircraft and takes images of the ground below (Walford 2007). The detail and quality of the survey depends on the aircraft’s altitude and the amount of image overlap. Image overlap is required to view a pair of images in stereo-view. Stereo-view allows the viewer to see the images in 3D and thus provide a more detailed view of the images. These photos are also used for Digital Elevation Model (DEM) creation.
2.3.2 Terrestrial Photogrammetry
15
2.4 Trimble V10 Imaging Rover Properties
The Trimble V10 imaging rover is a new piece of technology which captures panoramic images through 12 cameras. Compared to traditional digital cameras, the V10 images have full central perspective properties (Haefeli-Lysnar), meaning the position of the images are known and can be stitched together to create a single panorama. The images are overlapped when they are stitched together based on the exterior calibration of the cameras. Each camera has its own projection centre (Haefeli-Lysnar) allowing for accurate panoramas.
The V10 can be integrated with a Trimble R10 GNSS Receiver or S6 Total Station to give accurate positions (Trimble, 2016). The V10 sits on a range pole with a special tip that limits the impact on the pole to ensure the cameras do not go out of calibration. The power source for the V10 is located on the pole and travels through connections in the pole to supply power for the instrument (Trimble, 2016), this limits the weight of the head and balances the weight of the instrument to avoid it being too top heavy.
2.5 Image Registration
2.5.1 Aerial Image Registration
16
highlighting features within the images. The more overlap between images, the better the stereoscopic pair (USQ SVY3202 Study Book, 2015).
2.5.2 Terrestrial Image Registration
Creating a 3D model requires multiple images to be stitched together. Assuming that a suitable amount of overlap is achieved during the survey, a number of like-points in the overlapping images need to be selected to create a model. These points can either be reference points such as targets placed in the images, or natural points within the images such as corners of windows, concrete joints etc. As long as the overlapping images contain at least 3 like-points (USQ SVY3202 Study Book, 2015) the images can be stitched together. The points identify both the scale and position of one image in relation to another overlapping image. If the object is very high or wide, the exposure of the object or site must be divided into multiple individual models. The image registration is performed using software programs and modern programs will identify like-points in the images automatically to create the model; however reference marks provide an important check to ensure accuracy.
Although a model has been created through the use of reference marks, it may not necessarily have a relationship with reality. The scale of the model can be determined by physically measuring the distance between reference marks, or alternatively a reference unit (levelling staff/ruler) can be exposed in the photographs (USQ SVY3202 Study Book, 2015). A mixture of the two methods is generally preferred as it provides a check.
2.5.3 Trimble V10 Image Registration
17
and automatically identifies points that are present in multiple photo stations and stitches the images together (Trimble, 2016). The more like-points identified, the greater the registration accuracy. The manual adjustment relies on the user to identify these like-points to complete the same outcome. Photo targets can be used to provide easier adjustment and stitching, however if the site is heavily populated with features, there is little need for them.
It can be seen that the image registration of the Trimble V10 is similar to traditional terrestrial photogrammetry however the process is fully automated and results in minimal user error.
2.6 Current Applications of Photogrammetry
Photogrammetry is not necessarily a new technology, however new technology is starting to emerge which makes photogrammetry more user friendly and accessible to the general population. The current applications span across numerous sectors including both public and private areas.
2.6.1 Engineering Applications
There are a vast number of photogrammetry applications within the engineering sector including volume calculation of spoil heaps, tunnel profiling, deformation surveys of dams and measurement of road surfaces to determine roughness to name a few (USQ SVY3202 Study Book, 2015). With technology advancing rapidly the applications will continue to grow.
2.6.2 Police Applications
18
(DCM Technical Services, 2013). The result is an accurate representation of the scene which measurements can be extracted from to aid the investigation.
2.6.3 Medical Applications
Photogrammetry in relation to medical applications generally relates to the creation of surface models of bodies, particularly the face, back and torso (Mitchell, 1995). It can be used for applications such as modelling a face prior to and after reconstruction surgery as well as measurement of an amputated limb for creation of a prosthetic piece (USQ SVY3202 Study Book, 2015).
2.6.4 Archaeology Applications
Photogrammetry provides archaeologists with a new way to document excavations and artefacts (Prins & Adams, 2012). It also aids archaeologists by documenting the process of the dig at different stages and making it easier to digitise the image and eliminates the hand-drawing error previously present.
2.7 Flood Mapping
19
achievability, and it also would not achieve the level of accuracy required for this study.
Hydrological feature modelling is important for flood mapping as it identifies the features which may be contributing to the flood problem. A bridge may be too low and when it floods, the bridge goes beneath the surface. This may then trap debris which causes even more damage and water displacement. If the feature was modelled, calculations could be performed to see if it has any impact on the flooding problem and the feature could be removed or redeveloped.
2.8 Modelling Hydrological Features
A hydrologic model is a software tool that simulates the behaviour of water along a river system (MDBA, 2016). Hydrologic models are concerned with the movement of water through the river system as well as flood plains and wetlands. They investigate the losses and gains of the river system as the water moves through the landscape and it helps determine how the storage, use and supply of the water can be managed.
The models consider a range of input data including rainfall figures, evaporation rates, temperature and stream flows for certain periods of time (MDBA, 2016). These models later use mathematical calculations in order to simulate the behaviour of a river system depending on the input data and conditions experienced. Whilst these systems have been widely implemented over the last 40 years and can be utilised to identify the consumption of water throughout varying climatic conditions, they do not necessarily identify flood hazards. Hydrologic models are mainly concerned with water resource management.
20
2.9 Application of Trimble V10
Traditional photogrammetry relies on taking photographs at multiple different imaging stations. The distance of the stations away from the desired object is generally constrained depending on the size of the object and a certain amount of overlap between images needs to be present. This overlap is needed to tie the images together through a series of related points present in the different images and thus a 3D model can be formed.
The Trimble V10 imaging rover works in a similar manner however instead of taking a single image at each station; it takes a 3D panoramic image of the landscape surrounding the station via its 12 high quality cameras. This process allows for a significant increase in both imagery and related points in the images, meaning that a more accurate and comprehensive three-dimensional model can be created. The integration of the Trimble R10 GNSS Receiver allows for the real-world position of the V10 to be known, whilst traditional photogrammetry would need to have a survey control established previously to obtain known positions of the photograph stations. This allows for a much quicker field-work time and more integrated package.
Once the field work is completed, the collected data can be imported into the Trimble Business Centre software package to be analysed and corrected. The TBC software recognises like points within the images and automatically geo-references the images to create a 3D model of the site (Trimble, 2016). This process can also be done manually by selecting like points within the images. Once the model is created, a point cloud can be overlayed over the images to create a mesh with millions of known positions. This process allows for users to measure between the desired objects and manages the data.
21
2.10 Conclusion
Flood mapping and modelling will always be of importance and as the population of the earth continues to grow, so will the need for improved flood and disaster prevention. Using the Trimble V10 Imaging Rover in conjunction with the Trimble R10 GNSS Receiver should allow for a three-dimensional model of the subject watercourse integrated with accurate real-word coordinates.
22
CHAPTER 3 – METHODOLOGY
3.1 Introduction
The current applications of photogrammetry and the importance of modelling hydrological features were identified in Chapter 2. This chapter aims to identify the location of the site whilst discussing the reasoning and importance behind the selection of the study area. The survey field procedure is discussed in detail including the issues and problems encountered during the survey process.
3.2 Study Area
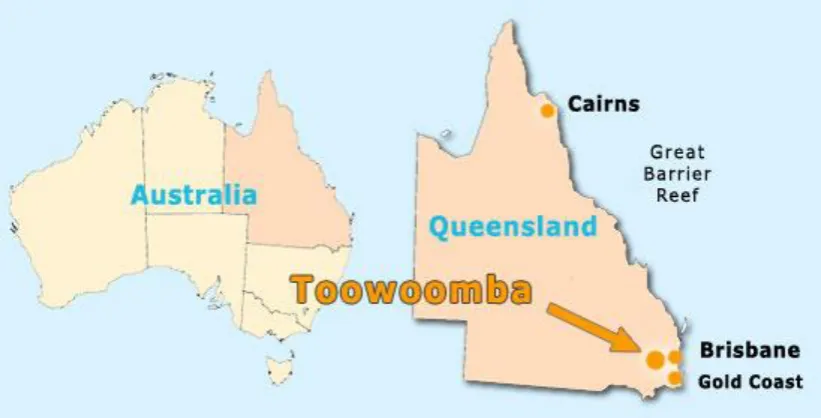
[image:23.595.97.508.478.687.2]The study area chosen for the purpose of the dissertation is located in the city of Toowoomba within Queensland, Australia. Toowoomba is located 125km west of Queensland’s capital city, Brisbane, with an estimated population of 165,168. Toowoomba is Australia’s second largest inland city, after Canberra.
23
The survey site is located in Central Toowoomba. The site is a stretch of West Creek between Herries Street and James Street.
Figure 3.2. Satellite Image of the survey site (NearMap, 2016)
The approximate length of the site is 460m derived from satellite imagery. For the purpose of the dissertation, the site had to be a significant waterway affected by the 2011 Toowoomba floods. This particular stretch of West Creek has recently been redeveloped, so it serves as a good site to determine whether the changes are beneficial.
The site is easily accessed as there is a pathway running parallel to it and as it is a public area, permission to survey the site is not an issue. The site contains a number of hydrological features including bridges and basins of varying materials; therefore it will serve as a good test to see how the Trimble V10 reacts to imaging varying surfaces. The creek itself consists of a small concrete channel with grass surrounding both sides. A retaining wall is located on the Eastern side with a batter slope leading to buildings located on the Western side.
24
3.3 Equipment
The required resources will all be provided either by myself or the University of Southern Queensland (Toowoomba Campus). The resources needed are:
1 x Trimble V10 Imaging Rover 1 x Trimble R10 GNSS Receiver 1 x Trimble Tablet Rugged PC 1 x Trimble Bipod
Access to the stretch of West Creek between the Warrego Hwy and Herries Street
Computer with appropriate software
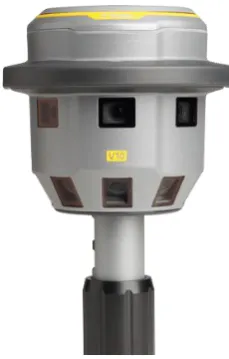
[image:25.595.252.367.490.670.2]The Trimble V10 is an imaging rover that can generate survey accurate positions from images. It includes 12 calibrated cameras which are able to capture 60mp panoramic images.
25
The V10 can be integrated with the Trimble R-series GNSS receiver and Trimble S-series total stations to enhance positioning accuracy. For the purpose of this dissertation, the V10 will be integrated with a Trimble R10 GNSS receiver.
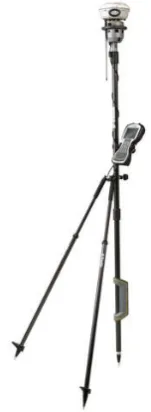
The V10 is positioned using a range pole and stabilised with a bipod. The range pole features a power supply near the base of the pole, and feeds the imaging rover via the pole; however external additions such as a GNSS receiver or tablet require an independent power source.
The data recorder that is used for the study is a Trimble Tablet Rugged PC. The tablet features a Microsoft operating system, allowing users to do calculations in the field if need be. The software used is Trimble Business Centre.
Figure 3.4. Trimble V10 range pole setup (Trimble, 2016)
3.4 Method
[image:26.595.244.320.364.571.2]26
3.4.1 Field Procedure
3.4.1.1 Control Survey
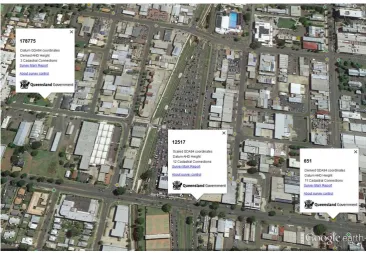
[image:27.595.124.491.352.605.2]Although the site is essentially in the centre of Toowoomba, there are limited Permanent Survey Marks (PSM) in close proximity to the site that have both accurate height and position. The survey marks adopted for the survey control were PSM 651, PSM 178775 and PSM 12517. PSM 651 and 178775 both have datum coordinates with GPS (4th order) fixed heights whilst PSM 12517 has derived coordinates with a spirit levelled (3rd order) fixed height. This means that PSM 651 and 178775 have accurate coordinates (10mm) with approximately 25mm vertical uncertainty. PSM 12517 on the other has considerable horizontal uncertainty with accurate height.
Figure 3.5. Location map of permanent survey marks used for control (Google Earth, 2016)
27
A Trimble R8 GNSS receiver was utilised for the base station. It was not possible to connect to all three PSM’s and survey the site with the Trimble V10 with only one base station set-up due to signal interference caused by infrastructure. The set-up location of the base station was chosen to be an arbitrary point for simplicity, however a fair amount of trial and error was performed in order to measure and connect to all three PSM’s in a single base station set-up.
The first base station set-up was next to the bridge in the centre of the site. PSM 178775 and 12517 were easily connected to with good signal strength, however as PSM 651 was approached, the base station signal dropped out. The signal loss was potentially caused by interference by the buildings and perhaps powerlines surrounding PSM 651. Although this base station location was the easiest and most practical, it was imperative to connect to all PSM’s for redundancy.
The second base station set-up was on the Eastern side of West Creek, along James Street. A survey peg with a nail was placed in the ground (later called Check 01) so the location could be revisited if need be. This provided a line of site to PSM651 however once again, PSM 178775 and 12517 could be connected to, but the signal was lost once near PSM 651.
The third base station set-up was on top of PSM 12517 and yet again PSM 178775 was within range but the signal was lost once near PSM 651. It was realised that there was something interfering with the signal and decided to cross James Street to get closer to PSM 651 and hopefully eliminate the interference.
28
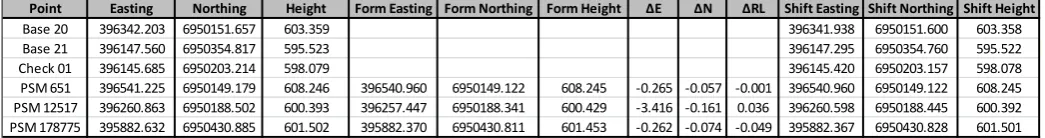
Point Easting Northing Height Form Easting Form Northing Form Height ΔE ΔN ΔRL Shift Easting Shift Northing Shift Height
Base 20 396342.203 6950151.657 603.359 396341.938 6950151.600 603.358
Base 21 396147.560 6950354.817 595.523 396147.295 6950354.760 595.522
Check 01 396145.685 6950203.214 598.079 396145.420 6950203.157 598.078
PSM 651 396541.225 6950149.179 608.246 396540.960 6950149.122 608.245 -0.265 -0.057 -0.001 396540.960 6950149.122 608.245 PSM 12517 396260.863 6950188.502 600.393 396257.447 6950188.341 600.429 -3.416 -0.161 0.036 396260.598 6950188.445 600.392 PSM 178775 395882.632 6950430.885 601.502 395882.370 6950430.811 601.453 -0.262 -0.074 -0.049 395882.367 6950430.828 601.501
[image:29.595.45.568.297.366.2]Once back in the office, the coordinates of the PSM’s, peg and bolt were extracted. Due to the base station only being operational for a short period of time, the positioning was not exact and therefore a block coordinate shift was needed to get the bolt and peg on the correct datum (real world coordinates). The three PSM’s have real world coordinates, therefore the difference in Easting, Northing and Elevation between the known and measured coordinates were found. It can be seen in Table 3.1 that the difference in height between the known and measured coordinates of PSM 651 was 1mm, and the difference in Eastings and Northings of PSM 651 and 178775 were extremely similar.
Table 3.1. Coordinate Block Shift
The difference in Easting and Northing between the known and measured coordinates of PSM 12517 was substantial; however it was to be expected with the high uncertainty of the known coordinates. What is unexpected is the variation in height across the three survey marks, differing up to 85mm. The large variation could not be explained and although PSM 12517 has the best vertical uncertainty, the mark may have been disturbed.
Due to the uncertainty in height and positioning, PSM 651 was adopted as the best mark to perform the block shift around. From performing the block coordinate shift, real world coordinates for Base 21 and Check 01 were established which can be seen in Table 3.1. The shift allows the survey of the site to be on a real world datum and creates less office processing once the survey is complete.
3.4.1.2 Site Survey
29
the site to ensure good coverage and signal throughout the survey. Once the Trimble V10 was established and connected to the base, PSM 178775 and 12517 as well as Check 01 were measured to tie the survey into the control.
The survey was started at the James Street end of West Creek and gradually worked throughout the day towards Herries Street. From prior testing of the Trimble V10 Imaging Rover, the range and scope of imagery was able to be determined,. Three station set-ups for each section of the creek was found to be a suitable amount to accurately measure all of the present features. Where there was more detail, such as the bridge, culverts and basins, extra stations were incorporated to ensure sufficient image capture.
The bridge was the most difficult feature to map as it has so many dimensions; therefore a number of set-ups were used around and on top of the bridge. Another difficult feature to map was the large concrete mounds which are assumed to be designed to slow the flow of water. Measuring these required a set-up on top, as the ground stations could not get sufficient imagery alone.
Once the base station and V10 were initialised, the measuring process was quite simple and efficient. A minimum of 20 seconds was adopted to occupy each set-up to allow for accurate GNSS positioning. Once the position was stored, the Trimble V10 created a panorama via the 12 cameras and stated that it was acceptable to move to the next station. This process was repeated for all of the stations and resulted in a streamlined process. The battery of the base station had to be changed once during the survey, however it did not prove to be an issue and once the base was reinitialised, the survey continued as expected. Overall there were 87 photo stations and 1044 images.
30
3.4.2 Post Processing
The post processing is handled in Trimble Business Centre (TBC). TBC is used to process data from all Trimble instruments, and thus is an extremely capable software suite. The software has recently been upgraded to include a Trimble V10 workflow tab to streamline data processing and make the overall process as simple as possible for the user.
The first step was to extract the data from the Trimble Rugged Tablet PC and upload the raw data file (.job) into TBC. The photos from the survey are stored in a known location so TBC can access and import them into the program along with the .job file. It is important to note that the directory that the photos are stored in cannot be changed as TBC will no longer recognise the location and thus will not be able to import them. Once the data is imported, a basic layout of the survey can be seen with the spatial positions of the PSM’s, check shots and photo stations.
31
The next step was to adjust the photo stations using the automatic tie point adjustment. The full orientation adjustment method was chosen as it adjusts the compass and tilt value of the photo stations whilst maintaining the 3D coordinates. The automatic tie point adjustment works through each photo station and identifies common points between stations and creates a series of tie points. These tie points allow the program to stitch the images together to form a single, coherent image model that is not disjointed. The better the station geometry and feature mapping, the more tie points and redundancy. The automatic tie point adjustment goes through a number of steps including matching feature points (tie points), removing blunders and forming the model. Due to the large number of photos taken during the survey, the automatic tie point adjustment took approximately 48 hours on a standard specification PC. The shear amount of data and processing time has caused problems for the project as it was difficult to source a PC capable of both handling the workload and doing it in an acceptable timeframe.
Once the automatic adjustment was complete, a total of 10,411 automatic tie points were created. The model was essentially seamless and after careful analysis, the images were stitched together well. Due to the fact that the images of each station were taken at different times, the contrast and light between each capture varied slightly. The ‘Process Panoramas’ feature was used to balance the exposure of the images as well as blend the edges between adjoining images. The feature also gives the option to create a .jpeg panorama deliverable of each photo station. The process took approximately 2 hours to complete.
32
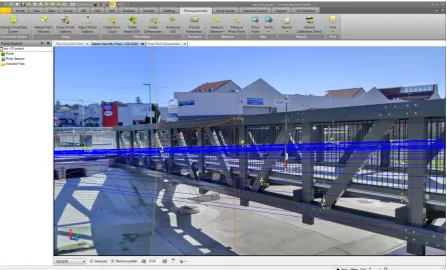
Figure 3.7. Photo station view in TBC
The adjustment of the model is now complete; however there is limited analysis that can be performed in its current state. Although individual points and features can be created from the photo model through a process similar to the tie point creation, the analysis is extremely limited and it would take too long to obtain the appropriate results. This is where the creation of a point cloud comes into consideration. TBC allows users to create a point cloud from the photo model. Similar to the automatic tie point creation, the process identifies features within the photo model and creates thousands of spatial points to form a single point cloud.
33
Autodesk 3DS Max, which has the ability to analyse and handle the point cloud data much more efficiently.
3.4.3 3D Hydrological Feature Extraction
The hydrological features present within the survey site are bridges, culverts, basins, water diverters and a channel. These features can be extracted from the image model either by identifying multiple key points within the image model, or through creating a point cloud and isolating the features. The image model allows the user to pick a point, such as the handrail of the bridge, from multiple photo stations (the more photos, the better the coordinates). A coordinate for the point is calculated and added into the image model. If there are multiple points created then it is possible to measure between these points and get the horizontal and vertical differences.
The point cloud option is a much more visual and comprehensive option as the hydrological features are made up of thousands of spatial points; all of which can be selected for dimensions and 3D positions.
Once the point cloud is created from the image model, it can be manipulated to create cross sections of the hydrological features. This is especially useful to calculate the volume of the creek at particular sections as well as viewing the features in different viewports.
3.5 Conclusion
34
35
CHAPTER 4 – RESULTS AND DISCUSSION
4.1 Introduction
The survey of the site went to plan and the data was processed to create a spatially accurate image model. A point cloud was created in TBC through automatically identifying surfaces and features within the image model. The image model allows simple hydrological feature analysis whilst the point cloud should allow for more complicated and in depth analysis. The point cloud was created in a number of steps to limit the processing power required by the computer and placed together to create a uniform point cloud.
4.2 Analysing Features in the Image Model
The image model allows users to select spatial points out of the photo stations. The automatic or manual tie point adjustment needs to be previously completed to ensure accurate image registration.
36
Figure 4.1. Photo point displayed in photo station view
[image:37.595.76.524.69.339.2]The photo point attribute data can be seen within the photo point spreadsheet. This provides information on the strength of the point (how accurate the coordinates are), the amount of connected photo stations, the bearing and distance from each connected photo station as well as whether the photo point is resolved or not.
Figure 4.2. Photo points attribute data
[image:37.595.71.527.478.570.2]37
Figure 4.3. Inverse function in TBC
Using the process mentioned above, two points on either side of the bridge were selected to determine the length of the bridge over the waterway. The results displayed that the suspended section of the bridge is 20.703m long and has an approximate grade of 2.5%. The height of the bridge above the channel is 2.376m. This analysis was extremely simple to complete and only took a few minutes. A more detailed analysis can be performed by creating more points along the plane and getting a cross-section area under the bridge. This would determine the amount of water that could flow beneath the bridge before the bridge became unusable.
38
Figure 4.4. Analysis of eastern culvert
39
4.3 Analysing Features in the Point Cloud
The point cloud consists of millions of spatially accurate points, each with their own coordinates. The point cloud is automatically created within TBC and the coverage and ability to generate each particular point cloud is an unknown factor. The program utilises a process that analyses the photo stations and identifies various points that are present within multiple photo stations. This is done through a process of intersecting the like points from multiple photos to create a single point in the cloud. The more photos used to intersect the point, the more accurate the coordinates of the point will be.
As mentioned previously, the creation of the point cloud was extremely taxing on the computer that was used and a number of issues were encountered. The computer with 8GB of RAM that was used to adjust the photo stations and create the automatic tie points for the image model was inadequate to generate the point cloud. The process took approximately 4 days but would fail 95% of the way through. Thinking that it was a storage/RAM issue with the computer, hard drive space was freed up and the process was restarted; however was met with the same result. Trimble Business Centre offered no explanation as to why or at which part the point cloud generation failed, making it difficult to locate the problem. Due to time restrictions, it was not viable to continue using the computer so the use of a much higher specification computer with 32GB of RAM was sought.
40
The impact that the failed station had on the final point cloud was minimal as there is sufficient coverage of the site from the other stations and an adequate coverage of points was still created.
Once all five of the point cloud sections were created, they were imported into Maptek I-Site. Maptek I-Site is a software program that efficiently deals with spatial and point cloud information through a range of useful features. The point cloud sections were created on MGA coordinates so they were dragged and dropped into the Maptek software on the same coordinate system.
The point cloud that was generated for the project turned out to be extremely inconsistent and a significant amount of detail was excluded from the final model. A number of hydrological features were either completely missed or poorly generated. The point cloud was inconsistent throughout with ground coverage and grass being represented well in some sections and completely non-existent in others.
[image:41.595.71.528.412.707.2]41
The point cloud has failed to identify the channel running through the middle of the site and the main hydrological feature, the bridge, has large sections missing. The surrounding building facades and trees have been represented well for the most part but that was not the investigation of this project.
The hydrological features, where they are generated, can still technically be analysed within the point cloud as each point has a unique coordinate. Programs such as Maptek and Autodesk 3DS Max have features that can create Digital Terrain Models (DTM) and contours. They can also create rendered surfaces and cross sections. The original plan was to create a DTM and run a series of cross sections throughout the model to measure the maximum volume of the waterway at different chainages. This would identify how much water the waterway could handle before breaking its banks as well as damaging the bridge. Due to the poor, and in most areas, non-existent creation of surface points (and various other points) this is not possible and limited analysis of the point cloud is able to be performed.
4.4 Viability of the Point Cloud
The capability of the point cloud generated within Trimble Business Centre is extremely limited. It can be seen that a significant amount of detail has not been generated and a number of hydrological features present within the site are either not represented or poorly generated. Some analysis of the hydrological features can still be performed, but compared to a complete point cloud, the analysis is restricted. As stated previously, surface models and rendered objects could be created if the point cloud was complete which would open up numerous other analysis options.
42
Image 4.6. Northern culvert in the point cloud
Image 4.7. Southern culvert in the point cloud
43
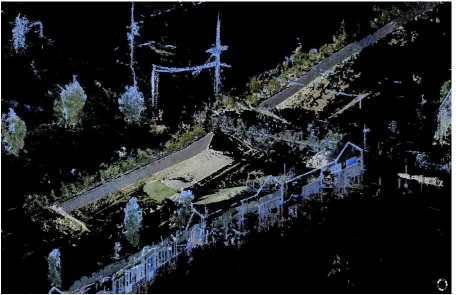
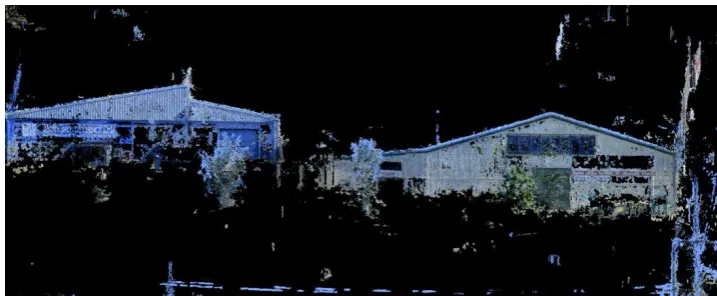
Figure 4.8. Point cloud representation of the bridge in the centre of the site
The image shows how sporadic the point coverage of the bridge is and the amount of detail that is missing. The opposite handrail of the bridge is virtually non-existent. A small amount of ground cover can be seen which consists of pavers and grass. It is interesting how TBC generates some patches of grass but ultimately leaves the majority of the ground surface out. There is not enough information to model or render the hydrological features and there is limited need for a point cloud to be generated if it is similar to this one.
Figure 4.9. Building facades in the point cloud
[image:44.595.126.485.491.639.2]44
still captured well, which leads me to believe the Trimble V10 Imaging Rover would be more suited to building mapping rather than contour/detail surveys.
4.5 Generation of the Point Cloud
There are a range of possible reasons behind the poor generation of the point cloud of the site. There is confidence that the survey planning and photo-station geometry is sound and provides more than enough coverage to generate a satisfactory point cloud. The problem lies within Trimble Business Centre and the process behind the creation of the point cloud.
The building facades were represented surprisingly well considering that they were not the intended features to be captured. The ground surface was poorly represented with the majority of the site not having any points. A possible explanation of this outcome could be that the grass is too much of a uniform surface and TBC cannot differentiate between the different blades, and thus not creating any points. The user manual for the Trimble V10 does state that smooth surfaces that are lacking texture, such as glass or white walls, will not be represented; however it was thought that grass would have sufficient texture. What was surprising was that the concrete channel running down the centre of the site was essentially non-existent in the point cloud. There is a distinct line between grass and concrete and it is reasonable to believe that TBC should be able to differentiate between the two surfaces, so it is concerning as to why it did not.
45
The program has a significant task to complete in generating a point cloud from images and although some features are represented well, the fact is that majority are not. TBC has problems in differentiation between features and surfaces which resulted in the hydrological features of the site either being poorly represented or not represented at all. This restricts the capability of the point cloud and essentially eliminates a range of applications for the Trimble V10 such as detail surveys and other survey applications where ground detail is important. It may be possible to utilise a different photogrammetry program to create a point cloud, and a better result may be seen, however this was not within the project specification.
4.6 Comparison of Models
The image model and point cloud both serve a purpose and even though the point cloud generation was rather poor, some hydrological features can still be analysed. The image model is useful for simple data analysis and measuring a small number of points whilst the point cloud is useful for more in depth data analysis and the points are already created for the user to measure.
46
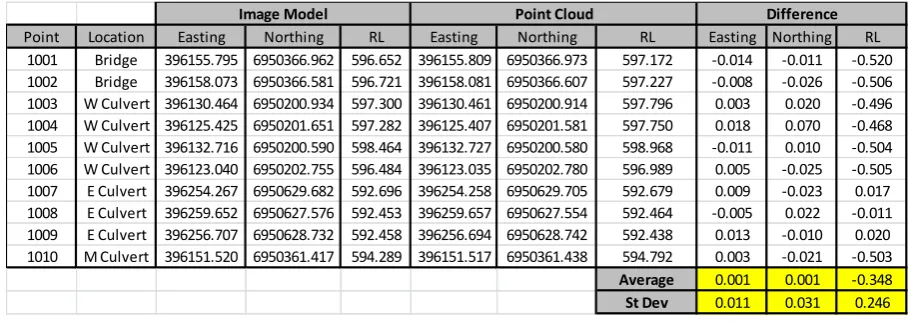
Table 4.1. Coordinate comparison between image model and point cloud
The table shows that across 10 randomly selected points, the difference in Eastings and Northings between the image model and the point cloud is minimal. The heights are significantly different with the majority of the points being 500mm apart. The standard deviation is also quite acceptable for the Eastings and Northings.
There is some error in selecting the points within the two models because the image model is only as accurate as the pixel size and it is difficult to select a single point in the point cloud as it loses all detail when zoomed in on. This user error can explain the differences between the Eastings and Northings however it cannot explain the differences in height. The difference in height is most likely related to the process that TBC uses to create the point cloud. The table shows us that the horizontal coordinates are quite accurate between the models however depending on the adopted model, the heights may be unreliable. A simple fix to this problem would be to measure a few known ground points within the site to compare to the image model or point cloud to obtain the correct heights.
With the poor generation of the point cloud for the site, there is not much practical use for it. The majority of the hydrological features cannot be modelled or analysed due to patchy coverage or non-existence within the cloud and there is not much benefit over the image model. The image model has acceptable measurement features included and although a little more time consuming, the results are a known variable and are reliable.
Point Location Easting Northing RL Easting Northing RL Easting Northing RL
1001 Bridge 396155.795 6950366.962 596.652 396155.809 6950366.973 597.172 -0.014 -0.011 -0.520 1002 Bridge 396158.073 6950366.581 596.721 396158.081 6950366.607 597.227 -0.008 -0.026 -0.506 1003 W Culvert 396130.464 6950200.934 597.300 396130.461 6950200.914 597.796 0.003 0.020 -0.496 1004 W Culvert 396125.425 6950201.651 597.282 396125.407 6950201.581 597.750 0.018 0.070 -0.468 1005 W Culvert 396132.716 6950200.590 598.464 396132.727 6950200.580 598.968 -0.011 0.010 -0.504 1006 W Culvert 396123.040 6950202.755 596.484 396123.035 6950202.780 596.989 0.005 -0.025 -0.505 1007 E Culvert 396254.267 6950629.682 592.696 396254.258 6950629.705 592.679 0.009 -0.023 0.017 1008 E Culvert 396259.652 6950627.576 592.453 396259.657 6950627.554 592.464 -0.005 0.022 -0.011 1009 E Culvert 396256.707 6950628.732 592.458 396256.694 6950628.742 592.438 0.013 -0.010 0.020 1010 M Culvert 396151.520 6950361.417 594.289 396151.517 6950361.438 594.792 0.003 -0.021 -0.503
Average 0.001 0.001 -0.348
St Dev 0.011 0.031 0.246
Point Cloud
47
4.7 Conclusion
Both the image model and the point cloud offer a range of tools to analyse the hydrological features however the point cloud generation was extremely inconsistent and resulted in majority of the features not being represented. The image model offered an easy option to create points within the model that had coordinates and could be measured between. This allowed area calculations of the culverts and measurement of the hydrological features.
48
CHAPTER 5 – CONCLUSION AND RECOMMENDATION
5.1 Conclusion
The research project aimed to investigate the mapping of hydrological features using the Trimble V10 Imaging Rover. The subject site was mapped and the data was processed to determine whether it can be used to analyse hydrological features. There were issues with processing due to the large data files and although a point cloud is a more comprehensive modelling tool, the image model was the most useable model. The V10 is capable of mapping hydrological features effectively and efficiently, however Trimble Business Centre needs to advance before the true capabilities are discovered.
The research project successfully achieved the aim of identifying whether the Trimble V10 Imaging Rover is a viable instrument for hydrological feature mapping. The data captured by the V10 is significant in size and causes processing problems for TBC. The amount of time required for a standard specification computer to process a small survey is substantial. The added possibility that the processing will fail without explanation means it is unpredictable and a risk for businesses. With the use of a computer that can handle the processing, the task is actually quite user friendly and is essentially fully automated.
The image model provides a tool to capture an entire site in a few hours and measure points later. This is beneficial over traditional surveying methods because if something is forgotten, the surveyor does not need to go back out to the field. Creating photo-points within the model is simple and providing that the survey station geometry is acceptable, accurate results can be achieved. The points can be measured between to get distances of the hydrological features and analysis such as the calculation of areas and volumes is possible.
49
represented within the model. There was extremely limited surface coverage of the site and the channel in the centre of the site was not generated. This limits the applications of the Trimble V10 as it is not viable to use for detail surveys or other purposes where surface coverage is needed. If the point cloud was generated well, it would prove to be a capable tool for analysing the hydrological features through the creation of cross sections, areas, volumes and object rendering.
Comparing the coordinates of random points within each model, it was found that the horizontal coordinates are similar whilst the heights are significantly different. This could be due to the processing procedure that TBC adopts whilst generating the point cloud.
The image model does provide a decent amount of analysis tools to model the hydrological features but it is limited to the manual creation of photo-points. A better outcome for the point cloud was expected and unless the processing can be improved to create better coverage of points, a laser scanner would be a more viable option.
The Trimble V10 Imaging Rover is still new technology and has the potential to become the industry standard in mapping and site capture. There are issues with processing and the creation of point clouds however with minor software revisions, these problems could be eliminated. Being able to visually capture an entire site in a short amount of time and later measuring the image model is an attractive feature.
50
5.2 Further Research and Recommendations
The research project only investigated a single application of the Trimble V10 Imaging Rover, and it was found that it can efficiently map water corridors to produce a workable image model. Further research on this topic would be to investigate whether different photogrammetry software is more capable of producing a better point cloud. The issue may not be caused by the V10 itself, rather by Trimble Business Centre. The problem may also lie within the image registration, so it would be interesting to investigate the results of a fully constrained survey with manual targets compared to a survey that relies on the automatic creation of tie points.
51
REFERENCES
Brown, H 2011, Toowoomba was a disaster waiting to happen, The Australian, viewed 10 October 2015,
<http://www.theaustralian.com.au/news/inquirer/toowoomba-was-a-disaster-waiting-to-happen/story-e6frg6z6-1225988980919>
Changming, S 1997, Fiducial Marks, CSIRO, viewed 2 September 2016, <http://vision-cdc.csiro.au/changs/fiducial/node1.html>
Forensics – Photogrammetry 2013, DCM Technical Services Inc, Toronto, viewed 9 April 2016, <http://www.dcmtechservices.com/forensics/photogrammetry.htm> Haq, M, Akhtar, M, Muhammad, S, Paras, S & Rahmatullah, J 2012, ‘Techniques of Remote Sensing and GIS for flood monitoring and damage assessment: A case study of Sindh province, Pakistan’, The Egyptian Journal of Remote Sensing and Spatial Science, vol. 15, no. 2, viewed 15 April 2016,
<http://www.sciencedirect.com/science/article/pii/S111098231200021X>
Hydrologic Modelling, 2016, Murray-Darling Basin Authority, viewed 1 July 2016, <http://www.mdba.gov.au/managing-water/hydrological-modelling>
Jones, T 2013, 3D Laser Survey: The new industry benchmark, Land Air Surveying, viewed 11 October 2015,
<http://www.landairsurveying.com/blog/tag/laser-scanning/>
MacLeod, B 2014, As laser scanners become more popular, the need for training grows, Point of Beginning,viewed 11 October 2015,
< http://www.pobonline.com/articles/97334-as-laser-scanners-become-more-popular-the-need-for-training-grows>
52
n.d., Comparing a Trimble V10 panorama and a panoramic camera, Haefeli-Lysnar Geospatial Solutions, viewed 2 September 2016,
<http://www.hlgs.com.au/news/comapring-trimble-v10-panorama-panoramic-camera>
Prins, A & Adams, MJ 2012, Practical Uses for Photogrammetry on Archaeological Excavations, Jezreel Valley Regional Project, viewed 11 April 2016,
<http://www.jezreelvalleyregionalproject.com/practical-uses-for-photogrammetry-on-archaeological-excavations.html>
SVY3202 Photogrammetry and Remote Sensing: course notes 2015, University of Southern Queensland, Toowoomba.
Trimble Navigation Limited 2016, Trimble Navigation Limited, Worldwide, viewed 10 March 2016, <http://www.trimble.com/Survey/Trimble-V10-Imaging-Rover.aspx>
Walford, A 2007, What is Photogrammetry?, Photogrammetry, viewed 9 April 2016, <http://www.photogrammetry.com/>
What is Remote Sensing? 2015, National Oceanic and Atmospheric Administration, Maryland, viewed 12 April 2016,
53
Appendix A – Project Specification
ENG4111/ENG4112 Research Project
Project Specification
For: Declan Pettersson
Title: 3D Hydrologic Feature Mapping with Imaging Rover
Major: Surveying
Supervisors: Dr. Xiaoye Liu
Enrolment: ENG4111 – ONC S1, 2016
ENG4112 – ONC S2, 2016
Project Aim: To determine whether the Trimble V10 Imaging Rover is a viable solution for
flood mapping and modelling within small catchments and creeks.
Programme: Issue A, 16th March 2016
1. Search for current applications of 3D mapping instruments and how they apply to real world situations.
2. Learn how to operate the Trimble V10 Imaging Rover and perform survey on the selected site.
3. Download the survey data and create a 3D point cloud of the site. This will require a lot of data filtering and selecting what data points are useful for the study.
4. Utilise the point cloud to extract information that directly applies to the study, and thus determining the flow capacity of the selected site. This will decide whether the study is viable.
If time and resources permit:
5. Create and run a water flow simulation through the model to provide a visual representation of the captured data.
54
Appendix B – Risk Assessment and Quality Assurance
Risk Assessment
[image:55.595.34.551.277.607.2]Risk assessment plays a major role within the project as I will be working in some dangerous places whilst undertaking field measurements. I have included a basic risk assessment table below which identifies the levels of risk present and what justifies each risk. The table also outlines how to deal with the risks and what precautions should be taken depending on the level of risk.
Table 5.1. Qualitative Risk Analysis Matrix – Level of Risk
55
Hazard Risk Minimisation
Injury by being hit by a vehicle
when near road H
1. Adhere to relevant traffic regulations
2. Wear fluorescent safety vest
3. Limit exposure to busy roads
Drowning or injury during field
work in water corridor M
1. Do not enter water corridor when raining
2. Wear fluorescent safety vest
3. Notify appropriate person when working
Special Requirements
There are no special requirements such as confidentiality restrictions or intellectual property issues associated with the project. Any data or equipment provided by USQ remains the property of USQ and will not be released to a third party without their prior approval.
Quality Assurance Plan
Quality assurance plays a major part in the surveying profession as the career is directly related to accuracy and precision. There will be a number of quality assurance checks in relation to the field work and data collection phase, as well as at a few other key stages in the project:
Ensure Trimble R10 GNSS Receiver is calibrated to ensure accurate position measurements
[image:56.595.62.531.108.303.2] Connect survey to known permanent marks to ensure accuracy of the position of imaging stations and thus accuracy of geo-referencing
56
Ensure that appropriate field checks are undertaken as well as assessing the reliability of the permanent marks surrounding the site
As mentioned previously in the project schedule, project reviews will be undertaken at three separate times throughout the project to identify any problems
57