Exercise Training in 5-Year-Old Children Tan et al.
https://doi.org/10.1123/pes
.
2016-0107
Exercise Training Improved Body Composition,
Cardiovascular Function, and Physical Fitness of 5-Year-Old
Children With Obesity or Normal Body Mass
Sijie Tan, Cheng Chen, Mingyang Sui, and Lunan Xue
Tianjin University of Sport
Jianxiong Wang
University of Southern Queensland
Objectives: To explore the effects of exercise training on body composition, cardiovascular function, and physical fitness in 5-year-old obese and lean children. Methods: 42 obese and 62 lean children were randomly allocated into exercise and control groups separately. Body composition, cardiovascular function, and physical fitness were measured at baseline and the end of the intervention. The exercise groups participated in 10 weeks of supervised moderate intensity exercise training (at 50% of heart rate reserve), 50 training sessions in total. Results: The physical activity program was successfully completed and no sport injury occurred. Exercise training decreased BMI, waist circumference, body fat%, and fat mass; and slowed down the growth speed of body mass of both trained obese and lean children. Exercise training significantly decreased systolic blood pressure of obese children and decreased their heart rate responses during exercise. Trained obese children improved the performances of long jump, 10-m × 4 shuttle run, and 3-m balance beam walk; while trained lean children improved more items of physical fitness. Conclusions: 10 weeks of moderate intensity exercise training is an effective and safe treatment for children aged 5 years, either obese or with normal body mass.
Keywords: childhood obesity, exercise, cardiovascular function, physical fitness
Children obesity is a serious health problem (18,19).1
Negative impacts of obesity on health-related physical fitness, such as cardiovascular function, muscle strength, and flexibility, have been reported in children aged 3–6 years (17,20). The common treatments of obesity are diet, exercise, pharmacotherapy, and surgery (18,27). Diet is not suitable to young children as their bodies are at the fast growth period and sufficient nutrition must be guaranteed (26). Pharmacologic and surgical treatments should not be introduced carelessly in young children whose obesity is only caused by a positive energy balance from overeating and/or physical inactivity. Thus, exercise training has been applied as the first choice for children who are overweight or obese, but not morbidly obese caused by underlying pathologies (16).
Tan, Chen, Sui, and Xue are with the Tianjin Physical Fitness Research Center, Dept. of Health and Exercise Science, Tianjin University of Sport, China. Wang is with the School of Health and Wellbeing, University of Southern Queensland, Australia. Address author correspondence to Jianxiong Wang at [email protected].
Methods
Participants and Study Design
A total of 104 children aged 5 years from three kindergartens in Tianjin city took part in this study. 42 participants (23 girls and 19 boys) were obese who had the body mass index (BMI) > 97th age-specific percentile. Following the WHO standard of childhood obesity at 5 years old, girl’s BMI > 18.6 and boy’s BMI > 18.1 are defined as obese (32). 62 participants (28 girls and 34 boys) were lean with a normal BMI. All healthy 5-year-old children in these kindergartens were interviewed, while the children with heart diseases, pulmonary diseases, and any physical limitations to exercise were excluded. The exact details of the study were described to parents and teachers before the baseline test. The written informed consent was signed by the parent of each child. This study was approved by the Ethics Committee of Tianjin University of Sport, China.
After the baseline tests, the participants were divided into obese and lean children. Then participants in each group were randomly allocated into exercise and control groups. Exercise groups were trained five 1-hr sessions per week for 10 weeks. Control groups kept their normal physical activity habit during the experimental period. Body composition, cardiovascular function, and physical fitness were measured before and after the interventions. The tests of cardiovascular function and physical fitness were separated by at least one day to allow for full recovery. There was a 48-hr rest between the last training session and the postintervention tests. All of tests and training sessions were carried out in the playground and in the medical room of these kindergartens between May and July 2015. After the completion of this study, the same physical activity program was provided to the children who were in the control groups.
Body Composition Measurements
Body mass was assessed with a balance scale and body height was measured with a stadiometer (without shoes). BMI was calculated by dividing body mass (kg) by height in meters squared (m2). Bioelectrical impedance analysis
(InBody 520 Body Composition Analyzer, InBody Bldg, Seoul, Korea) was used to measure body fat%, fat mass, and fat-free mass. Waist circumference (WC) was measured on the horizontal plane at the level of the umbilicus, the average of three measures being reported. All of the WC measurements were carried out by the same researcher.
Cardiovascular Function Tests
After a warm-up period of 3 min of major muscles stretching and 3 min of slow running, the cardiorespiratory fitness was estimated from the performance of the 20-m shuttle run test (14). Children run back and forth on a 20-m course and must touch the lines at both end. The test was started from 8.5 kph and
the increased 0.5 kph The sound rhythm was used to control running speed. The test was stopped when the child could not follow the pace and failed to touch the line on time three times consecutively. The number of laps completed was used to assess the cardiorespiratory fitness. In another exercise test, the heart rate (HR) response to a certain exercise workload, 30 squats in 30 s, was used as the cardiac fitness variable (29). Briefly, the child rested for 10 min before the resting HR was measured. The squat exercise test was conducted followed the sound rhythm of one beep per second. HRs at the end of exercise and one minute after exercise were recorded. The HR index was calculated as (resting HR + end exercise HR + recovery HR at one minute—200) ÷ 10. According to this formula, a higher index means the heart worked harder in response to the fixed workload and the index can indirectly reflect the cardiac function. HR was monitored by a PE-4000 HR monitor (Polar Electro, Kempele, Finland).
After seated for 10 min, resting blood pressure (BP) was measured at the brachial artery by the auscultatory method. The first Korotkoff sound registered the systolic BP and the last one was considered as the diastolic BP. Each child’s BP was measured twice and the average result was reported. All of the BP measurements were conducted by the same researcher.
The M-mode echocardiography was performed using the Aloka SSC-290 echocardiograph (Hitachi Aloka Medical, Tokyo, Japan) and transducers with an oscillator frequency of 3.5MHz. The left ventricular internal dimensions were measured at both end-diastole (Dd) and end-systole (Ds). The stroke volume (SV) was calculated by the Teichholz equation, i.e., SV = (Dd3—Ds3) x
(7.0/2.4 + Dd) (30), while the left ventricle ejection fraction (LVEF) was determined as SV divided by Dd3.
All of these measurements were operated by the same radiological technician.
Physical Fitness Tests
min rest period between the trials. (f) Throw a tennis ball. Three trials were done and the best result was reported. (g) Balance beam walk (3 m long, 10 cm wide, and 10 cm high from ground). The walk time spent from one end to the other was recorded. Two trials were allowed for each child and the shorter time was reported. Two researchers supervised the balance beam walk test, one recorded time and another stayed close to the child to protect.
Physical Activity Program
Exercise groups had five 1-hr training sessions per week for 10 weeks. There were 50 training sessions in total. All training sessions were fully supervised. The ratio of supervisor: children was 1: 10. Each session included 10 min of warm-up period at the beginning (major muscle stretching and slow running), 40 min of physical activity at the moderate intensity (alternative exercises of quick walking, slow running, jumping, rope skipping, semisquatting, and slow crawling. Four minutes of exercises were separated by one minute of rest period), and 10 min of cool-down activity was done at the end of the session (slow walking and aerobic dancing with light music). Exercise intensity during the 40-min exercise was controlled at 50% of the heart rate reserve (2) and children’s maximal HR has been reported as 200 bpm (24), therefore in the current study, target exercise HR = (200—resting HR) × 50% + resting HR. In the pilot study before, we found that the average resting HR of our participants was 95 bpm, so the target exercise HR was (200–95) × 50% + 95 = 148 bpm. The HR monitors (Polar Electro, Kempele, Finland) were attached to some children (~30% of trained children) to control exercise intensity during the training. An alarm on the HR monitor was set up at ±10 beats of the target HR. Energy expenditure of an exercise session and overall program were estimated following the energy expenditure rate of various physical activities reported in our previous study (29). Main exercise of quick walking, slow running, jumping, rope skipping, semisquatting, and slow crawling have energy expenditure rates about 4–7 kcal/min, respectively.
Statistical Analyses
The differences in the measured variables between obese and lean children at baseline were compared using Student
t test. Effects of the interventions were tested by 2 times (before and after) × 2 groups (exercise and control) factorial design, split plot analysis of variance (SPANOVA). Data of the obese and lean children were analyzed separately. All the values were presented as Mean ± SD. Statistical significance was set at p < .05. All analyses were performed using the SPSS Version 21 for Windows (SPSS Inc. Chicago, IL, USA).
Results
Effects of Obesity on Measured Variables at
Baseline
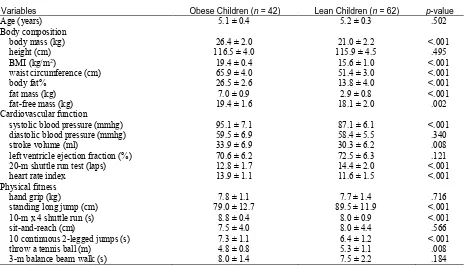
There was no difference in all measured variables between girls and boys at baseline, either obese or lean, thus, the combined data are reported in the current study. Basic information of the obese and lean children was presented in Table 1. Obese children had significantly higher body mass, BMI, WC, body fat%, fat mass, and fat-free mass than those of lean children. There was no difference in age and body height.
Obese children had a significantly higher systolic BP than that of the lean children, while there was no difference in diastolic BP. Obese children had a significant higher SV than that of the lean children. LVEF was similar in obese and lean children. Performance of the 20-m shuttle run and 30 s 30 squats reflected lower cardiovascular function of the obese children when compared with the lean children.
Obese children presented poorer performances in standing long jump, 10-m × 4 shuttle run, 10 continuous two-legged jumps, and throw a tennis ball when compared with those of the lean children. The results of hand grip, sit-and-reach test, and 3-m balance beam walk were not different.
\<<<<INSERT TABLE 1 ABOUT HERE>>>\
Exercise Training Attendance and Safety
Issue
Seventeen trained obese children and 26 trained lean children participated in all 50 sessions. Nine children (4 obese and 5 lean) missed 1–5 sessions for various reasons but no catch-up sessions were given. The average attendance rate was 98%. The target HR intensity was set at 148 bpm. During the training, exercise HR was controlled between 138–158 bpm. It is important to report that no sport injuries occurred during exercise training.
Effects of Exercise Training on Body
Composition
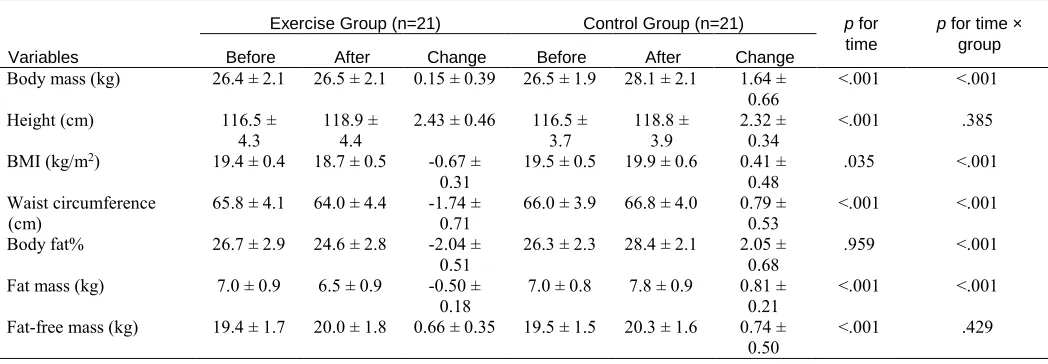
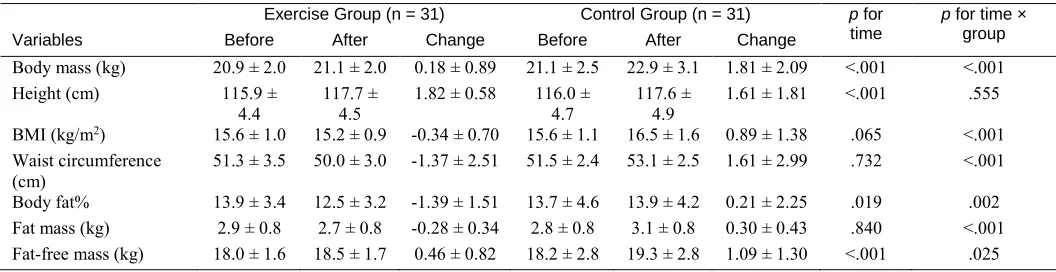
Before the intervention, there were no any differences in body composition between the exercise and control groups of both obese and lean children, respectively. For the obese children, exercise training decreased BMI, WC, body fat%, and fat mass; while no change in body height and fat-free mass was found. The growth speed of body mass was slowed down in the obese children compared with that of the lean children (Table 2). For the lean children, exercise training achieved the same results as those of the obese children; in additional, trained lean children significantly increased their fat-free mass (Table 3).
Effects of Exercise Training on
Cardiovascular Function
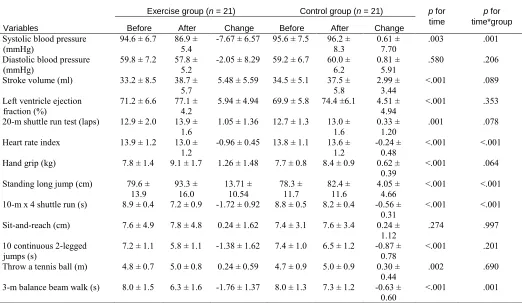
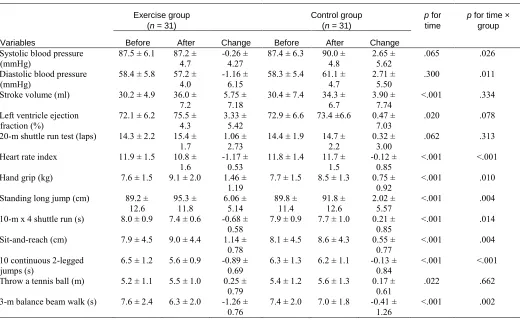
Before the intervention, there were no any differences in cardiovascular function between the exercise and control groups of both obese and lean children, respectively. For the obese children, exercise training decreased systolic BP and HR index. No significant changes in other variables were found (Table 4). For the lean children, exercise training had similar effects as those on obese children. The only difference was that the diastolic BP was also decreased in trained lean children (Table 5).
Effects of Exercise Training on Physical
Fitness
Before the intervention, there were no any differences in physical fitness between the exercise and control groups of both obese and lean children, respectively. Trained obese children increased their standing long jump and decreased the times of 10-m × 4 shuttle run and 3-m balance beam walk; while there were no significant changes in other variables (Table 4). Compared with obese children, lean children achieved more from exercise training. They improved six variables after exercise training, whereas trained obese children only changed three variables (Table 5).
\<<<<INSERT TABLE 4 AND TABLE 5 ABOUT HERE>>>\
Estimated Energy Expenditure of Exercise
Training
Main exercise modes were quick walking, slow running, jumping, rope skipping, semisquatting, and slow crawling. Total exercise time expended on these exercise in each training session was about 30 min. The estimated energy expenditure for each training session would be about 150– 170 kcal, then whole program with 50 sessions would cost energy 7500–8500 kcal.
Discussion
There are two important evidence of childhood obesity: the prevalence of overweight and obesity among preschool children was 6.7% in 2010 and this datum would increase to about 10% in 2020 worldwide (5); and childhood obesity does not recede naturally with growth, it will most likely be carried into adulthood if it is not treated effectively on time (9,11). These findings confirm the need for effective interventions to manage this global epidemic. Therefore, treatment and prevention of childhood obesity is a burning research question and many school children projects have used physical activity to treat or prevent the condition so far (1,3,21,22). However, there are few interventional studies of treatment of obesity in preschool children. In the current study, the baseline comparison of the measured variables has demonstrated the negative impacts of obesity in children aged 5 years. This outcome supports the first hypothesis of our study; meanwhile, it is in agreement with the results of previous
studies (17,20). Our current result emphasizes the importance and urgency to treat or prevent childhood obesity from as early as the preschool period.
Beneficial effects of physical activity program observed in the current study support our second hypothesis. The safe completion of the program revealed a good tolerance of children’s bodies to moderate exercise. This outcome implies that moderate intensity exercise training is an effective and safe method of childhood obesity management.
The present physical activity program produced favorable effects on body composition of obese children, i.e., decreased BMI, body fat%, and fat mass of trained obese children but no such improvement was observed in the control group. Our team has reported similar results in obese children aged 8–10 years (28). Body mass of all obese children in this study is raising, however the growth speed of the trained children was slowed down compared with that of the control children. It is a positive result as we do not intend to decrease body mass at this fast developing period. Another encouraging result is that the abdominal fat mass, assessed by WC, was decreased. It has been reported that high abdominal fat tissue is a cardiometabolic risk factor for children (31). These results suggest that beneficial effects on body composition would be expected in 5-year-old obese children when they joined moderate intensity exercise training.
For the lean children in our study, the physical activity program decreased BMI, body fat%, fat mass, and WC; and also slowed down the growth speed of body mass. This finding highlights that obesity prevention can be started from 5 years age. It has be stated that primary prevention should be the first line of childhood obesity treatment (18). Therefore, it is a wise strategy to help children do more exercise and develop a physically active lifestyle from very young ages, rather than to treat obesity in mature ages. Our result has supported this statement and provides a workable plan to prevent childhood obesity.
The echocardiography did not show any significantly anatomic changes in the hearts of our participants, all children have the growing SV and LVEF at this age, no matter whether they are obese or lean and trained or control. Therefore, improvement caused by exercise training cannot be pinpointed. However, when we focus on cardiovascular function, the HR index measured from a fixed workload was decreased significantly in both trained obese and lean children. The same outcome has been reported in obese boys aged 8–10 years (28,29). This result shows that 10 weeks of exerciser training allowed the trained hearts to treat the submaximal workload more effectively.
effects of exercise on resting BP in children aged 7–14 years (8), in which physical exercise had a moderate beneficial effect on systolic BP. Our results also support the current guidelines of childhood hypertension management, which claims that therapeutic lifestyle change, included exercise, should be applied as the first-line therapy (25).
Interestingly, obese children achieved significant changes in three of the seven tests of physical fitness: they increased their standing long jump distance and reduced the times spent on 10-m × 4 shuttle run and balance beam walk; while the trained lean children improved the performance in six tests. The different responses to exercise training may be explained by a negative relationship between obesity and motor skills ability (15). A study of overweight or obese children aged 7–13 years reported that obese children had significantly lower motor skill level than that of the healthy-weigh children, while four months of treatment, included increased physical activity, improved their motor skills (6). This study’s results supported our findings.
There are limitations in the current study. Firstly, 10 weeks of training is short. However, the most important thing for 5-year-old children is developing a physically active lifestyle rather than focusing on any short-term effects in their bodies. Following this thinking, we used very simple exercise methods in this study. We also have had the training sessions opened to the parents, so that they can learn how to manage time of exercise and rest and help their children do the training after the project completed. Secondly, dietary records were not reported. As the children in this study had three meals in the kindergarten and there was no large change in the routine menu during the interventional period, we assumed that there should be no major change in daily energy intake of the children. Thirdly, simple tests are used in this study, such as WC for abdominal fat mass. Advanced technique, such as dual-energy X-ray absorptiometry to measure body fat would provide more accurate data. In conclusion, the current results support the availability of using exercise training to treat or prevent childhood obesity from 5 years old. The physical activity program used in the current study is safe and effective.
Acknowledgments
This study was supported by The Chinese National Social Science Funds—Educational Science Project: Study of Adolescents’ Physical Fitness and Public Health System through New Media Technique (BLA140067). The authors declare that there are no conflicts of interest.
References
1. Aburto NJ, Fulton AE, Safdie M, Duque T,
Bonvecchio A, Rivera JA. Effect of a school-based intervention on physical activity: cluster-randomized trial. Med Sci Sports Exerc. 2011;
43(10):1898–1906. PubMed doi:10.1249/MSS.0b013e318217ebec
2. American College of Sports Medicine (ACSM)
guidelines for exercise testing and prescription,
17th ed. Philadelphia: Lippincott Williams & Wilkins; 2006.
3. Brambilla P, Pozzobon G, Pietrobelli A. Physical activity as the main therapeutic tool for metabolic syndrome in childhood. Int J Obes.
2011; 35(1):16–28. PubMed doi:10.1038/ijo.2010.255
4. DennisBA, ErgulA, GowerBA, AllisonJD, Davis CL. Oxidative stress and cardiovascular risk in overweight children in an exercise intervention program.Child Obes.2013; 9(1):15–21. PubMed doi:10.1089/chi.2011.0092
5. De Onis M, Blossner M, Borghi E. Global prevalence and trends of overweight and obesity among preschool children. Am J Clin Nutr.
2010; 92(5):1257–1264. PubMed doi:10.3945/ajcn.2010.29786
6. D’Hondt E, Gentier I, Deforche B, Tanghe A, De Bourdeaudhuij I, Lenoir M. Weight loss and improved gross motor coordination in children as a result of multidisciplinary residential obesity treatment.Obesity (Silver Spring).2011;
19(10):1999–2005. PubMed doi:10.1038/oby.2011.150
7. Farpour-LambertNJ, AggounY, MarchandLM, et al. Physical activity reduces systemic blood pressure and improves early markers of atherosclerosis in pre-pubertal obese children.J Am Coll Cardiol. 2009; 54(25):2396–2406. PubMeddoi:10.1016/j.jacc.2009.08.030
8. García-Hermoso A, Saavedra JM, Escalante Y.
Effects of exercise on resting blood pressure in obese children: a meta-analysis of randomized controlled trials. Obes Rev. 2013; 14(11):919–
928. PubMeddoi:10.1111/obr.12054
9. Guo SS, Wu W, Chumlea WC, Roche AF.
Predicting overweight and obesity in adulthood from body mass index values in childhood and adolescence. Am J Clin Nutr. 2002; 76(3):653–
658. PubMed
10. GutinB, OwensS. Role of exercise intervention in improving body fat distribution and risk profi le in children. Am J Hum Biol. 1999; 11(2):237–
247. PubMed doi:10.1002/(SICI)1520- 6300(1999)11:2<237::AID-AJHB11>3.0.CO;2-9
11. Herman KM, Craig CL, Gauvin L, Katzmarzyk PT. Tracking of obesity and physical activity from childhood to adulthood: the physical activity longitudinal study. Int J Pediatr Obes.
2009; 4(4):281–288. PubMed doi:10.3109/17477160802596171
12. Lee S, Bacha F, Hannon T, Kuk JL, Boesch C,
13. LeeS, DeldinAR, WhiteD, et al.Aerobic exercise but not resistance exercise reduces intrahepatic lipid content and visceral fat and improves insulin sensitivity in obese adolescent girls: a randomized controlled trial.Am J Physiol.2013;
305(10):E1222–E1229. PubMed
14. LegerLA, MercierD, GadouryC, LambertJ. The multistage 20 metre shuttle run test for aerobic fitness. J Sports Sci. 1988; 6:93–101. PubMed doi:10.1080/02640418808729800
15. Liang J, Matheson BE, Kaye WH, Boutelle KN.
Neurocognitive correlates of obesity and obesity-related behaviors in children and adolescents. Int J Obes. 2014; 38(4):494–506. PubMeddoi:10.1038/ijo.2013.142
16. Maffeis C, Castellani M. Physical activity: an effect way to control weight in children? Nutr Metab Cardiovasc Dis. 2007; 17(5):394–408. PubMeddoi:10.1016/j.numecd.2006.08.006
17. Martinez-TellezB, Sanchez-DelgadoG, Cadenas-SanchezC, et al. Health-related physical fitness is associated with total and central body fat in preschool children aged 3 to 5 years. Pediatr Obes.2015; XXX. PubMed
18. Miller J, Rosenbloom A, SilversteinJ. Childhood obesity. J Clin Endocrinol Metab. 2004;
89(9):4211–4218. PubMed doi:10.1210/jc.2004-0284
19. Ng M, Fleming T, Robinson M, et al. Global, regional, and national prevalence of overweight and obesity in children and adults during 1980-2013: a systematic analysis for the Global Burden of Disease Study 2013. Lancet. 2014;
384(9945):766–781. PubMed doi:10.1016/S0140-6736(14)60460-8
20. Niederer I, Kriemler S, Zahner L, et al. BMI group-related differences in physical fitness and physical activity in preschool-age children: a cross-sectional analysis. Res Q Exerc Sport.
2012; 83(1):12–19. PubMed doi:10.1080/02701367.2012.10599820
21. Reinehr T, Klebera M, Toschkeb AM. Lifestyle intervention in obese children is associated with a decrease of the metabolic syndrome prevalence. Atherosclerosis. 2009; 207(1):174–
180. PubMed
doi:10.1016/j.atherosclerosis.2009.03.041
22. ResalandGK, AndersenLB, MamenA, Anderssen SA. Effects of a 2-year school-based daily physical activity intervention on cardiorespiratory fitness: the Sogndal school-intervention study. Scand J Med Sci Sports.
2011; 21(2):302–309. PubMed doi:10.1111/j.1600-0838.2009.01028.x
23. Rosner B, Cook NR, Daniels S, Falkner B.
Childhood blood pressure trends and risk factors for high blood pressure: the NHANES Experience 1988-2008. Hypertension. 2013;
62(2):247–254. PubMed doi:10.1161/HYPERTENSIONAHA.111.00831
24. RowlandTW. Aerobic exercise testing protocols. In: TW Rowland, editor. Pediatric Laboratory
Exercise Testing: Clinical Guidelines.
Champaign, IL: Human Kinetics Press; 1993. p.
19–41.
25. Samuels J, Bell C, Samue J, Swinford R.
Management of Hypertension in Children and Adolescents. Curr Cardiol Rep. 2015; 17:107. PubMeddoi:10.1007/s11886-015-0661-1
26. Spear BA, Barlow SE, Ervin C, et al. Recommendations for treatment of child and adolescent overweight and obesity. Pediatrics.
2007; 120(Supple):S254–S288. PubMed doi:10.1542/peds.2007-2329F
27. Speiser PW, Rudolf MC, Anhalt H, et al. Consensus statement: childhood obesity. J Clin Endocrinol Metab. 2005; 90(3):1871–1887. PubMeddoi:10.1210/jc.2004-1389
28. Tan S, Wang J, Cao L. Exercise training at the intensity of maximal fat oxidation in obese boys.
Appl Physiol Nutr Metab. 2016; 41(1):49–54. PubMeddoi:10.1139/apnm-2015-0174
29. TanS, YangC, WangJ. Physical training of 9-10 year old children with obesity to lactate threshold intensity. Pediatr Exerc Sci. 2010;
22(3):477–485. PubMed doi:10.1123/pes.22.3.477
30. TeichholzLE, Kreulen T, Herman MV, GorlinR.
Problem in echocardiographic volume determinations: echocardiographic-angiographic correlations in the presence or absence of asynergy. Am J Cardiol. 1976; 37(1):7–11. PubMeddoi:10.1016/0002-9149(76)90491-4
31. Weber DR, Katz LEL, Zemel BS, et al. Anthropometric measures of abdominal adiposity for the identification of cardiometabolic risk factors in adolescents.
Diabetes Res Clin Pract. 2014; 103(3):e14–e17. PubMeddoi:10.1016/j.diabres.2013.12.050
Table 1 Comparison of the Measured Variables Between Obese and Lean Children at Baseline
Variables Obese Children (n = 42) Lean Children (n = 62) p-value
Age (years) 5.1 ± 0.4 5.2 ± 0.3 .502
Body composition
body mass (kg) 26.4 ± 2.0 21.0 ± 2.2 <.001
height (cm) 116.5 ± 4.0 115.9 ± 4.5 .495
BMI (kg/m2) 19.4 ± 0.4 15.6 ± 1.0 <.001
waist circumference (cm) 65.9 ± 4.0 51.4 ± 3.0 <.001
body fat% 26.5 ± 2.6 13.8 ± 4.0 <.001
fat mass (kg) 7.0 ± 0.9 2.9 ± 0.8 <.001
fat-free mass (kg) 19.4 ± 1.6 18.1 ± 2.0 .002
Cardiovascular function
systolic blood pressure (mmhg) 95.1 ± 7.1 87.1 ± 6.1 <.001 diastolic blood pressure (mmhg) 59.5 ± 6.9 58.4 ± 5.5 .340
stroke volume (ml) 33.9 ± 6.9 30.3 ± 6.2 .008
left ventricle ejection fraction (%) 70.6 ± 6.2 72.5 ± 6.3 .121 20-m shuttle run test (laps) 12.8 ± 1.7 14.4 ± 2.0 <.001
heart rate index 13.9 ± 1.1 11.6 ± 1.5 <.001
Physical fitness
hand grip (kg) 7.8 ± 1.1 7.7 ± 1.4 .716
standing long jump (cm) 79.0 ± 12.7 89.5 ± 11.9 <.001
10-m x 4 shuttle run (s) 8.8 ± 0.4 8.0 ± 0.9 <.001
sit-and-reach (cm) 7.5 ± 4.0 8.0 ± 4.4 .566
10 continuous 2-legged jumps (s) 7.3 ± 1.1 6.4 ± 1.2 <.001
throw a tennis ball (m) 4.8 ± 0.8 5.3 ± 1.1 .008
3-m balance beam walk (s) 8.0 ± 1.4 7.5 ± 2.2 .184
Table 2 Changes in Body Composition Variables After Interventions in Obese Children
Exercise Group (n=21) Control Group (n=21) p for
time
p for time × group
Variables Before After Change Before After Change
Body mass (kg) 26.4 ± 2.1 26.5 ± 2.1 0.15 ± 0.39 26.5 ± 1.9 28.1 ± 2.1 1.64 ± 0.66
<.001 <.001
Height (cm) 116.5 ± 4.3
118.9 ± 4.4
2.43 ± 0.46 116.5 ± 3.7
118.8 ± 3.9
2.32 ± 0.34
<.001 .385
BMI (kg/m2) 19.4 ± 0.4 18.7 ± 0.5 -0.67 ± 0.31
19.5 ± 0.5 19.9 ± 0.6 0.41 ± 0.48
.035 <.001
Waist circumference (cm)
65.8 ± 4.1 64.0 ± 4.4 -1.74 ± 0.71
66.0 ± 3.9 66.8 ± 4.0 0.79 ± 0.53
<.001 <.001
Body fat% 26.7 ± 2.9 24.6 ± 2.8 -2.04 ± 0.51
26.3 ± 2.3 28.4 ± 2.1 2.05 ± 0.68
.959 <.001
Fat mass (kg) 7.0 ± 0.9 6.5 ± 0.9 -0.50 ±
0.18 7.0 ± 0.8 7.8 ± 0.9 0.81 ± 0.21 <.001 <.001 Fat-free mass (kg) 19.4 ± 1.7 20.0 ± 1.8 0.66 ± 0.35 19.5 ± 1.5 20.3 ± 1.6 0.74 ±
0.50 <.001 .429
Table 3 Changes in Body Composition Variables After Interventions in Lean Children
Exercise Group (n = 31) Control Group (n = 31) p for
time
p for time × group
Variables Before After Change Before After Change
Body mass (kg) 20.9 ± 2.0 21.1 ± 2.0 0.18 ± 0.89 21.1 ± 2.5 22.9 ± 3.1 1.81 ± 2.09 <.001 <.001 Height (cm) 115.9 ±
4.4
117.7 ± 4.5
1.82 ± 0.58 116.0 ± 4.7
117.6 ± 4.9
1.61 ± 1.81 <.001 .555
BMI (kg/m2) 15.6 ± 1.0 15.2 ± 0.9 -0.34 ± 0.70 15.6 ± 1.1 16.5 ± 1.6 0.89 ± 1.38 .065 <.001 Waist circumference
(cm) 51.3 ± 3.5 50.0 ± 3.0 -1.37 ± 2.51 51.5 ± 2.4 53.1 ± 2.5 1.61 ± 2.99 .732 <.001 Body fat% 13.9 ± 3.4 12.5 ± 3.2 -1.39 ± 1.51 13.7 ± 4.6 13.9 ± 4.2 0.21 ± 2.25 .019 .002 Fat mass (kg) 2.9 ± 0.8 2.7 ± 0.8 -0.28 ± 0.34 2.8 ± 0.8 3.1 ± 0.8 0.30 ± 0.43 .840 <.001 Fat-free mass (kg) 18.0 ± 1.6 18.5 ± 1.7 0.46 ± 0.82 18.2 ± 2.8 19.3 ± 2.8 1.09 ± 1.30 <.001 .025
Table 4 Changes in Cardiovascular Function and Physical Fitness After Interventions in Obese Children
Exercise group (n = 21) Control group (n = 21) p for time
p for time*group
Variables Before After Change Before After Change
Systolic blood pressure (mmHg)
94.6 ± 6.7 86.9 ± 5.4
-7.67 ± 6.57 95.6 ± 7.5 96.2 ± 8.3
0.61 ± 7.70
.003 .001
Diastolic blood pressure
(mmHg) 59.8 ± 7.2 57.8 ± 5.2 -2.05 ± 8.29 59.2 ± 6.7 60.0 ± 6.2 0.81 ± 5.91 .580 .206 Stroke volume (ml) 33.2 ± 8.5 38.7 ±
5.7 5.48 ± 5.59 34.5 ± 5.1 37.5 ± 5.8 2.99 ± 3.44 <.001 .089 Left ventricle ejection
fraction (%) 71.2 ± 6.6 77.1 ± 4.2 5.94 ± 4.94 69.9 ± 5.8 74.4 ±6.1 4.51 ± 4.94 <.001 .353 20-m shuttle run test (laps) 12.9 ± 2.0 13.9 ±
1.6 1.05 ± 1.36 12.7 ± 1.3 13.0 ± 1.6 0.33 ± 1.20 .001 .078 Heart rate index 13.9 ± 1.2 13.0 ±
1.2 -0.96 ± 0.45 13.8 ± 1.1 13.6 ± 1.2 -0.24 ± 0.48 <.001 <.001 Hand grip (kg) 7.8 ± 1.4 9.1 ± 1.7 1.26 ± 1.48 7.7 ± 0.8 8.4 ± 0.9 0.62 ±
0.39 <.001 .064 Standing long jump (cm) 79.6 ±
13.9 93.3 ± 16.0 13.71 ± 10.54 78.3 ± 11.7 82.4 ± 11.6 4.05 ± 4.66 <.001 <.001 10-m x 4 shuttle run (s) 8.9 ± 0.4 7.2 ± 0.9 -1.72 ± 0.92 8.8 ± 0.5 8.2 ± 0.4 -0.56 ±
0.31 <.001 <.001 Sit-and-reach (cm) 7.6 ± 4.9 7.8 ± 4.8 0.24 ± 1.62 7.4 ± 3.1 7.6 ± 3.4 0.24 ±
1.12
.274 .997
10 continuous 2-legged
jumps (s) 7.2 ± 1.1 5.8 ± 1.1 -1.38 ± 1.62 7.4 ± 1.0 6.5 ± 1.2 -0.87 ± 0.78 <.001 .201 Throw a tennis ball (m) 4.8 ± 0.7 5.0 ± 0.8 0.24 ± 0.59 4.7 ± 0.9 5.0 ± 0.9 0.30 ±
0.44
.002 .690
3-m balance beam walk (s) 8.0 ± 1.5 6.3 ± 1.6 -1.76 ± 1.37 8.0 ± 1.3 7.3 ± 1.2 -0.63 ± 0.60
<.001 .001
Table 5 Changes in Cardiovascular Function and Physical Fitness After Interventions in Lean Children
Exercise group (n = 31)
Control group (n = 31)
p for time
p for time × group
Variables Before After Change Before After Change
Systolic blood pressure (mmHg)
87.5 ± 6.1 87.2 ± 4.7
-0.26 ± 4.27
87.4 ± 6.3 90.0 ± 4.8
2.65 ± 5.62
.065 .026
Diastolic blood pressure (mmHg)
58.4 ± 5.8 57.2 ± 4.0
-1.16 ± 6.15
58.3 ± 5.4 61.1 ± 4.7
2.71 ± 5.50
.300 .011
Stroke volume (ml) 30.2 ± 4.9 36.0 ± 7.2
5.75 ± 7.18
30.4 ± 7.4 34.3 ± 6.7
3.90 ± 7.74
<.001 .334
Left ventricle ejection fraction (%)
72.1 ± 6.2 75.5 ± 4.3
3.33 ± 5.42
72.9 ± 6.6 73.4 ±6.6 0.47 ± 7.03
.020 .078
20-m shuttle run test (laps) 14.3 ± 2.2 15.4 ±
1.7 1.06 ± 2.73 14.4 ± 1.9 14.7 ± 2.2 0.32 ± 3.00 .062 .313 Heart rate index 11.9 ± 1.5 10.8 ±
1.6 -1.17 ± 0.53 11.8 ± 1.4 11.7 ± 1.5 -0.12 ± 0.85 <.001 <.001 Hand grip (kg) 7.6 ± 1.5 9.1 ± 2.0 1.46 ±
1.19 7.7 ± 1.5 8.5 ± 1.3 0.75 ± 0.92 <.001 .010 Standing long jump (cm) 89.2 ±
12.6 95.3 ± 11.8 6.06 ± 5.14 89.8 ± 11.4 91.8 ± 12.6 2.02 ± 5.57 <.001 .004 10-m x 4 shuttle run (s) 8.0 ± 0.9 7.4 ± 0.6 -0.68 ±
0.58 7.9 ± 0.9 7.7 ± 1.0 0.21 ± 0.85 <.001 .014 Sit-and-reach (cm) 7.9 ± 4.5 9.0 ± 4.4 1.14 ±
0.78 8.1 ± 4.5 8.6 ± 4.3 0.55 ± 0.77 <.001 .004 10 continuous 2-legged
jumps (s) 6.5 ± 1.2 5.6 ± 0.9 -0.89 ± 0.69 6.3 ± 1.3 6.2 ± 1.1 -0.13 ± 0.84 <.001 <.001 Throw a tennis ball (m) 5.2 ± 1.1 5.5 ± 1.0 0.25 ±
0.79 5.4 ± 1.2 5.6 ± 1.3 0.17 ± 0.61 .022 .662 3-m balance beam walk (s) 7.6 ± 2.4 6.3 ± 2.0 -1.26 ±
0.76 7.4 ± 2.0 7.0 ± 1.8 -0.41 ± 1.26 <.001 .002