FLAME IMAGING USING OPTICAL SENSOR AND LASER
NUR FAIQAH BINTI FAUZI
Laporan ini dikemukakan untuk sebahagian daripada syarat penganugerahan Ijazah Sarjana Muda Kejuruteraan Elektronik (Kejuruteraan Komputer) Dengan Kepujian
Fakulti Kejuruteraan Elektronik dan Kejuruteraan Komputer Universiti Teknikal Malaysia Melaka
UNIVERSITI TEKNIKAL MALAYSIA MELAKA
FAKUL TI KEJURUTERAAN ELEKTRONIK DAN KEJURUTERAAN KOMPUTER BORANGPENGESAHANSTATUSLAPORAN
PROJEK SARJANA MUDA II
Tajuk Projek Sesi
Pengajian
FLAME IMAGING USING OPTICAL SENSOR AND LASER 2007/2008
Saya NUR FAIQAH BINTI FAUZI
mengaku membenarkan Laporan Projek Sarjana Muda ini disimpan di Perpustakaan dengan syatat-syarat kegunaan seperti berikut:
1. Laporan adalah hakmilik Universiti Teknikal Malaysia Melaka.
2. Perpustakaan dibenarkan membuat salinan untuk tujuan pengajian sahaja.
3. Perpustakaan dibenarkan membuat salinan iaporan ini sebagai bahan pertukaran antara institusi pengajian tinggi.
4. Sila tandakan ( " ) :
D
D
El
SULIT" TERHAD" .JrIDAK TERHAD(Mengandungi maklumat yang berdarjah keselamatan atau kepentingan Malaysia seperti yang termaktub di dalam AKT A RAHSIA RASMI 1972)
(Mengandungi maklumat terhad yang telah ditentukan oleh organisasilbadan di mana penyelidikan dijalankan)
(TAND~~
PENULlS) Alamat Tetap: PT 2055,"DIE BIN MOHO KHAFE
Pensyarah JALAN KAMPUNG TELOK
16300 BACHOK,
KELANTAN.
Tarikh: 91h May 2008
Fakulti Kej EIektrtnik dan Kej Kom,uter (FKEKK). Universiti Teknikal M.I.ysia Melaka (UTeM).
Karung Berkunci 1200. Hang T uah Jaya Ayer Keroh, 75450 Mel.aka.
"Saya akui laporan ini adalah hasH kerja saya sendiri kecuali ringkasan dan petikan
yang tiap-tiap satunya telah sayajelaskan sumbernya."
Tandatangan
:
...
j;t ...
.
... ..
Nama Penulis : Nur Faiqah Binti Fauzi
Tarikh : 9 Mei 2008
111
"Saya akui bahawa saya telah membaca laporan ini dan pada pandangan saya laporan ini adalah memadai dari segi skop dan kualiti untuk tujuan penganugerahan Ijazah Sarjana Muda Kejuruteraan Elektronik (Kejuruteraan Komputer) Dengan Kepujian."
Tandatangan Nama Penyelia Tarikh
IV
ACKNOWLEDGEMENT
First of all, I would like to express my highest gratitude to my supervisor En. Adie Bin Mohd Khafe as mentor and guidance throughout this final year project.
Unforgotten, I am also wanted to say thank you to my friends that directly or hidden involve in the effort to finishing this project.
v
ABSTRACT
VI
ABSTRAK
vii
TABLE OF CONTENTS
CHAPTER TITLE PAGE
DECLARATION ii
ACKNOWLEDGEMENT iv
ABSTRACT v
ABSTRAK vi
TABLE OF CONTENTS vii
LIST OF TABLES ix
LIST OF FIGURES
x
LIST OF SYMBOLS xii
LIST OF APPENDICES xiii
I INTRODUCTION
1.1
Objectives of the Project 31.2
Problem Statement 31.3 Project Scope
4
1.4 Project Methodology
5
II LITERATURE REVIEW
2.1
Basic Tomographic System 82.2
Sensor Type 132.2.1
Electrical Capacitance Tomography14
2.2.2
Ultrasonic Tomography15
2.2.3
Gamma Ray Tomography17
viii
2.3
Basic Principles of Laser19
2.3.1
Difficulties of Laser Beam Deliveries21
2.4
Laser Diode: Brief History21
2.4.1
Semiconductor Laser Diode22
2.5
The Photodiode25
2.5.1
Photodiode Responsitivity26
2.5.2
PIN Photodiode27
2.6
The Proposed Optical Tomography System27
III PROJECT METHODOLOGY
3.1
Literature Survey29
3.1.1
Process tomography29
3.1.2
Sensing Techniques30
3.1.3
Image Reconstruction Algorithms32
3.2
Design of Instrumentation System36
3
.
2.1
Sensor's Fixture36
3.2.2
Projection Modeling37
3.2.3
Sensor Modeling39
3.2.4
Transmitter and Receiver Selection40
3.2.5
Signal Conditioning Circuit41
3.2.6
Emitter and Receiver Circuit42
3.3
Data Acquisition System43
3.4
Data Selection47
3.5
Software Development48
IV RESUL T ANALYSIS AND DISCUSSION
4.l
Result50
4.1.1
Concentration Profile and Color Scale50
4.1.2
Result of Image Reconstruction53
v
CONCLUSION5.1
5.2
Conclusion
Suggestions for Future Works
56
NO
2.1
TITLE
Sensor Grouping
LIST OF TABLES
ix
PAGE
x
LIST OF FIGURES
NO TITLE PAGE
1.1 Flow Chart for Project Methodology 5
2.1 Two Orthogonal Projection 8
2.2 Two Rectilinear Projections 8
2.3 Three Rectilinear Projection 9
2.4 Combination of Orthogonal and Rectilinear Projection 9
2.5 Three Fan Beam Projection 10
2.6 Four Fan Beam Projection 10
2.7 Basic Structure of Semiconductor Laser 22
2.8 Spectral Wave Sensitivity for BPX 65 PIN Photodiode 25
3.1 Image Reconstruction 29
3.2 Position of Transmitter and Receiver 30
3.3 Diagram of Jig for Laser Based Tomography 34
3.4 Photo of Jig for Laser Based Tomography 35
3.5 The Two Dimensional Function F(x,y) Is Arranged Into 36
Two Orthogonal Projection
3.6 Corresponding Functional Block for Optical Tomography 39
3.7 Receiver Circuit for Optical Tomography System 40
3.8 Photo of Receiver Circuit for Laser Based Tomography 40
3.9 Block Diagram of Data Acquisition System 44
3.10 Calibration ofDAS Card 45
3.11 Calibration of DAS Card 45
Xl
3.13
Calibration of DAS Card46
3.14
Analog Input Data of the Heat Distribution47
3.15
Plotted Graph of the Value of Heat Distribution48
3.16
Flowchart for Concentration Profile Image Reconstruction49
4.1
Front Form Used To Start Concentration Profile51
4.2
GUI to Display Concentration Profile51
4.3
The Color Scale Used To Convert the Concentration52
Matrix to Image
4.4
Concentration Profile during Half Open Valve53
I
10
N
fl
VLBP(X,y)
SRx,TX of volt.
=
=
LIST OF SYMBOLS
Transmitted Intensity (Wm-2)
Initial Incident Intensity (Wm -2 )
Thickness Of The Absorbing Material (m) Linear Absorption Coefficient (m-2)
XII
Voltage distribution obtained using LBP algorithm (concentration profile in unit volt) an n x m matrix where n equals to dimension of sensitivity matrix.
Signal loss amplitude of receiver Rx-th for projection Tx-th in unit
M
Rx,Tx(X,y) = The normalized sensitivity matrices for the view of Tx-RxProjection Angle P0
x'
f(x,y) N Ma Rx,Tx
mRx,Tx
d
=
= = = = = =Detector Position In X-Plane Coordinate Of Real Object Total Number Of Receiver Total Number Of Projection
Width Of The Light Beam OfTx-Th Emitter To Rx-Th Receiver Angle Between The Tx-Th Emitter To Rx-Th Receiver
v(x,y)
pixelssum
xiii
= The Concentration Profile Obtains With Resolution Of n x n Pixels
For Modeled Image Or Reconstruction Image
The Total Of Pixels Occupied By Any Light Beam. Determined
By Counting The Number Of Elements In Total Sensitivity Matrix That
XIV
LIST OF APPENDICES
APPENDIX TITLE PAGE
A BPX 65 Pbotodiode Datasheet 58-62
B TL084 IC Datasheet 63-91
C Layout of PCB Circuit 92
D Source Code Program 93-97
CHAPTER I
INTRODUCTION
As defined in one encyclopedia (Helicon 1991), the word "tomography" is
derived from the Greek language which tama means "slice" and graph means
"picture". In another word, tomography is a method of viewing the plane section
image of an object.
Process tomography provides several real time methods of viewing the
cross-section of a process to provide information relating to the material distribution. This
involves by taking numerous measurement from sensors which placed around the
section of the process being investigated and processing the data to reconstruct an
image. The process involves the use of non-invasive sensors to acquire vital
information in order to produce two or three-dimensional images of the dynamic
internal characteristic of process system. Information on the flow regime, vector
velocity, and concentration distribution may be determined from the images. Such
information can assist in the design of process equipment, verification of existing
computational modeling and simulation techniques, or to assist in process control
2
Process tomography refers to any tomographic method used to measure the
internal state of a chemical process (e.g. material distribution in a reactor,
multi phase flow fields in piping or concentration uniformity in mixers). By
tomographic techniques can measure quantities such as the flow rate or solid
concentration of material flowing through a pipeline and the distribution of material
inside a chemical reactors or a mixer. This type of information is not usually
obtainable with the sensor traditionally used by engineer, therefore these techniques
gives a better understanding of the flow of material through the plant and the data
can be used to design better process equipment and to control certain processes to
maximize yield and quality.
From an engineering perspective, tomographic technology involves the
acquisition of measurement signals from sensors located on the periphery of an
object. This reveals information on the nature and distribution of components within
the sensing zone. Most tomographic techniques are concerned with abstracting
information to form a cross sectional image.
Basically, in tomography system several sensors are installed around the pipe
or vessel to be imaged. The sensor output signal depends on the position of the
component boundaries with their sensing zones. A computer is used to reconstruct a
tomographic image of the cross-section being interrogated by the sensor. Real times
image can be obtain which measure the dynamic evolution of the parameter being
3
1.1 Objectives of the Project
This project aims to investigate the use of tomographic measurement for
online monitoring of two-component especially providing cross sectional image of
flame concentration. The specific objectives of this project are:
1. To investigate the use of laser based tomography In measurement of
concentration profile of flame.
2. To implement the using of laser diode as the transmitter or source.
3. To utilize photodiode as a detector.
4. To develop cross sectional image using suitable software.
5. To measure the concentration profile and visualize an image reconstruction
of flame using Visual Basic 6.0
1.2. Problem Statement
This project actually can be applied in industrial heat process such as furnace,
oven, and brazing. This method is cheaper and safer than the most of the current
methods which mostly made use of radioactive methods. In industrial section, we
usually using transducer to detect and sense heat process. A transducer is a device,
usually electrical, electronic, electro-mechanical, electromagnetic, photonic, or
photovoltaic that converts one type of energy to another for various purposes
including measurement or information transfer. Transducers that we usually used in
heat industry are from thermoelectric type which is RTD (Resistance Temperature
Detector), thermocouple, thermistor and peltier cooler. We usually used thermistor
and thermocouple to detect and sense heat in industrial section.
In electronics, thermocouples are a widely used type of temperature sensor
and can also be used as a means to convert thermal potential difference into electric
potential difference. They are cheap and interchangeable, have standard connectors,
4
resistor used to measure temperature changes, relying on the change in its resistance
with changing temperature. But, usually conventional transducer which is
thermocouple and thermistor cannot detect and sense heat at specific point where
the sensor is located. The case of uniformity of heat distribution makes the
conventional transducer cannot detect. This type of information not usually
obtained with the traditionally sensor that always been used before.
1.3. Project Scope
1. The Sensor Fixture And Selection Of Sensors
i. To investigate the suitable mounting method of transmitter and
sensor
11. To investigate the suitable type of optical sensor.
2. Signal Conditioning Circuit
l. To design the receiver circuit with an appropriate gain and applying
suitable signal processing technique.
3. Designing Printed Circuit Board (PCB)
4. Data Acquisition System Design
I. To use a data acquisition system for signal or data that been obtained
from sensor.
5. Software Development
I. Design graphic user interface (GUI) using suitable software for
performing online image reconstruction.
5
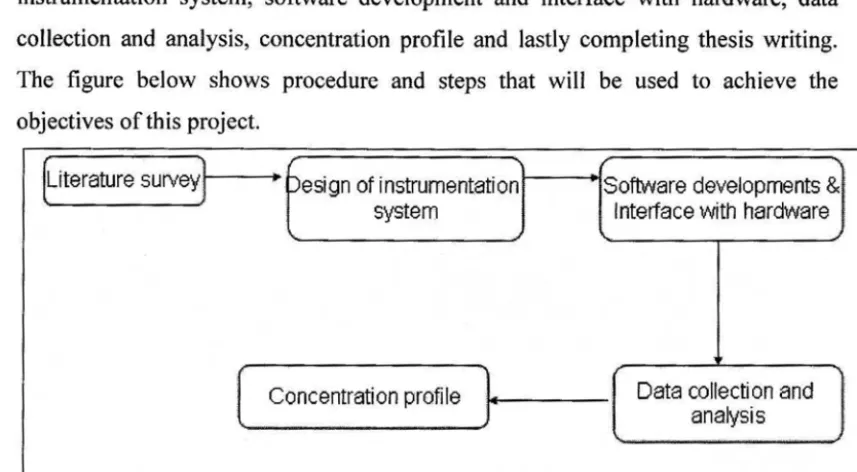
1.4. Project Methodology
This part is the explanation for the procedures and methods that will be used
to complete the project. It will explain step by step the process build the project until
it finished. The first step until the last step is literature survey, design of
instrumentation system, software development and interface with hardware, data
collection and analysis, concentration profile and lastly completing thesis writing.
The figure below shows procedure and steps that will be used to achieve the
objectives of this project.
[literature survey) "pesign of instrumentation Software developments &
system Interrace with hardware
[
Concentration profile].
Data collection and [image:21.612.69.498.218.454.2]analysis
Figure 1.1: Flow Chart for Project Methodology
1. Literature Survey
i. Process tomography
11. Sensing techniques
iii. Image reconstruction algorithm 2. Design Of Instrumentation System
1. Sensor fixture
ii. Transmitter and receiver
iii. Signal condition
3. Software development and interfacing with hardware
i. Software development
4. Data collection and analysis
i. Process measurement
II. Data collection and analysis
5. Concentration profile
i. Tomographic image reconstruction
CHAPTER II
LITERATURE REVIEW
Process tomography involves the use of non-invasive sensors to acquire vital
information in order to produce two or three dimensional images of the dynamic
internal characteristic of process systems. Information can assist in the design of
process systems. Information can assist in the design process equipment, verification
of existing computational modeling and simulation techniques, or to control and
monitoring.
At present, the usual objectives of using tomographic system is to obtain
concentration profile of moving components of interest within the measurement
section in the form of a visual image, which is updated at a refreshment rate
dependent upon the process being investigated.
Basically, in tomography system, several sensors are installed around the pipe
to be imaged. The sensor output signals depend on the position of the component
boundaries within their sensing zone. A computer is used to reconstruct a
tomographic image of the cross section being interrogated by the sensors. Real time
images can be obtained which measure the dynamic evolution of the parameters
8
updated frequently enough for the smallest relevant feature of the flow to be observe.
2.1 Basic Tomographic System
Tomographic techniques vary widely In their instrumentation and applications, all of them can be characterized by a common two step approach to the imaging process; firstly gather projection data based on some physical sensing mechanism, then reconstruct a cross sectional image from the projections. The term projection has a meaning tomography which a projection can be visualize as type of radiography of the process vessel.
In tomography, many projections are needed to reconstruct the interior volume or cross section of an object. Projection actually can be referred as sensor arrangement. There are several types of projection that can be applied in to measure flame concentration, which are;
1. orthogonal projection
1. two orthogonal projection (figure 2.1)
II. two rectilinear projection (figure 2.2) Ill. three rectilinear projection (figure 2.3)
IV. a combination of two orthogonal and two rectilinear projections (figure 2.4)
2. Fan beam projection.
i. Three fan beam projection (figure 2.5)