City, University of London Institutional Repository
Citation
:
Gonzalez, M. and Trujillo, L. (2007). Efficiency measurement in the port industry: a survey of the empirical evidence (07/08). London, UK: Department of Economics, City University London.This is the unspecified version of the paper.
This version of the publication may differ from the final published
version.
Permanent repository link: http://openaccess.city.ac.uk/1469/
Link to published version
:
07/08Copyright and reuse:
City Research Online aims to make research
outputs of City, University of London available to a wider audience.
Copyright and Moral Rights remain with the author(s) and/or copyright
holders. URLs from City Research Online may be freely distributed and
linked to.
Department of Economics
School of Social Sciences
Efficiency measurement in the port industry:
A survey of the empirical evidence
María Manuela González
1DAEA, Universidad de Las Palmas de Gran Canaria
Lourdes Trujillo
2City University and DAEA, Universidad de Las Palmas de Gran Canaria
Department of Economics
Discussion Paper Series
No. 07/08
1 Email: [email protected]
2 Department of Economics, City University, Northampton Square, London, EC1V
E
FFICIENCYM
EASUREMENT IN THEP
ORTI
NDUSTRY:
A
S
URVEY OF THEE
MPIRICALE
VIDENCEMaría Manuela González
[email protected]DAEA, Universidad de Las Palmas de Gran Canaria
Lourdes Trujillo
* [email protected]DAEA, Universidad de Las Palmas de Gran Canaria and CCRP, City University of London
Abstract
The purpose of this paper is to further the understanding of the port sector through a systematic analysis of the existing studies assessing the economic efficiency and productivity of the sector. The emphasis is on the measurement methodologies, the variables used and the results in terms of the various port activities as well as on the relevance of dimensions such as the size of the port, its ownership, location, etc. One of the main contributions of our analysis is the evidence provided of the need to very clearly isolate and spell out the port activity for which the efficiency assessment is being conducted. From an economic policy viewpoint, our assessment also points to the necessity of more closely involving the relevant authorities to improve the data collection system.
Classification JEL: L92, H54
1. Introduction and background
Studies that analyze ports from an economic perspective date back to the 1960s. The initial interest of researchers centred on aspects such as charging structure of the facilities, capacity and investment policies (Goss, 1967 and Heggie, 1974). The role of port infrastructure in economic activity soon gave rise to another line of research. These are the economic impact studies, in which port services are valued in terms of quantity of employment created or cost reductions (Waters, 1977; Chang 1978a).
In the following decades, the first manuals on port economy appeared (Peston and Rees, 1971; Bennathan and Walters, 1979; Jansson and Shnnerson, 1982), while the literature on ports covers new aspects of the industry such as productivity and its determinant factors (Suykens, 1982; De Monie, 1987; Dowd and Leschine, 1989; Tongzon, 1993 and 1995b; Talley, 1994; Sachish, 1996; Robinson and Everett, 1997; Fourgeaud, 2000). Investments (Shneerson, 1981) and planning (Bobrovitch, 1982; Shneerson, 1983; Goodman, 1984) continue being the object of analysis attempting to determine the optimum size of the infrastructure, using queueing theory and dynamic programming.
Another aspect that has generated interest is port privatization (Fernández et al. 1999; Trujillo and Nombela, 2000), promoting competition (Heaver, 1995), port selection criteria (Slack, 1985; Malchow and Kanafani, 2001), etc. Cost estimate and economies of scale studies have provided a deeper knowledge of ports and the factors that determine their costs (Reker et al., 1990; Martínez-Budría, 1996; Jara-Díaz, et al., 1997; Martínez-Budría et al., 1998; Jara-Díaz, et al, 2005).
Considering the wealth of existing studies, the literature on efficiency in the port industry is relatively new (the first studies appeared in the mid-90s) and modest, especially when compared to the studies carried out in other public services (electricity, water, banking, health, agriculture, etc.), including the transport sector, which has numerous publications related to the railway and airline sector.
However, in recent years, significant progress has been made in studies analyzing the efficiency and productivity of the port sector since, among other factors, ports constitute an interesting case study. Technological innovation processes occurring in the maritime and port industries, and changes in the organization and administration of ports, have conditioned a modification in the nature of the operations, fostering a greater specialization of the production inputs. These factors have had a great impact on the productivity and efficiency of port operations.
The studies on port efficiency and productivity can be classified into three main groups. The first is comprised of studies that employ partial productivity indicators of the port system. Studies with an engineering approach and that use simulations and queueing theory constitute the second group. The third is much more recent and covers technological frontier estimates, from which efficiency indexes of port firms are derived. Independently of the approach followed, a common characteristic is the interest in developing a tool to help guide decision-making, both from a business and an economic policy perspective.
as instruments for promoting competition (Australian Productivity Commission, 1998). There has been a surge in indicator studies in the last two decades, which is explained by the interest of the administrators and port operators in measuring the productivity of their activities with different aims in a simple manner: for commercial positioning, rendering accounts of their operation or verifying the effects of the reforms undertaken.
The main disadvantage of this methodology is its partial view, since it only consists of establishing relations between one output and one production input. Therefore, it does not allow the combined contribution of all the production inputs to be analyzed, nor does it treat the multi-output processes in an acceptable manner. This problem is especially relevant in the port sector, where the output is varied and various production inputs are used to obtain it.
To tackle this problem, total factor productivity (TFP) analysis is used. It is an index that reflects the global contribution of all the input factors that are relevant in obtaining all the outputs. The first application of this methodology to the port area is Kim and Sachish (1986) who found that the increase of the TFP in the port of Ashdod (Israel) was essentially due to technical progress and, to a lesser degree, to economies of scale. One decade later, Martínez-Budría et al. (1998) attributed the growth of TFP, in the area of State stevedoring corporations in Spain, basically to technical-organizational change and, to a lesser extent, to changes in the costs associated to increases in production. More recently, as will be seen in later sections, various authors have decomposed change in TFP into its determinant factors (Martín, 2002; Díaz, 2003; Estache et al., 2004).
The analysis of productivity from an engineering point of view takes into account the potential result that the firm has not exploited and which, therefore, could serve as a source for increasing its productivity. Using this approach, Sachish (1996) concludes that the main factors that affect the productivity of the Israeli ports (1966-1990) are the levels of activity and capital investment. After analysing the productivity of five U.S. container ports (1970-1978), De Neufville and Tsunokawa (1981) conclude that the productivity of the ports increases with size and that there are significant economies of scale, which leads them to recommend investing in large cargo centres and investing with caution in small ports.
Meanwhile, a generation of studies based on formal measures of efficiency appear, whose origins date back to the work of Chang (1978b), which can be considered the starting point in estimating the production functions in the port area. Even though this study opens the doors to estimating the frontiers of production, in the following years this line of research was not developed, instead the use of indicators continues to predominate.
In the mid-90s, the literature on efficiency, which had already been applied to numerous industries, was introduced in the port sector. The range of approaches applied reflects a lack of consensus in determining the method that best defines the complex reality of this sector. The main contributions of the research on port efficiency are summarised in Tables 2 and 3, which display some trends that we will comment on in later sections.
aims to contribute to improving the knowledge on the port sector, delving into aspects such as the effects on efficiency of port reforms; the so often debated relationship between type of ownership and efficiency; or between the latter and port size. As such, the objective of this research is to order the variety of studies that have been carried out on efficiency in the port sector in recent years. In this sense, its main contribution lies in detecting the gaps found in the literature on port efficiency with the goal of promoting future research. For example, one of the aspects not tackled in the literature is the multi-activity nature of the port industry, especially with regard to the definition of the appropriate variables for measuring the activity as a whole.
The rest of the paper is organized as follows. An introduction to the concept of efficiency and the techniques employed in its quantification are presented in section 2. In section 3, the methodological aspects of the literature on port efficiency are analysed, highlighting the variety of activities carried out in the port sector, the estimation method used and the variables used for defining the port inputs and outputs and other characteristics that affect port efficiency. Subsequently, a review is undertaken from the point of view of the objectives and results achieved in the studies reviewed. Thus, in section 4, the relationship between efficiency and various factors such as privatization, port size and port reform is analysed. Finally, the conclusions are presented in section 5.
2. Methodological Approaches: technological frontiers
The techniques for estimating productive efficiency appear once the empirical work demonstrates that producers do not always succeed in reaching their objectives of economic optimization even when they try. Given this evidence, the interest in getting an evaluation of the difference between what firms produce and what they could have produced arises, in other words, quantifying its inefficiency. This task is faced by measuring the distance that separates the production of each firm from the production obtained by the “best” firms observed if they employed the same vector of inputs as the firm analysed. This possibility is faced by developing a new analytical framework that, starting from the recognition of the optimizing conduct of the producers, recognises that these are not always successful. The new estimation methods must capture the possibility of different levels of success or failure among producers, or even accounting for the reasons for this failure.
The use of frontier models has spread considerably in recent years, being applied to numerous production sectors. Several reasons justify this development, among which the following may be highlighted (Bauer, 1990): the frontier concept is consistent with the economic theory of the optimizing behaviour of firms; deviations from the frontier can be directly interpreted as a measure of the efficiency through which firms achieve their objectives; and the information they provide in terms of the relative efficiency of firms has significant policy applications and is of great value to regulators and administrators.
2.1. Efficiency and productivity
The measure of efficiency is a concept directly related to the measure of productivity. However, they are not analogous notions, even though they are occasionally treated as synonymous, especially when the interest of the research is centred on comparing the performance of firms.
due to changes in efficiency, among other factors, may have had an influence in considering both terms as equivalent.
Total factor productivity is defined as the ratio of a function that adds the outputs and of a function that adds the inputs. Meanwhile, efficiency rests on the comparison of observed values of outputs and inputs with many optimum relative values, arising from the evidence provided by other firms.
The following example clarifies the distinction between efficiency and productivity. Let us assume a production function that defines the technology of the port industry. Efficient ports are located on the frontier and the inefficient ones below it. Productivity in the port sector can improve in two ways at least.1 The first requires introducing technical progress, for example, through new merchandise handling equipment, which would shift the frontier upwards. The second consists of introducing a greater degree of efficiency in the industry, for example, improving the qualifications of the workers so that they can use the new and sophisticated mechanical equipment more efficiently. This would bring the inefficient ports nearer to the frontier, since their efficiency has been improved through training. This situation is presented in Graph 1.
Graph 1. Change in productivity: change in efficiency, scale and technical change
At first (t), the frontier is defined by function f(x,t) and the firm is located in situation A, operating with productivity Pt, where x denotes the production input used to obtain product y. In the following period (t+1), the firm will operate in point B, due to an increase in productivity (Pt+1) which, in turn, is the result of a technical change (shift of the frontier to
f(x, t+1) and an improvement in the technical efficiency (firm approaching the frontier: the distance of point A to the frontier in t is greater than the distance of B to the frontier in t+1). Clearly a technological improvement as well as an increase in efficiency will lead to greater
1
In a productive environment characterized by the presence of variable returns to scale, productivity can also improve due to changes in the efficiencies of scale.
y
B
x A
f(x, t+1)
f(x, t)
xt+1
xt yt+1
yt
Pt+1
productivity. It should also be kept in mind that this positive behaviour is counteracted by the effect of the decreasing returns to scale, since production has increased by a lower proportion than the input.
2.2. Efficiency measure: Background
The literature on technical efficiency dates back to the early 1950s. The first formal definition of technical efficiency comes from Koopmans (1951) and the first measure of technical efficiency was proposed by Debreu (1951) and Shephard (1953), even though with a different orientation (output and input, respectively). Despite the theoretical relevance of these studies, efficiency was not quantified in any of these. This task was undertaken by Farrell (1957), who is considered the pioneer in the measurement of technical efficiency2
.
The concepts of efficiency are presented in Graph 2. y=f(x1, x2) is the function of efficient production, where x1 and x2 denote the two inputs used in obtaining output y. The assumption of constant returns to scale allows the efficient production function to be characterized through the unit isoquant 1=f(x1/y, x2/y) (SS´ curve).
Let us assume that a firm uses the quantities of inputs x1*, x2* represented by point P to obtain a unit of output y*. Point Q represents an efficient firm that uses the same proportion of inputs as P. As such, the same quantity of P can be produced using only the fraction OQ/OP
of inputs. This ratio, which measures the proportion of inputs which is really necessary, becomes a measure of the technical efficiency of firm P. This ratio takes values between one, if the firm is efficient, and zero, if otherwise.
Graph 2. Technical and allocative efficiency (Farrell, 1957)
2
Farrell defines three concepts of efficiency: technical efficiency, price efficiency and global efficiency, which are constructed under the assumption that an efficient production function is known. Over time, the academic studies coined different terms to those established by Farrell (except for technical efficiency which has held over time). Thus, price efficiency is known as allocative efficiency, global efficiency as economic efficiency and an efficient production function is known as a frontier production function. Despite the change of terms, the Farrell measure is the most widely accepted and used.
x2/y
A
´
A
S
´
S
P
Q´ Q
R
Points Q and Q´ represent a technically efficient firm. The difference between both arises when the prices of the production inputs are taken into account. Consider the straight isocost
AA´, whose slope is equal to the ratio of the prices of the inputs. In this new situation, even though both points represent full technical efficiency, given the prices of the inputs, the cost of production is only minimized in point Q´. Considering that the cost in R is the same as in
Q´, the allocative efficiency is defined as the ratio OR/OQ. A value of 1 of this quotient indicates allocative efficiency and values below the unit indicate the degree of allocative efficiency achieved by the firm.
Lastly, if the firm observed were efficient, from the technical point of view, as well as in relation to the prices of the inputs, its costs would be the proportion OR/OP of what they really are. This ratio is named total economic efficiency and can be obtained as the product of technical efficiency and allocative efficiency.
2.3. Estimate of the frontier: parametric versus non parametric approach
The measure of efficiency is linked to the estimation of a frontier, since in order to estimate the efficiency of a production unit, it is necessary to have a standard with which to make the evaluation. For example, in order to claim that a port can cater for 20% more ships, with the means at its disposal (workers, infrastructure, mechanical elements, etc.), it is necessary to know the reference used to measure the 100% level.
In the last three decades, two approaches have been developed to estimate the frontier and measure efficiency: the econometric approach, whose main example is stochastic frontiers3, and the linear programming techniques, represented basically by Data Envelopment Analysis (DEA).4
The essential difference among these methodologies, from which their advantages and disadvantages arise, can be reduced to the following two characteristics (Lovell, 1993). On the one hand, the econometric approach is stochastic and can therefore distinguish the noise effects from the inefficiency effects, while the linear programming approach is not stochastic and deals with the noise and inefficiency together, both termed inefficiency. On the other hand, the econometric approach is parametric and confuses the effects of a bad functional specification (of both technology and inefficiency) as inefficiency. The linear programming approach is not parametric and, therefore, is less sensitive to this type of error, even though it is sensitive to the type of returns to scale admitted.
Thus, the main advantages of the linear programming method are not imposing any functional form a priori on the data and handling multi-output processes easily. However, its disadvantages include that the estimated frontier and, therefore, the measure of efficiency can be contaminated if there is random noise; and that, since it does not make assumptions on the distribution form of the error term, it does not allow for hypothesis to be contrasted.
3
The following studies can be referred to in the area of econometric techniques: Førsund et al. (1980), Schmidt (1985-86), Bauer (1990), Battese (1992), Fried et al. (1993), Färe et al. (1994), Coelli (1995), Pesaran and Schmidt (1997), Coelli et al. (1998), Kalirajan and Shand (1999), Kumbhakar and Lovell (2000) and Álvarez (2001).
4
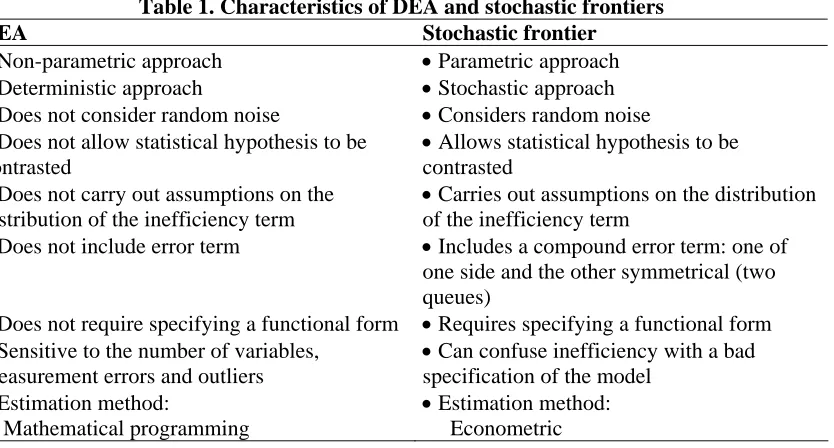
Econometric models consider random noise and can thus separate the measurement errors of efficiency estimates; they allow hypothesis to be contrasted; and, in their cost frontier version (income or profit) or distance function, can estimate frontiers that consider more than one output. Its disadvantages include the possibility of classifying a bad specification of the model as inefficiency, and that the decomposition between noise and inefficiency can be affected by the functional form specified for the error term. Greater detail of the main differentiating elements of these approaches is provided in Table 1.
It is obviously desirable to equip the linear programming approach with a stochastic nature and the stochastic approach with more flexibility in the parametric structure. In fact, theoretical as well as empirical developments are occurring in both senses.
[image:10.595.97.514.295.519.2]In summary, none of these two approaches dominates the other; each has advantages and disadvantages, even though each has serious advocates. Therefore, the use of one or the other method will depend on the concrete case of study.
Table 1. Characteristics of DEA and stochastic frontiers
DEA Stochastic frontier
• Non-parametric approach • Parametric approach
• Deterministic approach • Stochastic approach
• Does not consider random noise • Considers random noise
• Does not allow statistical hypothesis to be contrasted
• Allows statistical hypothesis to be contrasted
• Does not carry out assumptions on the distribution of the inefficiency term
• Carries out assumptions on the distribution of the inefficiency term
• Does not include error term • Includes a compounderror term: one of one side and the other symmetrical (two queues)
• Does not require specifying a functional form • Requires specifying a functional form
• Sensitive to the number of variables, measurement errors and outliers
• Can confuse inefficiency with a bad specification of the model
• Estimation method:
Mathematical programming
• Estimation method: Econometric
3. Efficiency and productivity in the port sector: methodologicalaspects
A summary of the investigations on efficiency in the port sector is presented in Tables 2 (parametric approach) and 3 (non-parametric approach). These Tables contain synthesized information on the analysed activity (provision of infrastructure, cargo handling terminals, etc.), the type of sample (cross-section/panel data, country and time period), the variables (outputs, inputs and other variables), the methodology (model, functional form and estimation method) and the efficiency results. 5
With regard to the type of sample, most authors use panel data for countries from practically the whole world (Asia, Europe, America), highlighting eight studies centred on Spanish ports. The rest of the main aspects of the research are discussed in more detail in the following sections.
5
3.1. Activity analysed
Ports are complex organizations where multiple activities take place, with a large variety of agents (port authorities, tug boats, consignees, etc.). Furthermore, port activities and services differ from each other in aspects such as the nature of the operations carried out (provision of infrastructure, docking, handling of merchandise, administration, assistants and passenger services), the objectives sought (only in the area of the port authorities, Suykens (1986) identifies eleven objectives such as moving the largest amount of merchandise, favouring employment and regional economic development, protection of the environment, etc.), the degree of competition in which they take place (pilotage is a monopoly, the towing or loading/offloading of merchandise services are provided with a lower degree of competition and the consignment service has a higher level of competition, De Rus et al., 1995) or the level of regulation to which they are subject (consignment only requires an administrative authorization to operate, while services such as pilotage are subject to higher degrees of intervention, to guarantee the security of the shipping entry and exit operations).
All of the above considerations make the study of ports as a homogenous entity more difficult. Therefore, it is not advisable to study ports as a whole; instead it is preferable to centre the analysis on a concrete activity (Nombela and Trujillo, 1999), on a specific type of cargo and a limited number of ports (Tongzon, 1995a, 1995b, 2001). Thus, at least as regards estimating production or cost functions, it is advisable to analyse a given activity.
In some of the studies reviewed, the activity whose efficiency is being analysed is not clearly identified, which produces a certain degree of confusion, since while in some cases supposedly the efficiency of the port system is being studied, the data actually used seems to indicate that in fact the efficiency of the provision of infrastructure services by the port authorities is being studied. In other words, sometimes the concept of port is used synonymously with port authority. However, the latter is simply one of many agents that operate in ports.
For example, Tongzon (2001) attempts to measure the efficiency of port services in a broad sense, including the handling of merchandise, even though since it lacks data on the workers involved in this operation, it uses the workers of the port authorities that do not participate in cargo handling as an approximation. The object of analysis of Martín (2002) is the global activity of a port but the unit of analysis is the port authority. Meanwhile, to measure the work input, it incorporates the workers of the port authority (unit analysis) such as the stevedores (the workers that handle the cargo) that, in turn, provide their services to two different agents: stevedoring firms (carry out the loading and offloading) and State stevedoring corporations (supply workers to the stevedoring firms).
Liu (1995) and Roll and Hayuth (1993) start by recognising that the port production process is complex and, therefore, considers the port activity in a broad sense, without further specifications. Park and De (2004) also do not specify the activity analysed.
considered individually, they finally analysed the terminals of each port as a whole, since the data used aggregated the individual terminals within each port.
Díaz (2003) analyses the stowage sector as a whole. Agents that supply the labour force operate in this activity (State stevedoring corporations, stevedoring firms and temporary work firms) and agents that provide the capital equipment (port authorities and firms that own the cranes).
3.2. Methodology
The approaches used for evaluating efficiency are distributed equitably among stochastic frontiers and DEA, which highlights the lack of consensus for determining the approach that better reflects the port technology. The variety of methods used varies relative to the assumptions and hypothesis that each of them considers.
Seven of the studies that use stochastic frontiers estimate a stochastic production frontier to calculate the technical efficiency (Liu, 1995; Notteboom et al., 2000; Cullinane and Song, 2003; Cullinane et al., 2002; Estache et al., 2002, Tongzon and Heng, 2005). The functional form chosen in most of the studies is Cobb-Douglas, even though the translog function has also been estimated (Liu, 1995, Estache et al., 2002). Only the work of Liu (1995) incorporates technological change in the model specification. The main estimation method is maximum likelihood. In fact, even though Liu (1995) has applied other estimators, the Hausman test finally leads us to consider the above method as the method of choice. The work of Notteboom et al. (2000) is noteworthy as the only one that applies Bayesian techniques to stochastic frontiers in the port area.
Díaz, 2003, Coto-Millán, et al., 2000 and Baños-Pino et al., 1999 quantify economic efficiency using a stochastic cost frontier, in which technological change is well specified as a trend or as temporal effects. The first introduces a quadratic function estimate, which has the advantage of allowing zeros to appear in the vector of outputs, which occurs commonly in multi-output activities. The other two studies have also opted for the specification of a flexible functional form, which in this case is the translog. Baños-Pino et al. (1999) combine the cost frontier with the input oriented distance function, to measure the capacity of the capital stock. However, by considering an only output, they do not exploit the potential of the distance function for admitting multiple outputs, becoming in effect a production function.
The first study to estimate a multi-output distance function in the port area is González (2004). Subsequently, Rodríguez-Álvarez et al. (2007) estimate a system of compound equations for a distance function and the input spending equations. Both studies specify a translog function and model the passing of time through temporal effects.
Table 2. Efficiency measurements in port sector: parametric approach Autor Activity (1) Data (2) Model (3)
Functional form Variables
(4) Estimating method (5) Efficiency measurement (6) Liu (1995)
(D) Panel data UK (28) 1983-1990
SFP Translog Technological change
Neutral/non neutral
Y2 (X1, X2, T)
E (Z1, Z2, Z3, Z4)
Model 1: OLS, ML Model 2:
Within, GLS, ML
Technical efficiency Mod 1 (ML): Mod 2 (ML): Mod 2 (ML, T):
1983-1990 78.0 68.3 69.7 Baños-Pino et al.
(1999)
(A) Panel data S (27) 1985-1997 SFC DF Translog Temporal effects
VC (Y1, X3, W1, W2, W3,
T)
D (Y1, X1, X2, X3, X4, T)
Instrumental variables Technical efficiency Maximum: Minimum: Average: 1985-1997 100 15 41 Coto-Millán et al.
(2000)
(A) Panel data S (27) 1985-1989 SFC Fixed effect Translog Technological change Non neutral
TC (Y1, W1, W2, W3, T)
E (X3, Z3)
Within Economic efficiency Maximum: Minimum: Average: 1985-1989 100 11 33 Notteboom et al.
(2000)
(B) Cross sectional EU (36), ASIA (4) 1994 SFP Bayesian Cobb-Douglas No technological change
Y6 (3X3) Monte Carlo Technical efficiency
Pooled 36 terminals: Pooled 40 terminals:
1994 77.0 78.6 Estache et al.
(2002)
(A) Panel data MEX (11) 1996-1999 SFP Translog Cobb-Douglas No technological change
Y1 (X1, X3) ML Technical efficiency
Average: Grow rate:
1996-1999 50.5
3.3
Cullinane et al. (2002)
(B) Unbalanced panel data ASIA (15) 1989-1998 SFP Cobb-Douglas No technological change
Y6 (3X3) ML Technical efficiency
Table 2. Efficiency measurements in port sector: parametric approach (continued). Author Activity (1) Data (2) Model (3)
Functional form Variables
(4)
Estimating method (5)
Efficiency measurement (6)
Cullinane and Song (2003)
(B) Unbalanced panel data
KOR (2), UK (3) 1978-1996
SFP Cobb-Douglas No technological change
Y2 (2X1, 2X2) ML Technical efficiency
Half-normal: Exponential: Truncated-normal: 1978-1996 63.1 71.0 69.3 Díaz (2003)
(B) Panel data S (21) 1990-1998 SFC Cuadratic Non neutral technological change
TC (2Y1, Y6, W1, W2, T) SURE Average efficiency
Technical: Asignative: Cost: 1990-1998 90.6 95.1 86.1 González (2004)
(A) Panel data S (9) 1990-2002
DF Translog Temporal effects
D (2Y1, Y6, Y7, X1, 2X3,
Z2, Z5, T)
ML Average efficiency Technical:
Grow rate:
1990-2002 91.9 -0.89 Tongzon and Heng
(2005)
(B) Cross sectional INT (25)
SFP Cobb-Douglas No technological change
Y6 (3X3, Z1, Z3) ML Average efficiency: 86.6
Rodríguez-Álvarez et al.
(2005)
(B) Panel data S (3) 1992-1998
DF Translog Temporal effects
D (3Y1, 3X1, X2, X4, X7,
T)
CS (3Y1, X1, X2, X4, X7)
ITSUR - -
Cullinane et al. (2006)
(B) Cross sectional INT(57) 2001
SFP Cobb-Douglas No technological change
Y6 (2X3) ML Technical efficiency
Half-normal: Exponential: Truncated-normal: 2001 77.0 71.2 79.1 (1) In brackets port activity. A: Provision of infrastructure by port authorities; B: Handling of merchandise; C: Confuse; D: Not specified.
(2) In brackets number of ports. UK: United Kingdom; S: Spain; MEX: Mexico; KOR: Korea.
(3) SFP: Stochastic Frontier Production; SFC: Stochastic Frontier Cost; DF: Distance Function; CS: Cost share.
(4) TC: Total cost; VC: Variable cost; D: Distance; E: Efficiency index; Y1: Output (cargo); Y2: Output (income services); Y3: Service level (containers or cargo/hour); Y4:
User satisfaction; Y5: Ship calls; Y6: Containers; Y7: Passengers; X1: Labour input; X2: Capital input (monetary units); X3: Capital input (physical units); X4: Intermediate
inputs; X5: Cargo Uniformity; X6: Waiting time; X7: Cuasi-fixed input; W1: Labour price; W2: Capital price; W3: Intermediate cuasi-fixed input price; T: Time trend or
temporal dummy; Z1: Size of port/terminal area; Z2: Port localization; Z3: Port ownership; Z4: Capital intensity; Z5: Refinery.
(5) OLS: Ordinary least squares; ML: Maximun likelihood; GLS: Generalizad least squares; SURE: Seemingly Unrelated Regressions Estimation; ITSUR: Iterative Seemingly Unrelated Regressions.
Table 3. Efficiency measures in port sector: non parametric approach Autor Activity (1) Data (2) Variables (3) Model (4) Efficiency measurement (5)
Roll and Hayuth (1993)
(D) Cross sectional Hypothetical
Y1, Y3, Y4, Y5, X1, X2,
X5
- Average efficiency
Total port: Region 1: Region 2: 1993 78.2 93.4 86.1 Martínez-Budría et al.
(1999)
(A) Panel data S (26)
1993-1997
Y1, Y2, X1, X2, X4 DEA-BCC Average global efficiency
Group I: Group II: Group III: 1993-1997 88.7 80.1 85.7 Tongzon (2001)
(C) Cross sectional INT(16)
1996
Y3, Y6, X1, 4X3, X6 DEA-CCR
DEA-Additive Average efficiency CRS: VRS: 1996 59.5 93.1 Martín (2002)
(C) Panel data S (27)
1990-1999
2Y1, 2X1, 2X3, X4 TFP
Malmquist index DEA-BM Average efficiency 1990: 1999: 38.8 40.3 Bonilla et al.
(2002)
(A) Panel data S (26)
1995-1998
3Y1, X3 DEA-CCR Average efficiency
26 port authorities: 23 port authorities:
1995-1998 57.4 76.4 Barros
(2003)
(A) Panel data P (5)
1999-2000
5Y1,Y2, 2Y5, Y6, Y7, X1,
X2
W1, W2
DEA-CCR Economic efficiency CRS:
VRS:
71.3 88.1 Cullinane et al.
(2004)
(B) Panel data INT (25)
1992-1999
Y6, 5X3 DEA-CCR
DEA-BCC Efficiency index CCR (max/min): BCC (max/min): 1992-1999 98.22/33.47 98.84/43.47 Estache et al.
(2004)
(A) Panel data MEX (11)
1996-1999
Y1, X1, X3 TFP
Table 3. Efficiency measures in port sector: non parametric approach (continued) Autor Activity (1) Data (2) Variables (3) Model (4) Efficiency measurement (5)
Park and De (2004)
(D) Cross sectional KOR (11)
1999
3Y1, Y2, Y4, Y5 DEA-CCR
DEA-BCC Global efficiency CCR: BCC: 1999 0.45 0.60 Barros and Athanassiou
(2004)
(A) Panel data P (4) GR (2) 1998-2000
2Y1, Y5, Y6, X1, X2 DEA-CCR
DEA-BCC Efficiency index CCR: BCC: 1998-2000 0.87 0.90 Cullinane et al.
(2005-a)
(B) Panel data INT (30)
1992-1999
Y6, 5X3 DEA-CCR
DEA-BCC Technical efficiency CCR: BCC: 1992-1999 69.3 85.9 Cullinane et al.
(2005-b)
(B) Panel data INT (57)
2001
Y6, 5X3 DEA-CCR
DEA-BCC FDH Technical efficiency CCR: BCC: FDH: 2001 57.6 76.3 89.5 Cullinane et al.
(2006)
(B) Panel data INT (57)
2001
Y6, 5X3 DEA-CCR
DEA-BCC Technical efficiency CCR: BCC: 2001 57.6 73.8 Wang and Cullinane
(2006)
(B) Cross sectional EU (104)
2003
Y6, 3X3 DEA-CCR
DEA-BCC Technical efficiency CCR: BCC: 2003 43.0 44.0 (1) In brackets port activity. A: Provision of infrastructure by port authorities; B: Handling of merchandise; C: Confuse; D: Not specified.
(2) In brackets number of ports. S: Spain; AUS: Australia; P: Portugal; INT: International; KOR: Korea; GR: Greek.
(3) Y1: Output (cargo); Y2: Output (income services); Y3: Service level (containers/hour); Y4: User satisfaction; Y5: Ship calls; Y6: Containers; Y7: Market share;
X1: Labour input; X2: Capital input (monetary units); X3: Capital input (physical units); X4: Intermediate inputs; X5: Cargo uniformity; X6: Waiting time; X7: Operative costs;
W1: Labour price; W2: Capital price.
(4) BCC: Banker, et al., 1984; CCR: Charnes et al., 1978; BM: Banker and Morey (1986).
The most used method of non-parametric methodology is the DEA. The approaches that are most used for applying the DEA are those proposed by Banker et al. (1984), which admits variable returns to scale (BCC) and by Charnes et al. (1978), which assumes constant returns to scale (CCR). The results arising from the application of both methods are compared by Cullinane et al. (2004, 2005a and 2006), Park and De (2004), Barros and Athannasiou (2004) and Wang and Cullinane (2006); Cullinane et al. (2005b) also compare the results with another linear programming technique: Free Disposal Hull (FDH), whose specification is more conservative than DEA.
Martínez-Budría et al. (1999) use the BCC approach and, to carry out a comparison among port authorities as homogenously as possible, they divide the sample into four categories, according to their complexity. The CCR method is used by Barros (2003), Tongzon (2001), who compares the results with those obtained after the application of the additive model (Charnes et al., 1985), and by Bonilla et al. (2002). This latter study allows a criticism levelled at the results of DEA to be overcome, which is that the DEA estimators are deterministic, in other words, that they lack a statistical base. In this sense, the work of Bonilla et al. (2002) is a novel contribution, since the application of bootstrap techniques allows statistical inference to be made in the non-parametric estimates, obtaining confidence intervals of the efficiency results.
Martín (2002) uses the model proposed by Banker and Morey (1986), since it better fits the hypothesis established, and calculates a Malmquist index for determining if there have been improvements in productivity and carries out a decomposition isolating the technical progress of the efficiency improvement. Estache et al. (2004) also identifies the sources of the productivity gains, decomposing the change in TFP into its main components by means of a Malmquist index, built from distance functions calculated by DEA.
Two studies introduce extensions to DEA. Cullinane et al. (2004) carry out a dynamic analysis applying the DEA windows analysis. Park and De (2004) apply a four-stage DEA: alternating the consideration of the variables as inputs and outputs, they measure the productivity (stage 1), profitability (stage 2), marketability (stage 3) and the overall efficiency (stage 4).
Lastly, Roll and Hayuth (1993) apply a DEA to simulated data with the goal of demonstrating the idealness of this method for measuring port efficiency, and the use of efficiency indexes for proposing ways of improving efficiency and exercising control over the activity of the operators.
3.3. Outputs
This over simplified conception of the port industry has started to change in the last decade. It is not simply about recognising the importance of passenger traffic, but rather of recognising that the specialization of cargo leads to such specific requirements (infrastructure and very specialised equipment), that some types of merchandise must be considered differentiated products.
The definition of the port output depends on the service considered. For example, if the towing activity is considered, the output will be towed ships, that can be measured in physical units or units of tonnage. If a terminal specialised in containers is studied, this will be the output to consider, that can be measured in three units: merchandise transported (tonnes), size (TEUs6) or movement carried out (number). In any case, most of the studies measure containers through the TEUs moved.
There is no uniformity in the treatment of the output among the studies reviewed. While in most studies the output is measured in terms of physical quantity of merchandise, three studies do so based on the income that the merchandise generates for the port firms. Liu (1995) measures the output in terms of turnover, in other words, as the amounts received from third parties related to the port services, excluding income from the sale of goods. This approach works from the assumption that British ports are highly competitive and, therefore, port charges are set according to costs; thus, invoicing will be a good reflection of the output. With regard to container traffic, this approach is used by Cullinane and Song (2003) and also by Martínez-Budría et al. (1999) to define one of the components of the multi-output vector.
Even though there is broad consensus in the port literature on the multi-output nature of port activity, this characteristic is not always captured in the studies that estimate efficiency in the sector, due to multiple reasons.
In the area of stochastic frontiers, only three studies bring together various outputs. Díaz (2003) distinguishes between three types of cargo that, by their nature, require different methods of handling: container merchandise, general conventional merchandise and solid bulk that does not require special installations for its offloading. González (2004) considers four outputs: containers, liquid bulk, remaining cargo and passengers; the incorporation of this latter variable is a novelty in the port area. Rodríguez-Álvarez et al. (2007) distinguish between containers, rolling loads and general merchandise.
However, sometimes the available data does not allow this distinction of outputs (Estache et al. 2002, 2004; Tongzon and Heng, 2005). Therefore, in some cases different kinds of cargo are added. Coto-Millán et al. (2000), following Martínez-Budría (1996), add three components of port activity: cargo moved, boarded and unboarded passengers and vehicles with passengers. Other studies measure the output based on the total merchandise handled (Baños-Pino et al., 1999) or in concrete traffic, such as for example, containers, since it analyzes the activity of cargo terminals and container offloading (Notteboom et al., 2000; Cullinane et al., 2002; Tongzon and Heng, 2005; Cullinane et al., 2006). Even though initially Tongzon (2001) considers the multi-output dimension of the port sector, he finally opts for a simple production measure, since the results obtained are not very realistic.
6
Most of the studies that apply DEA reflect the multi-output nature of port activity, even though the definition of the outputs varies among each other. The exceptions are the works of Estache et al. (2004), that employ the total quantity of merchandise, Cullinane et al. (2004, 2005a, 2005b and 2006) and Wang and Cullinane (2006) that, since they analyze container terminals, approach the port output with the TEUs.
The paper that distinguishes the greatest quantity of outputs is Barros (2003): number of ships, movement of freight, gross tonnage, market share, break-bulk cargo, containerised cargo, roll-on/roll-off traffic, dry bulk, liquid bulk, and net income. Barros and Athannasiou (2004) distinguish the following: number of ships, movement of merchandise, cargo handled and containers. Park and De (2004) use different approaches to the output, depending on what is being measured: total merchandise and number of ships (productivity); income (profitability); customer satisfaction (commercialization and global efficiency). Martínez-Budría et al. (1999) represent the multi-output nature of the activity of port authorities through the total merchandise handled, considering the activity of provision of infrastructure, and of income from installation rental, that measures the capacity of said authorities to attract economic activity. For Roll and Hayuth (1993) the multi-output nature is defined through the following factors: total cargo considered (in order to reflect the effort needed to move one tonne of each kind of cargo); level of service (ratio between handling time and total time that a ship remains in port); customer satisfaction (measured through a survey); and number of ships.
3.4. Production inputs and their prices
The capital production inputs and work form part of nearly all empirical applications analysed, however, not all authors introduce intermediate inputs into the analysis. There is widespread consensus among authors regarding how to approach the labour input, with a greater diversity in estimating the capital input.
Most authors use the number of employees to measure the labour input, even though Díaz (2003) quantifies it from hours worked. Other authors employ a monetary approach (Liu, 1995; Martínez-Budría et al., 1999), since they consider that the total value of salary payments is a good measure of work. Cullinane and Song (2003) follow this method, distinguishing among the remuneration of directors and executives and employees, to capture the differences in work qualifications. Cullinane et al. (2002, 2004, 2005a, 2005b and 2006), Notteboom et al. (2000) and Tongzon and Heng (2005) do not incorporate the labour input. The argument made is that there is a fixed relationship between the number of cranes and the number of port workers of a container terminal, and so they assume that the capital input, in some way, incorporates a measure of the work input. This is a somewhat restrictive assumption, in fact despite using it, Cullinane et al. (2004) cautions its use.
studies also incorporate the surface area of the port. Rodríguez-Álvarez et al. (2007) regard the range of tangible assets of the firm as capital, taken as the sum of the accounting amortization and the return on live capital of the period; as a quasi-fixed input they use the total surface of the port. The only capital measure considered by Estache (2002, 2004) is the surface tendered to the port authorities. Tongzon and Heng (2005), Cullinane et al. (2002, 2004) and Notteboom et al. (2000) incorporate three variables to measure the capital used by the container terminals: docks, surface and cranes (Cullinane et al., 2004, 2005a and 2005b distinguish three types of cranes). Even though, they started from the same inputs used in earlier works, after the application of the likelihood ratio test, Cullinane et al. (2006) only include two types of cranes. Wang and Cullinane (2006) consider the length and surface of the terminal and the equipment costs. Tongzon (2001) also incorporates the above, the number of tug boats and the area of the terminals, which represent the land input. Given that Díaz (2003) analyses the stevedoring sector, the capital measure is based on the usage time of the cranes. Park and De (2004) employ the following variables to represent the inputs: docking capacity and cargo handling capacity (productivity and overall efficiency), cargo throughput and number of ship calls (profitability) and income (marketability).
Other production inputs considered are the intermediate inputs, which include consumption expenses, energy, external work and other current expenses, that do not correspond to operations nor personnel (Martínez-Budría et al., 1999; Baños-Pino et al., 1999; Martín, 2002; Rodríguez-Álvarez et al., 2007); and uniformity of cargo, which attempts to capture the specialization of ports (Roll and Hayuth, 1993). Tongzon (2001) adds a quality variable measured through waiting time. Bonilla et al. (2002) present available equipment as an intermediate input, without further specification.
In studies that estimate cost functions (Baños-Pino et al., 1999; Coto-Millán et al., 2000; Díaz, 2003) the price of the work is obtained dividing the total labor cost among the number of employees (Díaz, 2003 divides it by the hours worked); however differences are observed in determining the price of the capital. While for Coto-Millán et al. (2000) the ratio between the amortization of the period and the length of the docks is a reasonable approach, Baños-Pino et al. (1999) use the ratio of the investment made in a year over the previous year, and Díaz (2003) divides the aggregate spending for the use of cranes with the usage time of said cranes.
Coto-Millán et al. (2000) and Baños-Pino et al. (1999) estimate the price of the intermediate inputs based on the quotient between the cost of said inputs and the port activity, measured as the total merchandise handled. The only non-parametric study that incorporates the price of the inputs (work and capital) is Barros (2003). The price of labour is obtained in the traditional manner and the price of capital is calculated dividing the spending on equipment and buildings among the book value of the physical assets.
The scope of the range of indicators used to show the port inputs and outputs reflects the fact that there is no agreement for determining the range of relevant variables, that these differ according to the activity under study in each case and that the availability of data also conditions the choice of variables.
4.5. Other variables
In contrast to the former, access to the latter is done through long canals, which have higher dredging needs. Clearly, both types of ports face unequal environments, since access to both differs significantly. Thus, if efficiency is evaluated without including this geographical characteristic, ports that have been considered efficient may be considered so because they benefit from favourable environments, while those considered inefficient may suffer the negative consequences of these unfavourable conditions. In these circumstances, Lovell (2001) recommends incorporating the characteristics of the operating environments into the analysis.
Several attributes can be considered to represent the heterogeneous characteristic of the port sector. Such variables are used as approximations to institutional factors or to market characteristics. Some studies incorporate these factors. Liu (1995) employs four variables: property (private, trust and municipal ports); size (large, medium or small); location (east and south coasts and the other coasts); and the intensity of capital (ratio between the net value of fixed capital and the total value of salary payments). Coto-Millán et al. (2000) use a binary variable, which attempts to capture the influence of the type of organization (autonomous ports and the other ports), and the size of the port, reflected in the length of the dock with a draught exceeding four metres. In both studies, these variables have been used to measure the intensity with which the factors mentioned affect efficiency, through a second regression of the efficiency indexes obtained in the first stage on the factors that influence efficiency.
Even though it is intuitively quite attractive, the idea of using these variables to explain efficiency in a second stage has been widely criticised (Kumbhakar et al., 1991; Reifschneider and Stevenson, 1991; Battese and Coelli, 1995) since some of the assumptions established in the first stage are breached in the second. One solution consists of specifications in which the effects of inefficiency are defined as a function of the specific factors of firms that are considered to affect efficiency, carrying out an estimate in a single stage. Following the proposal of Battese and Coelli (1995), Tongzon and Heng (2005) explain the efficiency differences among terminals using two variables: the size of the port (dummy variable to distinguish whether the total annual throughput of the port exceeds one million TEUs or not); and the extent of private sector participation in the port (derived from the port function matrix developed by Baird, 1995 and 1997).
4. Efficiency and productivity in the port sector: objectives and results
4.1. Objectives
The goal of studies that analyze port efficiency is varied and ranges from establishing a relation between efficiency and type of ownership and port management to generating rankings of ports to make comparisons, and evaluating the impact of port reform processes on efficiency.
Cullinane et al. (2002) analyze the administration and property structure of the terminals of the main container ports of Asia. Liu (1995) centres his interest on the relationship between type of ownership and efficiency in British ports. Tongzon and Heng (2005) investigate if port privatization improves the competitive position of ports. For this, they measure the efficiency of international port terminals and identify the relationship between the efficiency measured and the property structure of the terminals. Including container terminals of South Korean and U.K. ports in the sample, which are representative of various degrees of private property, Cullinane and Song (2003) also analyze the relationship between property structure and efficiency. This objective is shared by Cullinane et al. (2005a), albeit with an international sample of port terminals.
The objective of Notteboom et al. (2000) is to analyse the technical efficiency of the main European container terminals, compared to the four largest Asian terminals. With the results obtained, they investigate the effects of some factors that can affect the efficiency of the operations (large-small terminals; hub-feeder ports; private-public; Northern Europe-Southern Europe).
Evaluating the impact of changes in port regulation is a common objective of various studies. The objective of Estache et al. (2002) is to show the utility of efficiency measures in promoting a yardstick competition system. Using the same sample, Estache et al. (2004) seek to identify the sources of the productivity gains, decomposing the change of TFP into its main components.
Barros (2003) compares the efficiency achieved by some Portuguese ports to indirectly infer the role of the incentives introduced by the Portuguese regulation. Barros and Athanassiou (2004) create a ranking of Portuguese and Greek port authorities, in order to detect the ports capable of offering performance improvements within the framework of the objectives of European port policy.
Martín (2002) evaluates the effects that the reforms of the Spanish port system have had on productivity, separating technical progress from efficiency improvements. Díaz also seeks to estimate and decompose productivity (2003). He attempts to value the impact of the organizational reform of the stevedoring sector (handling of merchandise) in Spain between 1990 and 1998.
In addition to analysing the impact that certain factors (inland/continental nature of the ports or the presence of refineries in them) have on the environments in which the main Spanish port authorities in container traffic operate, González (2004), studies if the port reform process of the 1990s improved their efficiency in the 1990-2002 period.
economic efficiency indexes. Using the same port authorities, Baños-Pino et al. (1999) attempt to discover if there are difficulties in adjusting capital in the short-term. Martínez-Budría et al. (1999) and Bonilla et al. (2002) share the same objective: analysing the relative efficiency of Spanish port authorities. Rodríguez-Álvarez et al. (2007) study the merchandise handling sector and evaluate both the technical and the allocative efficiency of the three main container terminals of the port of Las Palmas (Spain).
The objective of Tongzon (2001) is to establish an international comparison of efficiency. Cullinane et al. (2005b) also use an international sample that considers 57 port terminals (2005b) to compare the results obtained using different linear programming techniques; while Cullinane et al. (2006), make a comparison between DEA and stochastic production frontiers. In a European context, Wang and Cullinane (2006) focus on measuring the efficiency of container terminals and the implications for supply chain management. Cullinane et al. (2004) carry out a dynamic analysis of the efficiency of container terminals.
Lastly, Roll and Hayuth (1993) apply a DEA to simulated data with the goal of demonstrating how optimal this method is for measuring port efficiency, and the utility of the efficiency indexes for proposing efficiency improvement methods and for controlling the activity of the operators. The objective of Park and De (2004) is to establish a new alternative approach for measuring the performance and efficiency of ports that can be used as a more powerful tool by port authorities for assessing the comparative performance of their ports. To overcome the limitations of basic DEA models, they present a four-stage DEA (productivity, profitability, marketability and overall efficiency).
4.2. Results
Prior to comparing the results arising from the research, it should be noted that efficiency is a relative concept: the efficiency of a firm is measured in relation to the frontier that, in turn, is defined by the group of firms. This means that any change in the group of firms analysed, such as the inclusion or exclusion of a port, will make the efficiency indexes calculated change. For example, a firm that is highly efficient in a national context, could be less so in an international comparison. Thus, the efficiency evaluations obtained in the various studies are not comparable among each other, since they analyze different countries or, in the case of ports of the same country, the port activity considered or the time period do not match. Nevertheless, they are summarised in the last column of Tables 2 and 3, since they can be used as references and bases for future research.
In general terms, it may be said that the performance of port terminals and authorities has improved over time, since most studies find evidence of improvements in efficiency, productivity or the introduction of technological progress. Another general finding is that the activities that are most analysed are the provision of infrastructure services, developed by the port authorities, and the loading and offloading operations, carried out by terminal ports.
4.2.1. Efficiency and type of ownership
The discussion surrounding the greater efficiency of private entities over public ones has reached the port sector where, like in other economic sectors, the results are not conclusive.
After analysing the property structure of the main container terminals in Asia, Cullinane et al. (2002) find evidence that the transfer of property from the public to the private sector improves the economic efficiency of terminals, which justifies certain programs undertaken in Asian ports to capture private investments. Tongzon and Heng (2005) investigate if port privatization improves the competitive position of ports and also show a positive relation between technical efficiency and privatization in this sector, and find that the best property structure for container terminals is mixed organizations (public/private) and purely private. This finding suggests that a port authority should only have regulatory functions and favours the introduction of private investment in port operations. Cullinane et al. (2006) show that, with the exception of Singapore, the ports with the greatest levels of private participation are the most efficient. Through a cross-section data model, Cullinane and Song (2003) show that the greater the degree of private property, the greater the degree of efficiency, with only one exception. They also observe an increase in the efficiency of the terminals in South Korea after the introduction of competition in the sector. Nevertheless, the classification of the terminals changes when a panel data model is applied. In any case, these results should be interpreted with caution, since the sample only considers five terminals. On the contrary, Cullinane et al. (2005a) find no evidence for upholding a relationship between privatization and efficiency, which is consistent with the findings of Cullinane and Song (2002). Notteboom et al. (2000) also do not find a clear relationship between property structure and the efficiency of terminals when they compare European and Asian terminals.
Liu (1995), in an analysis of British ports where there are several types of property structure, does not find compelling evidence supporting one type of ownership structure in ports, considered globally. Tongzon (2001) confirms that the type of port is not a determinant factor in the degree of port efficiency.
4.2.2. Efficiency and port size
It is often suggested in port literature that the largest ports must have the highest levels of efficiency, due to the learning effect offered by the greater activity levels. On the other hand, to provide to future demand growth, ports are obligated to invest large amounts in infrastructure and equipment, which leads to ports having excess capacity at the moment of making the investment and, therefore, difficulty in achieving high levels of efficiency from the point of view of efficiencies of scale. Meanwhile, some large ports are at the physical limit of their growth, which makes it difficult for them to increase their efficiency, while smaller ports may find it easier to grow and reach optimum scales. The consideration of all these factors makes it difficult to find an only relation between efficiency and port size. Thus, there are no clear conclusions regarding the effects of port size on efficiency, for both container terminals and port authorities.
size and which they share with Cullinane et al. (2006), is that the mean efficiency level of terminals in hub ports is greater than in feeder ports, albeit with higher levels of dispersion within each group. The explanation for this may be found in the higher levels of competitive pressure faced by hub ports.
In Coto-Millán et al. (2000), the smaller port authorities have the highest indexes of economic efficiency and the opposite is the case with the largest ports. However, in a second stage, after analysing several factors that could influence the degree of economic efficiency, the authors conclude that size is not significant. To obtain conclusive results, Martínez-Budría et al. (1999) divide Spanish port authorities into three homogenous groups (large, medium and small), using a criteria of complexity that considers port size and the composition of the output vector. The results indicate that larger ports are not only the most efficient but also have the greatest improvements in efficiency. Smaller ports are second placed, with a considerable decrease in efficiency and, lastly, medium ports have the lowest growth in efficiency. These results contradict the findings of Bonilla et al. (2002) and González (2004). These authors find that the most efficient port authorities include both large and small ones and the same occurs with the least efficient. However, it should be noted that both the time periods and the methodologies used differ among these studies.
Liu (1995) finds that the impact of size is small. Tongzon (2001) has similar findings, and concludes that size is not a determinant factor of port efficiency (there are as many hub ports as feederports among the most efficient ports).
The existence of large port infrastructure seems to suggest the presence of economies of scale in ports; however, this does not seem to have empirical backing. Cullinane et al. (2006) believe that large ports have made major investments which have allowed them to grow, but once a certain limit is reached, they find it difficult to keep growing; therefore, many of these ports operate at the capacity level for which they were designed. Meanwhile, small ports have less physical restrictions for expansion and frequently have new ports or terminals installed which are just starting to evolve. In these cases, the ports operate below their capacity, and as such can benefit from increasing returns to scale.
Cullinane et al. (2004) suggest that most ports have constant returns to scale, which indicates that the scale of production is not the main source of inefficiency. On the contrary, using scale elasticity estimates, Liu (1995) concludes that British ports have decreasing returns to scale in the sample mean. Cullinane et al. (2006) reach similar conclusions, finding that 60% of the ports studied have decreasing returns.
to scale. Lastly, Wang and Cullinane (2006) find evidence of economies of scale in container terminals and conclude that the scale of production influences the level of efficiency.
4.2.3. Efficiency and port reform
Another aspect that has generated interest is determining if port reforms lead to efficiency improvements. After obtaining an average annual growth rate of the efficiency of Mexican ports of 5-6%, Estache et al. (2002) conclude that the Mexican port reform of the early 1990s produced positive effects in practically all the port authorities. Therefore, they suggest that reforms that promote autonomy in port management can produce significant improvements in the sector. They also highlight the need to improve the data gathering and publication systems, in order for them to be useful tools in the evaluation of port efficiency. Estache et al. (2004) use a non-parametric approach and also conclude that reforms are an incentive to the operator to increase efficiency and productivity and introduce technological progress.
Martín (2002) shows that, after the port reform of the 1990s, Spanish port authorities made significant progress in productivity, essentially based on technical progress, and improvements in technical efficiency, which occurs in a particularly relevant manner after 1997. The results obtained by González (2004) confirm that the Spanish port reform produced improvements in the productivity of the port authorities via technical progress.
In an analysis of the stevedoring sector in Spain, Díaz (2003) finds productivity gains essentially led by technological improvements and, to a lesser extent, by benefiting from economies of scale. In this sector, allocative efficiency is higher than technical efficiency.
Barros (2003) concludes that the reforms made by the Portuguese port authorities have placed those ports beyond the efficiency frontier. The port of Aveiro is an exception to the above result, and Barros proposes that the maritime authority establish inspection mechanisms that provide more explicit incentives for improving efficiency. However, as the author recognises the results should be taken with caution given the limited size of the sample and the heterogeneity of the ports included. Barros and Athanassiou (2004) also recognise the same problem in their study, and as such their conclusions are also limited.
Lastly, Cullinane et al. (2002) claim that the level of deregulation has a positive influence on port efficiency.
4.2.4. Efficiency and other issues
This section looks at the relationship that some variables have on efficiency in the port sector. Meanwhile, the effects of such factors on the conditions affecting port activity, on the technological, structural or economic characteristics are presented. Lastly, some aspects of the methodology applied that were not previously discussed are analysed.
The following conclusions can be drawn from the studies that, in a second stage, explain the relationship between efficiency and the factors that determine it. Liu (1995) concludes that the intensity of capital has little effect on efficiency and that the ports situated in the west coast were less efficient than the rest. For Coto-Millán et al. (2000) the type of port organization is a relevant variable that leads autonomous ports to be less efficient than the rest.