Interferometric method for determining the sum of the flexoelectric coefficients (e1 + e3) in an ionic nematic material.
C.L. Trabi and C.V. Brown*
School of Science and Technology, Nottingham Trent University, Clifton Lane, Nottingham NG11 8NS, UK
A.A.T. Smith and N.J. Mottram
Department of Mathematics, University of Strathclyde, Glasgow G1 1XH, Scotland, UK
Abstract
The time dependent periodic distortion profile in a nematic liquid crystal phase grating has been measured from the displacement of tilt fringes in a Mach-Zehnder interferometer. A 0.2 Hz squarewave voltage was applied to alternate stripe electrodes in an interdigitated electrode geometry. The time-dependent distortion profile is asymmetric with respect to the polarity of the applied voltage and decays with time during each half period due to ionic shielding. This asymmetry in the response allows the determination of the sum of the flexoelectric coefficients (e1 + e3) using nematic continuum theory since the device
geometry does not possess inherent asymmetry.
This is the accepted copy of the paper that was subsequently published as:
“Interferometric method for determining the sum of the flexoelectric coefficients (e1 + e3) in an ionic nematic material”
In an undistorted nematic liquid crystal composed of molecules with permanent dipoles the molecules are as likely to align parallel to the average molecular orientation, the n -director, as they are to align anti-parallel to the n-director and so there is no net bulk polarisation. For a material whose molecules possess a shape asymmetry as well as a permanent dipole it was proposed by Meyer [1, 2] that a distortion would lead to the appearance of a flexoelectric polarisation, Pf. The magnitude of this polarisation is related
to gradients in the n-director by the flexoelectric coefficients e1 and e3, which relate to
splay and bend distortions respectively, via : Pf =e1
(
∇⋅n)
n+e3(
∇×n)
×n.The first measurements of the sum of the coefficients (e1 + e3) were carried out by Prost
and Pershan [3] on a homeotropically aligned nematic phase grating. In-plane fields were applied via an interdigitated electrode geometry in which voltages of alternating polarity were applied to alternate electrodes. The spatial period of the flexoelectric distortion in this geometry is twice the spatial period of the dielectric distortion and so optical diffraction was used to distinguish between the two. A number of groups have also subsequently used the hybrid aligned geometry (HAN) to determine the value of (e1 + e3)
[4-8]. In the HAN cell one surface imparts homoetropic alignment to the nematic liquid crystal, and the other planar alignment. The in-built distortion gives rise to a flexoelectric polarisation and an asymmetric response to the polarity of an applied field. Complications for HAN cell measurements include the presence of ionic contamination and the influence of the surface polarisation at the homeotropic surface [8, 9-11]. A recent development of the HAN cell technique uses the pi-cell geometry to avoid the latter effect [12].
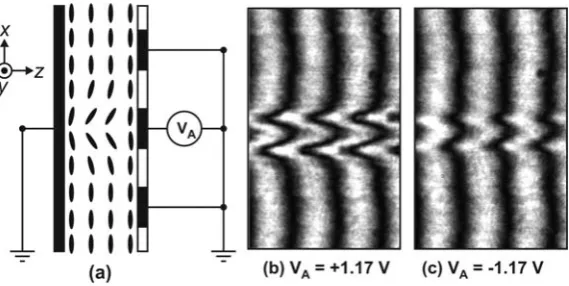
The device geometry used for the current study is shown in figure 1(a). The nematic liquid crystal layer is confined in the x-y plane by two glass substrates coated with indium tin oxide and a polymer alignment layer. The electrode on one plate is a continuous earth plane, and on the right hand plate it has been etched to form a striped periodic interdigitated structure. The electrode widths were 37 μm and the electrode gaps were 43 μm. The polymer layer is unidirectionally rubbed in the x direction in opposite senses on the two plates giving antiparallel planar alignment. The device was filled with the commercial liquid crystal material E7 which, due to the large dipole moments of some of its constituent molecules, is known to be susceptible to ionic contamination [13,14].
Distortions in the nematic layer have been studied by mounting the device in a Mach-Zehnder interferometer [15,16]. The movement of tilt fringes was observed with a voltage applied to alternate electrodes whilst the electrodes between them were maintained at earth potential. The interferometer was illuminated with He-Ne laser radiation at a wavelength of 632.8 nm that was polarised in the x direction. Figure 1(b) shows the fringe pattern 0.25 seconds after applying a voltage of +1.17 V to the centre electrode, and figure 1(c) shows the fringe pattern 0.25 seconds after applying a negative voltage of −1.17 V to the same electrode. Movement of the fringes occurs when a change in the refractive index of the layer is caused by the reorientation of the nematic liquid crystal in the x-z plane. The fringe movement at a particular value of x is given by averaging the value of the refractive index through the nematic layer in the z-direction for the x-polarised light.
coupling between the fringing electric fields and the flexoelectric polarisation. This is discussed in more detail below, but an intuitive explanation for this asymmetry can be given as follows. The magnitude of the flexoelectric polarisation depends linearly on gradients in the n-director and so it has a polarity. The torque on the n-director due to the electric field coupling to the polarisation therefore acts in a direction that depends on the direction of the local electric field. For example, for positive applied voltage and a positive value of (e1 + e3) this torques acts to increases the reorientation of the n-director and
increase the distortion that gives rise to the flexoelectric polarisation.
Figure 2 shows a contour plot of the interferometric measurements of the fringe movement where the white fill corresponds to fringe movement of 0.0 − 0.1 of a fringe width, the black fill to a movement of 0.6 − 0.7 of a fringe width, and the key to the shading for other areas is shown in the legend. The ordinate shows the distance in the x-direction relative to the mid-point of the centre electrode in figure 1(a) and the abscissae shows the time. A positive voltage of +1.17 Volts is applied to the centre electrode during the time periods 0.0 − 2.5 sec and 5.0 − 7.5 sec, and a negative voltage of −1.17 V from 2.5 − 5.0 sec and 7.5 − 10.0 sec. This data was obtained by capturing images at a frame rate of 30 per second of the tilt fringes whilst a squarewave voltage of frequency 0.2 Hz and amplitude 1.17 V was applied to the centre electrode in figure 1(a). Image processing software was used to threshold the images and then take the average fringe movement for five fringes across a width of 90 μm of the device at each timestep. When the voltage changes polarity the fringe movement, and therefore the distortion in the nematic layer, builds up to a maximum and this is followed by a slower decay of the fringe movement until the fringes are parallel. This decay is attributed to the migration of mobile ionic species in the nematic material which sets up an ionic field that opposes and shields the applied d.c. voltage [17].
Figure 3 shows data for the fringe movement that have been extracted from the images taken on the interferometer corresponding to figures 1(b) and 1(c). The filled squares show data for +1.17 V, and the filled diamonds for −1.17 Volts where both data sets were taken 0.25 seconds after a change in the polarity of the applied voltage. In figure 4(a) the fringe movement at the position x = 15 μm is shown as a function of time by the filled circles. The corresponding applied voltage waveform is shown by the dashed line in figure 4(b).
The solid lines in figure 3(a) and figure 4(a) show fits to the x-position and the time resolved data using dynamic continuum theory with a single viscosity γ1, associated with the rotation of the n-director [18] [19]. The calculations were performed using a commercial PDE solver package [20] with the following parameters: splay elastic constant
= 10.5 × 10⁻¹² N; bend elastic constant = 15.2 × 10⁻¹²N; viscosity
1
K K3 γ1 = 0.18 N s m
-2
; surface pretilt 0.4°; permittivity parallel and perpendicular to the n-director = 19.1
and = 5.2 respectively; refractive index parallel and perpendicular to the n-director = 1.735 and = 1.518 respectively; and the cell thickness 17.2 μm. The relative movement of a tilt fringe formed by He-Ne laser light at 633.2 nm is calculated from the theoretical n-director profile θ(x, z, t) by summing the x-component of the refractive index through the thickness of the layer in the z-direction to calculate the optical path length at each value of the coordinate x.
|| ε
⊥ ε
||
n n⊥
measurements. After a change in voltage polarity, a capacitance response was observed in the planar geometry that showed a very similar decay profile to the decay of the optical response for the phase grating device shown figure 4(a). It was found that this decay could be modelled for the planar alignment geometry using a numerical simulation in which nematic continuum theory in 1-dimension and the non-equilibrium charge transport equations in 1-dimension were solved self consistently [17] [22]. At high densities of singly charged species, above 1021 m-3 of positive and negative charges, ionic migration and shielding gave an effective electric field in the centre of the layer that was enhanced after a change in voltage polarity and then decayed exponentially.
Motivated by this result, in the phase grating device an exponentially decaying voltage waveform was used in the model for theoretical n-director profile θ(x, z, t) in order to account for the presence and dynamic shielding of mobile ionic species. This voltage waveform is shown in figure 4(b) by the solid line. The amplitude of this voltage, which simulates the magnitude of the reverse ion field, and the exponential decay time constant, which simulates ionic migration, were treated as fitting parameters. With these parameters set at 1.89 V and 0.80 sec respectively the value that is obtained for the sum of the flexoelectric coefficients was (e1 + e3) = (1.4 ± 0.1) × 10-11 C m-1. This value compares
very well with the value (1.5 ± 0.2) × 10-11 C m-1 found for the same material in reference [11], but is somewhat lower than the value of (4.5 ± 2.2) × 10-11 C m-1 from reference [12]. The estimate of the random error in the current experiment is consistent with results from repeating the measurement in the parallel alignment geometry. There will also be systematic errors, for example ion-director-polarisation coupling will occur in the bulk of the device and detailed 2d modelling would be required to quantify this effect.
The major factor that determines the value of (e1 + e3) that is obtained from the fit to the
data is the asymmetry in the optical response to the positive and negative applied voltages. In the current geometry, with the value of the voltage that is experienced by the liquid crystal material treated as a fitting parameter, there is no inherent degeneracy in the fitting process. Even using static continuum theory to fit the fringe movement profiles for positive and negative applied voltages at the same time after a polarity reversal gives values for (e1 + e3) that lie in the range stated above. This demonstrates that, remarkably,
References
[1] R.B. Meyer, Phys. Rev. Lett. 22, 918 (1969)
[2] P.G. DeGennes and J. Prost, “The Physics of Liquid Crystals”, 2nd Edition, Oxford Science Publications (1995)
[3] J. Prost and P.S. Pershan, J. Appl. Phys.47, 2298 (1976)
[4] N.V. Madhusudana and G. Durand, J. Phys – Lettres46, L195 (1985)
[5] B. Valenti, C. Bertoni, G. Barbero, P. Taverna-Valabrega, R. Bartolino, Mol. Cryst. Liq. Cryst.146, 307 (1987)
[6] L.M. Blinov, G. Durand, and S.V. Yablonsky, J. Phys. II France2, 1287 (1992) [7] S.R. Warrier and N.V. Madhusudana, J. Phys. II France7, 1789 (1997)
[8] A. Mazzulla, F. Ciuchi and J.R. Sambles, Phys Rev E.64, 21708 (2001) [9] S. Ponti, P. Ziherl, C. Ferrero and S. Žumer, Liquid Crystals8, 1171 (1999)
[10] T. Takahashi, S. Hashidate, N. Nishijou, M. Usui, M. Kimura and T. Akahane, Jap. Jour. Appl. Phys.37, 1865 (1998)
[11] S. Jewell and J.R. Sambles, J. Appl. Phys.92, 19 (2002)
[12] C. Kischka, L.A. Parry-Jones, S.J. Elston, and E.P Raynes, Mol. Cryst. Liq. Cryst. 480, 103 (2008)
[13] E7 room temperature nematic liquid crystal, Liquid Crystals Division, Merck KGaA, 64271 Darmstadt, Germany.
[14] G. H. Heilmeier, L. A. Zanoni, and L. A. Barton, Appl. Phys. Lett.13, 46 (1968) [15] M. Born and E. Wolf, “Principles of Optics”, Oxford: Pergamon (1980)
[16] E. Martin-Badosa, A. Carnicer, I. Juvells and S. Vallmitjana, Meas. Sci. Tech.8, 764 (1997)
[17] M. Scalerandi, P. Pagliusi, G. Cipparrone and G. Barbero, Phys, Rev. E.69, 051708 (2004)
[18] J.L. Eriksen, Trans. Soc. Rheol.5, 23 (1961)
[19] F.M. Leslie, Continuum Mech. Thermodyn.4, 167 (1992)
[20] COMSOL Multiphysics, COMSOL Ltd, UH Innovation Centre, College Lane, Hatfield, Hertfordshire AL10 9AB, U.K.
Figure captions
Figure 1 (a) Schematic diagram of a section through the nematic liquid crystal phase grating device showing 1.5 periods of the interdigitated striped electrode structure. The movement of tilt fringes in the x-y plane is shown in figures (b) and (c) resulting from the distortion caused by positive or negative voltages respectively applied to the centre striped electrode in (a).
Figure 2 Contour plot of the relative fringe movement with time (from 0 to 0.7 of one fringe spacing) as a function of distance in the x-direction across the phase grating device from figure 1(a). From 0.0 − 2.5 sec and 5.0 − 7.5 sec +1.17 Volts is applied to the centre electrode, and from 2.5 − 5.0 sec and 7.5 − 10.0 sec the applied voltage is −1.17 V.
Figure 3 The relative fringe movement is shown as a function of distance in the x -direction across the phase grating device from figure 1(a), corresponding to vertical sections through figure 2 at time 0.25 sec (+1.17 V, squares) and time 2.75 sec (−1.17 V, diamonds). The solid lines are theoretical fits to the data.
-75 -50 -25 0 25 50 75
Distance (10
-6metres)
0.0 0.2 0.4 0.6