Dynamic Response Studies of Aggregation and Breakage
Dynamics in Colloidal Dispersions in Stirred Tanks
M. Soos1, A. S. Moussa1, L. Ehrl1, J. Sefcik2, H. Wu1, M. Morbidelli1 1
Institute for Chemical and Bioengineering, Department of Chemistry and applied Bioscience, ETH Zurich, 8093 Zurich, Switzerland
2 Department of Chemical and Process Engineering, University of Strathclyde
James Weir Building, 75 Montrose Street, Glasgow G1 1XJ, Scotland, UK
Abstract
Aggregation and breakage of aggregates of fully destabilized polystyrene latex particles in turbulent flow was studied experimentally in both batch and continuous stirred tanks using small angle static light scattering (SASLS). It was found that the steady state values of the mean radius of gyration are fully reversible upon changes of stirring speed as well as solid volume fraction in the tank. Steady state values of the mean radius of gyration were decreasing with decreasing solid volume fraction as well as with increasing stirring speed. Moreover, it was found that the structure and shape of the aggregates is not influenced by the applied stirring speed.
1 INTRODUCTION
Aggregation processes have been traditionally used for separating finely dispersed solids from liquids, for example, in the production of powders from polymer latexes prepared by emulsion polymerization or in the removal of suspended particles in wastewater treatment. Additionally, properly controlled aggregation and breakage processes can also be used to produce particulates with desired size distribution and morphology at nano and/or microscale.
Small angle static light scattering was used to monitor the time evolution of the mean radius for the cluster distribution.
2 EXPERIMENTAL METHOD
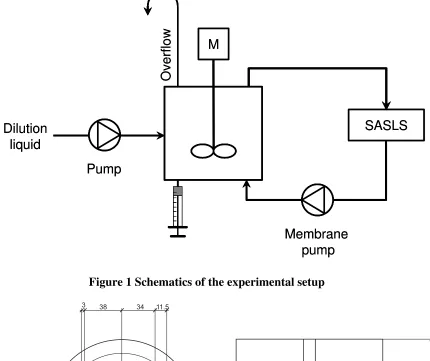
In all experiments we used white sulfate polystyrene latex supplied by Interfacial Dynamics Corporation (IDC), Portland, OR (USA) (Product-No: 1-800, CV: 2%, Batch-No: 642,4, solid% = 8.1). The mean diameter of latex particles was 810 nm as measured by small angle light scattering in agreement with the particle size declared by the producer. The particle size distribution was very narrow and can be well approximated as monodisperse. All experiments were performed in a 2.5 L stirred tank coagulator, shown schematically in Figure 1, operated in broad range of stirring speeds (200 - 1073 rpm). More details about the geometry of the coagulation unit can be found in Figure 2.
The initial suspensions with solid volume fractions φ0 in the range from 1×10⁻⁵ to 4×10 -5
were obtained by diluting the original latex with appropriate amount of de-ionized water which was afterwards pumped from the storage tank into the coagulator. The coagulator was filled with care not to introduce air bubbles. An overflow tube was used as a small reservoir of about 100 mL in order to allow replenishing of liquid in the coagulator during sampling and to prevent air from entering the coagulator (see Figure 1). The initial suspension was stirred for approximately 15 minutes at 1000 rpm to ensure its stability and break any loose aggregates that might be present. Subsequently, the required stirring speed was set.
The aggregation process was started by introducing the required amount of a coagulant solution (30 mL of 20% w/w Al(NO3)3 in water) to the coagulator using a syringe (see Figure 1). The resulting salt concentration was well above the critical coagulation concentration (CCC) for the given system, i.e., the electrostatic repulsive forces between primary particles were fully screened and the particles were completely destabilized. In order to achieve a good reproducibility of the initial aggregation kinetics, the salt injection was carried out with a Lambda Vit-Fit programmable syringe pump applying the maximum speed, corresponding to the injection time of approximately 15 seconds. A typical mixing time of the injected salt solution was about 5 seconds at 200 rpm (tested by dye measurements), which is an order of magnitude below the characteristic time of aggregation at all conditions considered in this work. More details about evaluation of the characteristic times can be found in (10).
M
SASLS
Membrane pump
Overflo
w
Dilution liquid
Pump
M
SASLS
Membrane pump
Overflo
w
Dilution liquid
[image:3.595.91.521.82.443.2]Pump
Figure 1 Schematics of the experimental setup
15 12
30 60
34 11.5 38
3
150 49
12
45
Inlet/Outlet Sample
port
2
100
2
48
10
66
65
12 15
[image:3.595.91.555.399.630.2]60 150
Figure 2 Diagram of the coagulator with specified dimensions (in mm)
The cluster mass distribution (CMD) in our experimental system was characterized using small angle static light scattering, where the intensity of the scattered light I as a function of the scattering wave vector amplitude q was measured. The scattered light intensity can be expressed as(12)
I(q)=I(0)P(q)S(q) (1)
where I(0) is the zero angle intensity, P(q) is the form factor (due to primary particles),
( )
4 sin 2
n
q π θ
λ
= (2)
where θ is the scattering angle, n the refractive index of the dispersing fluid and λ the laser wavelength in vacuum.
Analysis of the measured scattered intensity I(q) in the Guinier region (qRg < 1) allows one to extract certain moments of the CMD, namely the root mean square radius of gyration, Rg and the zero angle intensity I(0) (corresponding to the mass weighted
average mass) from the slope and the intercept of the linear relationship between
( ) ( )
(
)
ln I q /P q and q2 3 defined as:
(
)
2 2( ) ( )
ln ln (0)
( ) 3 g S q
I q q
I R
P q
⎛ ⎞
= −
⎜ ⎟
⎝ ⎠ (3)
Moreover, if all aggregates exhibit a fractal scaling and they are in the limit of the Raylegh-Debye-Gans (RDG) theory, rigorously valid within the following constraints
1 1
m− ≤ and
(
4πRp λ)
m− ≤1 1, where m is relative refractive index (m = 1.195 for polystyrene), Rp is the radius of primary particle and λ is the laser light wavelength.,where each primary particle in the aggregate scatters light independently from all the others, one can also estimate the fractal dimension of the aggregates df from the slope of
the power law region of the log-log plot of S(q) vs. q. However, since the diameter of primary particles used here is comparable to the wavelength of the incident light used in light scattering experiments, we are well outside the region of validity of the RDG theory. Therefore we will denote the slope of log-log plot S(q) vs. q as the scaling exponent (SE), which is not necessarily equal to the fractal dimension df. Therefore, the
structure of aggregates was independently obtained from image analysis of 2D microscopy pictures of aggregates, using inverted microscope (Zeiss Axiovert 100), originating from the samples withdrawn for off-line measurement taken at various operating conditions. In this way the structure of aggregates can be characterized by the perimeter fractal dimension Dpf, obtained from the scaling of the projected surface area
(A) vs. the perimeter (P) of the binary image of an aggregate (13-16), 2Dpf
A∝P (4)
Since Dpf depicts the surface morphology of the aggregate in two dimensional
perspective, its value varies between 1 (corresponding to a linear aggregate) and 2 (corresponding to a Euclidean aggregate). As was observed by several authors (15, 17, 18) typical values of Dpf at steady state for aggregates produced under turbulent
conditions are in the range from 1.1 to 1.4. Consequently, the value of df can be
estimated using a correlation between perimeter fractal dimension and three dimensional fractal dimension presented by Lee and Kramer (19). Other information which can be extracted from the analysis of the aggregate images is their shape. In this case the ratio between the major and minor axis of the best fitted ellipse was used. All above mentioned quantities were obtained using the image analysis software ImageJ v1.34s (http://rsb.info.nih.gov/ij/).
3 RESULTS AND DISCUSSION
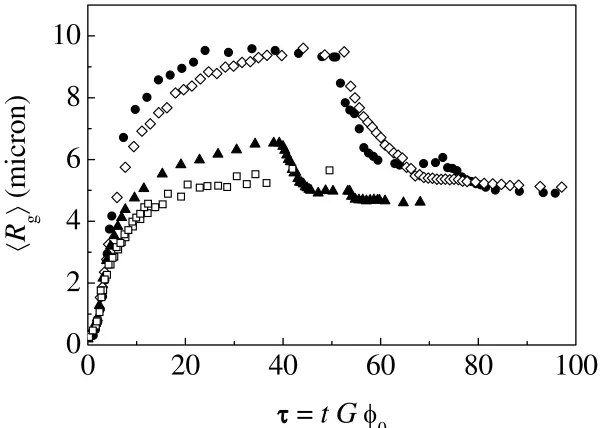
Result of the experiments from batch as well as continuous flow conditions, where the solid volume fraction was reduced applying continuous dilution (10) is presented in Figure 3 for solid volume fraction in the range from 4.5×10⁻⁶ to 4×10⁻⁵ and stirring speed equal to 635 rpm. The obtained results are shown in the form of mean radius of gyration as a function of the dimensionless time for shear aggregation τ = t〈G〉φ0. Appropriate values of the volume averaged shear rate were evaluated from the simulation of the flow field using a commercial computational fluid dynamics (CFD) software Fluent using a standard k-ε model (9).
As one can see at the beginning of the process (dimensionless time smaller then two), the time evolution of both moments for all values of solid volume fraction plotted in dimensionless time τ reduces to a single curve, which indicates that the growth of aggregates in these systems is solely controlled by shear aggregation. As the aggregates grow further and their distribution approaches a steady state, the different experimental curves deviate from each other, thus indicating that the evolution of the measured moments of the CMD depends on the solid volume fraction. In the same figure we can see that steady state values of both moments increase with the solid volume fraction. The same trend, in terms of one single moment of the distribution, has been reported by Oles (1), Kusters et al. (2) and Kobayashi et al. (20) for primary particles with diameters of 2.17, 0.8 and 1.36 µm, respectively, and for values of φ0 close to those considered in this work. It is worth mentioning that, at least in qualitative terms, these findings are consistent with the different dependency of aggregation and breakage kinetics on cluster concentration: second order for aggregation and first order for breakage, which balance each other at steady state.
0
20
40
60
80
100
0
2
4
6
8
10
τ
= t G
φ
0
〈
R
g〉
(mi
cron
[image:5.595.147.448.423.637.2])
Figure 3 Time evolution of 〈Rg〉 for various values of the initial solid volume fraction for three batch and two dilution experiments; ( ) φ0 = 4×10⁻⁵, dilution
with Qd = 0.31 L/min, interruptions at φ = 2×10⁻⁵ and 1×10⁻⁵; (æ) φ0 = 4×10⁻⁵, dilution with Qd = 0.21 L/min, interruptions at φ = 1×10⁻⁵; (r) φ0 = 2×10⁻⁵ dilution
with Qd = 0.22 L/min, interruption at φ = 1×10⁻⁵ and 5×10⁻⁶; (̊) batch experiment with φ0 = 1×10⁻⁵. Stirring speed 635 rpm.
this way one can collect in a very simple and fast way many cluster mass distributions corresponding to different steady state conditions. For this, the dilution rate has to be selected in a way that macromixing timescale is smaller then those of both aggregation and dilution whereas the aggregation timescale has to be smaller than that of dilution. The first one of these two timescale criteria ensures that the flow pattern and concentration profile in the tank are close to those in an ideal CSTR (21), so that the solid volume fraction is uniform in the tank and can be calculated easily and accurately. The second criterion ensures that dynamic equilibrium condition between aggregation and breakage is achieved at every single instant of time during the dilution experiment. In other words, the dilution rate is slow enough that aggregation and breakage processes can readjust the CMD almost instantaneously with respect to the gradually changing solid volume fraction. It appears that we are indeed in the conditions mentioned above where mixing is much faster than aggregation, and that aggregation/breakage are sufficiently fast compared to dilution. The experimental verification of this conclusion is shown in Figure 3, where we show a dilution experiment (indicated by solid circles), which starts from the steady state conditions corresponding to the solid volume fraction φ0 = 4×10⁻⁵ obtained in batch operation mode. It is seen that the values of both moments decrease steadily during dilution, but as soon as the dilution is interrupted (by turning off the peristaltic pump shown in Figure 1) both moments stop decreasing and remain constant almost immediately. This suggests that the dilution rate is sufficiently slow compared to the rates of aggregation and breakage that dynamic equilibrium is achieved instantaneously with respect to the dilution characteristic time.
0
20
40
60
80
0.3
10
010
1Time (min)
〈
R
g〉
(mi
cro
[image:6.595.153.446.416.634.2]n)
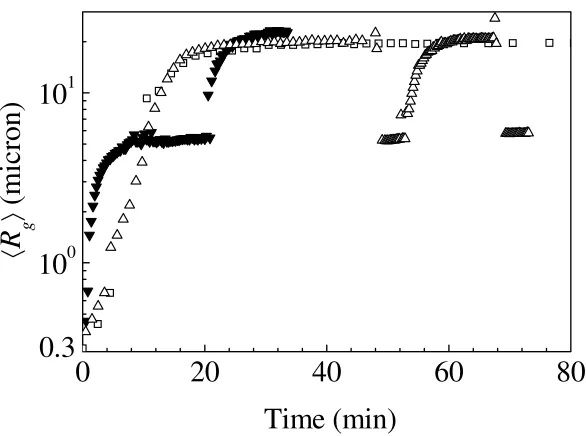
Figure 4 Examples of the time evolution of the radius of gyration 〈Rg〉 during step changes of the stirring speed measured for a solid volume fraction equal to 4×10⁻⁵;
(̊) 200 rpm, (r) 1073 – 200 rpm, (u) 200 – 1073 – 200 – 1073 rpm
fraction or from a dilution experiment starting from a higher initial solid volume fraction and then diluting the dispersion to the desired solid volume fraction. When the dilution experiments were stopped at suitable times as illustrated in Figure 3 three plateaus can be seen corresponding to three pairs of solid volume fraction values which are identical but achieved through different paths. Nevertheless, it is clear that the mean radii of gyration are identical, which indicates that the process is fully reversible.
10
-610
-510
-40
2
4
6
8
10
12
φ
〈
R
g〉
[image:7.595.146.448.191.417.2](micron)
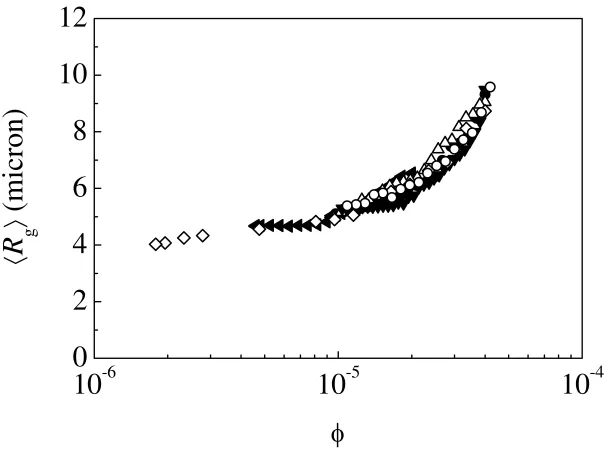
Figure 5 Average values of 〈Rg〉 as a function of the solid volume fraction in the stirred vessel during dilution for starting value of solid volume fraction equal to 4×10⁻⁵ and various dilution rate: ( ) Qd = 0.66 L/min, (æ) Qd = 0.38 L/min, ( ) Qd
= 0.31 L/min with interruption, (s) Qd =0.21 L/min, (t) Qd = 0.14 L/min and starting value of the solid volume fraction φ0 = 2×10⁻⁵ with dilution rate Qd =0.21
L/min (v). Stirring speed equal to 635 rpm.
increase the aggregate strength over time and therefore make them more resistant against shear effect.
Since aggregation and breakage equilibrate each other, we can plot the CMD characteristics as a function of the actual solid volume fraction inside the coagulator calculated using the washout function of an ideal CSTR (21). Due to the reversibility of the process we expect that these values do not depend on the path followed to reach the specific solid volume fraction considered. This is indeed the case as it can be seen in Figure 5 where all data in terms of 〈Rg〉 obtained for different dilution rates as well as for different starting values of the solid volume fraction collapse in a single curve when plotted as a function of the solid volume fraction. Moreover, it was found, that the region of low solid volume fractions the value of the 〈Rg〉 starts to level off and approach certain limiting value, which is dependent only on the applied stirring speed. Since by dilution we favor breakage against aggregation, this leveling off indicates that at “infinite” dilution (applying extrapolation of the measured data to φ = 0) the aggregates reach a certain critical size below which the effect of breakage is negligible, at least within the timescale of the experiments investigated here.
0
10
20
30
0.0
0.5
1.0
1.5
2.0
2.5
3.0
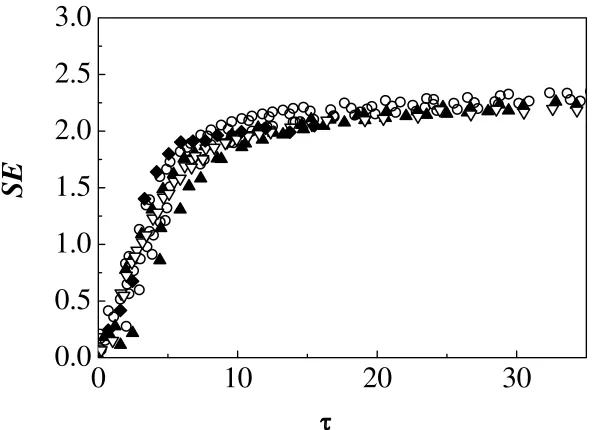
SE
[image:8.595.145.444.332.547.2]τ
Figure 6 Time evolution of the scaling exponent SE for various values of the solid volume fraction and stirring speed 635 rpm; (») φ0 = 4×10⁻⁵, (r) φ0 = 2×10⁻⁵, (u)
φ0 = 1×10⁻⁵, (¼) φ0 = 4.5×10⁻⁶.
In Figure 6 we show the time evolution of the scaling exponent for the same experiments considered in Figure 3. It can be seen that changes in the solid volume fraction do not significantly affect time evolution of the SE. The low values of scaling exponent at the beginning of the process is caused by the presence of a significant fraction of the smaller aggregates, which scatter light differently compared to large clusters with fully developed fractal scattering behavior (9, 26). As the aggregates grow, the effect of these small non-fractal aggregates becomes less important and the value of
SE increases. When CMD reaches steady state (compare with 〈Rg〉 in Figure 3) then also
(Taylor-Couette device and stirred tank respectively), where larger values of SE were found in the case of Taylor-Couette compared to the stirred tank.
a
10
210
310
210
310
410
5Area (pixel
2
)
Perimeter (pixel)
Slope = 1.645
[image:9.595.211.381.111.294.2]b
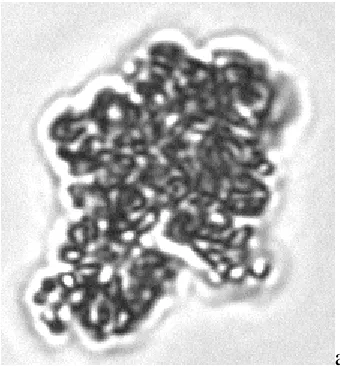
Figure 7 An example of the aggregate image (a) together with obtained scaling of the area vs. perimeter (b) obtained from the image analysis of produced aggregates
at steady state for a solid volume fraction equal to 4×10⁻⁵ and stirring speed equal to 635 rpm
As can be seen from Figure 7 using image analysis of the obtained aggregates presented here in the form of area as a function of perimeter they can be approximated by a power law scaling, where according to Eq. 4 the slope is equal to 2/Dpf. The obtained value of
the perimeter fractal dimension is equal to 1.214 ± 0.025. This value is in agreement with the other values of perimeter fractal dimension measured by other authors (14-18). To relate the value of the perimeter fractal dimension to the mass based fractal dimension we used results of Lee and Kramer (19) where we obtained value of 2.62 ± 0.18, which is in agreement with other values published in the literature (1, 3, 4, 16). Comparing the values of the scaling exponent obtained from S(q) with the fractal dimension recalculated from the correlation between Dpf we see that the scaling
exponent underestimates the approximated value of the fractal dimension obtained from image analysis. These support our previous comments that for such large size of primary particles the structure of aggregates has to be obtained independently.
4 CONCLUSION
In this work we investigated the effect of the solid volume fraction and stirring speed on the aggregation and breakage processes in turbulent flow in a stirred tank coagulator. Aggregation of fully destabilized polystyrene particles in a batch coagulator yielded steady state distributions with the mean cluster size (in terms of the mean radius of gyration measured by small angle static light scattering) monotonically increasing with the solid volume fraction. Using a combination of batch operation and continuous dilution with particle-free solution in the stirred tank, it was found that the steady state distributions were fully reversible upon changing the solid volume fraction and stirring speed. This indicates that the steady state distribution in this system is controlled by the dynamic equilibrium between aggregation and breakage. In addition, using this dilution experiment down to very low solid volume fractions it is possible to obtain a critical aggregate size below which breakage rates become negligible. Moreover, as was shown by the results of the image analysis of the obtained aggregates at steady state the values of scaling exponent could lead to significant under prediction of the real value of the fractal dimension.
5 REFERENCES
1. Oles, V., 1992. "Shear-induced aggregation and breakup of polystyrene latex particles", J. Colloid Interface Sci., 154, 351-358.
2. Kusters, K.A., Wijers, J.G., Thoenes, D., 1997. "Aggregation kinetics of small particles in agitated vessels", Chem. Eng. Sci., 52, 107-121.
3. Spicer, P.T., Pratsinis, S.E., Raper, J.A., Amal, R., Bushell, G., Meesters, G., 1998. "Effect of shear schedule on particle size, density, and structure during flocculation in stirred tanks", Powder Tech., 97, 26-34.
4. Selomulya, C., Bushell, G., Amal, R., Waite, T.D., 2002. "Aggregation mechanisms of latex of different particle sizes in a controlled shear environment", Langmuir, 18, 1974-1984.
5. Bouyer, D., Liné, A., Do-Quang, Z., 2004. "Experimental analysis of floc size distribution under different hydrodynamics in a mixed tank", AIChE J., 50, 2064-2081.
6. Serra, T., Casamitjana, X., 1998. "Effect of the shear and volume fraction on the aggregation and breakup of particles", AIChE J., 44, 1724-1730.
8. Coufort, C., Bouyer, D., Liné, A., 2005. "Flocculation related to local
hydrodynamics in a Taylor-Couette reactor and in a jar", Chem. Eng. Sci., 60, 2179-2192.
9. Waldner, M.H., Sefcik, J., Soos, M., Morbidelli, M., 2005. "Initial growth kinetics of aggregates in turbulent coagulator", Powder Tech., 156, 226-234. 10. Moussa, A., Soos, M., Sefcik, J., Morbidelli, M., 2006. "Effect of the solid
volume fraction on the aggregation and breakage of colloidal suspensions in batch and continuous stirred tank", Langmuir, in press,
11. Biggs, C.A., Lant, P.A., 2000. "Activated sludge flocculation: On-line determination of floc size and the effect of shear", Water Research, 34, 2542-2550.
12. Sorensen, C.M., 2001. "Light scattering by fractal aggregates: A Review",
Aerosol Sci. Technol., 35, 648-687.
13. Mandelbrot, B.B., Passoja, D.E., Paullay, A.J., 1984. "Fractal character of fracture surfaces of metals", Nature, 308, 721-722.
14. Spicer, P.T., Pratsinis, S.E., 1996. "Shear-induced flocculation: The evolution of floc structure and the shape of the size distribution at steady state", Water
Research, 30, 1049-1056.
15. Spicer, P.T., Keller, W., Pratsinis, S.E., 1996. "The effect of impeller type on floc size and structure during shear-induced flocculation", J. Colloid Interface Sci., 184, 112-122.
16. Serra, T., Casamitjana, X., 1998. "Structure of the aggregates during the process of aggregation and breakup under a shear flow", J. Colloid Interface Sci., 206, 505-511.
17. Wang, L., Vigil, R.D., Fox, R.O., 2005. "CFD simulation of shear-induced aggregation and breakage in turbulent Taylor-Couette flow", J. Colloid Interface Sci., 285, 167-178.
18. Soos, M., Wang, L., Fox, R.O., Sefcik, J., Morbidelli, M., 2006. "Aggregation and breakage in turbulent Taylor-Couette flow: Population balance modeling and interpretation of particle imaging data", J. Colloid Interface Sci., submitted, 19. Lee, C., Kramer, T.A., 2004. "Prediction of three-dimensional fractal dimension
using the two-dimensional properties of fractal aggregates", Adv. Colloid Interface Sci., 112, 49-57.
20. Kobayashi, M., Adachi, Y., Ooi, S., 1999. "Breakup of fractal flocs in a turbulent flow", Langmuir, 15, 4351-4356.
21. Froment, G.F., Bischoff, K.B., 1990. Chemical Reactor Analysis and Design. John Wiley & Sons, New York.
22. Kusters, K.A., The influence of turbulence on aggregation of small particles in agitated vessel. 1991, Eidhoven University of Technology, Netherlands: Eidhoven.
23. Bouyer, D., Coufort, C., Liné, A., Do-Quang, Z., 2005. "Experimental analysis of floc size distributions in a 1-L jar under different hydrodynamics and
physicochemical conditions", J. Colloid Interface Sci., 292, 413-428. 24. Clark, M.M., Flora, J.R.V., 1991. "Floc restructuring in varied turbulent
mixing", J. Colloid Interface Sci., 147, 407-421.
25. Francois, R.J., 1987. "Strength of aluminium hydroxide flocs", Water Research,
21, 1023-1030.
26. Lattuada, M., Wu, H., Morbidelli, M., 2003. "A simple model for the structure of fractal aggregates", J. Colloid Interface Sci., 268, 106-120.
28. Blaser, S., The hydrodynamical effect of vorticity and strain on the mechanical stability of flocs. 1998, ETH Zurich: Zurich.
29. Blaser, S., 2000. "Flocs in shear and strain flows", J. Colloid Interface Sci., 225, 273-284.