City, University of London Institutional Repository
Citation
:
Alberdi, E., Povyakalo, A. A., Strigini, L. and Ayton, P. (2004). Effects of incorrect computer-aided detection (CAD) output on human decision-making in mammography.Academic Radiology, 11(8), pp. 909-918. doi: 10.1016/j.acra.2004.05.012
This is the unspecified version of the paper.
This version of the publication may differ from the final published
version.
Permanent repository link:
http://openaccess.city.ac.uk/1589/Link to published version
:
http://dx.doi.org/10.1016/j.acra.2004.05.012Copyright and reuse:
City Research Online aims to make research
outputs of City, University of London available to a wider audience.
Copyright and Moral Rights remain with the author(s) and/or copyright
holders. URLs from City Research Online may be freely distributed and
linked to.
City Research Online: http://openaccess.city.ac.uk/ publications@city.ac.uk
TITLE PAGE
Title:
Effects of incorrect CAD output on human decision making in mammography
Authors:
Eugenio Alberdi, PhD Andrey Povyakalo, PhD Lorenzo Strigini, Prof
Centre for Software Reliability, City University, London, UK
Peter Ayton, Prof
Psychology Department, City University, London, UK
Supporting grant:
The work described in this paper has been partly funded by UK's Engineering and Physical Sciences Research Council (EPSRC) through DIRC (the “Interdisciplinary Research Collaboration on Dependability”, which studies the dependability of computer based systems).
http://www.dirc.org.uk
Corresponding author:
Eugenio Alberdi
Centre for Software Reliability City University
Effects of incorrect CAD output on human decision making in
mammography
Abstract
RATIONALE AND OBJECTIVES
Our goal was to investigate the effects of incorrect computer output on the reliability of the decisions of human users. Our work followed on an independent UK clinical trial that evaluated the impact of CAD in breast screening. Our aim was to use data from this trial to feed into probabilistic models (similar to those used in “reliability engineering”) which would allow us to find and assess possible ways of improving the human-CAD interaction. Some of our analyses required extra data and we conducted two supplementary studies. Study 1 was designed to elucidate the effects of computer failure on human performance. Study 2 was conducted to clarify unexpected findings from Study 1.
MATERIALS AND METHODS
In Study 1, 20 film-readers viewed 60 sets of mammograms (30 of which contained cancer) and provided "recall/no recall" decisions for each case. Computer output for each case was available to the participants. The test set was designed to contain an unusually large proportion (50%) of cancers for which CAD had generated incorrect output.
In Study 2, 19 different readers viewed the same set of cases in similar conditions except that computer output was not available.
RESULTS
The average sensitivity of readers in Study 1 (with CAD) was significantly lower than the average sensitivity of readers in Study 2 (without CAD). The difference was most marked for cancers for which CAD failed to provide correct prompting.
CONCLUSIONS
Possible automation bias effects in CAD use deserve further study as they may degrade human decision making for some categories of cases under certain conditions. This possibility should be taken into account in the assessment and design of CAD tools.
1. INTRODUCTION
The studies reported in this paper were motivated by a “reliability modelling” approach to the study of human-computer interaction in mammography. “Reliability modelling” in engineering is concerned with predicting probabilities of future failures1 (or failure-free behaviour) of man-made systems. It most typically involves building a “model” which gives a mathematical specification of how failures of its components may cause the failure of the system (specifically, which combinations of component failures would lead to system failure) (1). These models bring insight about which components are most critical for the dependability of the whole system, about which component it is best to spend effort to improve, and sometimes allow one to estimate the dependability measures for the whole system, like the probability of the system behaving improperly, from parameters like the known reliability levels of the individual components.
In our current work, we are applying this approach to the situation in which a human uses the output of a computer aid to issue a decision (e.g., a diagnosis, a suggestion for treatment, etc.) (2). We see the human and the automated aid (which we will call “the machine” for brevity) as components of a single system2. The use of computer aids in breast screening is a good example of this sort of “human-machine system”.
To try out our probabilistic modelling approach, we are using data from a clinical trial (3) funded by the HTA (Health Technology Assessment programme in the UK) and run by researchers in University College London, UCL in conjunction with various hospitals and breast screening centres in England. The goal of the clinical trial was to assess the impact of a Computer Aided Detection (CAD) tool, R2 ImageChecker M100 (4), as an aid to breast screening using various categories of film readers. The study was designed to test the hypothesis that CAD increases the sensitivity of less qualified readers without adversely affecting their specificity. The idea was to determine whether less qualified practitioners (especially radiographers) with the aid of CAD could replace a radiologist as a second reader.
A CAD tool is used to alert a human film-reader to areas of a mammogram where computerised analysis suggests that abnormalities may be found. The rationale is to aid clinicians in the detection of mammographic signs that ought to be examined as potential indicators of cancer but may otherwise be missed by humans. These tools are not designed to assist readers in the interpretation or classification of those signs.
In earlier evaluations, R2 ImageChecker has been shown to have a high sensitivity3: around 90% according to (5). However this cameat the expense of a low specificity: the tool placed an average of 2.06 prompts per case. One of the issues investigated in the trial was whether this low specificity may affect negatively the diagnostic performance of the clinicians.
As is common practice in the evaluation of medical products, the HTA trial compared the effectiveness of human film-readers’ behaviour with and without the
1
We will use “failure” to mean any case in which something (a machine or a human or a set of co-operating humans and machines) produces an incorrect output.
2
Henceforth in this paper we will always use the term “system” to refer to the whole system which includes a human and a machine component.
3
CAD tool. In contrast, our approach, influenced by reliability modelling in engineering, focuses on the possibly distinct effects of the individual components (human and computer) of the system under consideration. By highlighting the effects of the individual components on the behaviour of the whole system, this approach can assist designers in choosing changes of the components that would improve the human-machine system. A specific advantage is the ability to assess, under certain assumptions, dependability measures for a future or hypothetical system (given hypothetical changes in its parameters), or an existing system when used under different circumstances; one can compare alternative system designs, which in this case may include changes to the design of the machine, the choice or training of users and/or the procedures of use.
One focus of our modelling approach is determining how likely systems (and their human and computer subsystems) are to fail for specific conditions. In mammogram interpretation, two types of failures can occur: a) false negative, when a cancer is missed; b) false positive, when a normal case is incorrectly recalled as a suspected cancer.
The HTA trial used a sizeable set of mammography cases and was conducted with a relatively large number of practitioners; it generated extensive empirical evidence of potential use to inform our probabilistic models. However there are features of our modelling approach for which the data provided by this trial are not sufficient.
A piece of information required by our modelling approach is an estimate of the probabilities of human failure conditional on failures by the machine, for different categories of cases (e.g., what types of mammographic features the human is likely to miss or misdiagnose when receiving wrong output from CAD). The trial did not provide enough examples of one specific type of machine failure: false negatives by CAD. As a result, we felt the need for an additional experiment to complement those data (Study 1). The results of this experiment were unexpected but inconclusive and a second experiment (Study 2) was conducted to discriminate between different plausible hypotheses. In the rest of the paper we describe the methods and results of these studies, followed by discussion.
2. MATERIAL AND METHODS
We outline first the data collection methods used in the HTA trial, since we used essentially the same methodology in our follow-up studies. We detail then the specifics of our experiments, in particular their rationale and the methodological aspects in which they differ from the original trial.
2.1 HTA Trial
Participants
The trial was run with 50 practitioners: 30 of them were highly qualified film readers (consultant radiologists) and the other 20 were readers with lower qualifications (15 trained radiographers and five breast clinicians).
Material
from the screening programme in the UK. They included 60 cancers: 40 consecutive cancers detected through routine screening and 20 interval cancers. The outcome for all the cases was proven either by biopsy or by a clear result in a subsequent round of screening. The interval cancers had been reviewed by a panel of radiologists and classified as false negatives. Controls (normal cases) were selected from the same time period as the screen detected cancers.
Additionally, before they started the trial, all readers were presented with one training set to familiarise them with the experimental protocol and with the output of the computer tool.
Procedure
During an initial training session all participants were advised on the typical frequency of prompts and given examples of cases where CAD often generates inappropriate prompts. They were also told they should look at the films in the normal way, before looking at the output of the CAD tool.
All the film readers saw all the cases twice: once without computer support (without CAD: “unprompted condition”) and once with the aid of the CAD tool (“prompted condition”). The order in which each reader viewed the test sets was separately randomised, as was the order in which they viewed the conditions (prompted and unprompted). However, the cases within each data set were presented to all the readers in the same sequence. A minimum period of one week was left between reading a test set in the two conditions.
The readers saw two versions of each case: a) the actual films, positioned on a standard viewing roller; and b) a digitised version of the mammograms printed out on paper.
The participants were asked to mark on the printouts those mammographic features that they thought were indicative of cancer or required further investigation. They were also asked to grade the level of risk associated with the marked features in each case. Finally, readers were asked to make their decision on recall for each case. Specifically, the participants could choose from four alternative recall decisions: 1- recall; 2- discuss but probably recall; 3- discuss but probably no recall; 4- no recall. When seeing the mammograms with the benefit of CAD, the printouts presented to the participants contained the prompts generated by the R2 ImageChecker: the participants were instructed to study the films displayed on the light box as usual, paying particular attention to any areas marked with a prompt on the paper copy. See more details in (3).
2.2 Study 1
As noted the motivation for this study was to investigate further the humans' responses to CAD’s false negatives; specifically we were interested in estimating the probability of a human reader making a wrong decision conditional on the probability that the CAD failed to prompt a cancer.
There are two ways in which CAD can “miss” a cancer: a) by failing to place any prompt on the mammogram (“unmarked” mammogram); or b) by placing prompts only in areas of the mammogram away from the area where the actual cancer is located (“incorrectly marked” mammogram).
limited. Only about 16 of the 180 cases in the trial were false negatives from CAD; they account for about 30% of the total number of cancers (sixty). This sample was not big enough for our intended analyses and we conducted a follow-up experiment (Study 1) with a new data sample containing a larger proportion of false negative errors of the CAD tool. We describe below, in some detail, the criteria we used to select our data set.
Participants
Twenty film readers from three different screening centres in the UK participated in the study. They all had taken part in the previous sessions of the trial. Twelve of them were radiologists, seven were trained radiographers and one was a breast clinician. They were all actively involved in breast screening.
Material
Sixty sets of mammograms were used in the study, each corresponding to a different patient and comprising 4 images (2 views of each breast). They were provided by the developers of R2 ImageChecker from a repository of cases they used to train the algorithm. The diagnosis for all the cases was known, proven either by biopsy or by a clear result in a subsequent round of screening. The output of the CAD tool was also known and recorded for every case. After the start of the clinical trial at least two new versions of the image processing algorithms were developed by the manufacturers of R2 ImageChecker; we ensured that the cases in our follow-up studies were processed by the same version of the image processing algorithms that was used to process the cases in the HTA trial.
We selected the cases to meet two criteria: 1) to contain a large proportion of cancers "missed" by CAD, as defined above; but 2) to resemble as much as possible the test sets used in the original trial. We wanted the readers to perceive our study as an
extension to the original trial and to behave in a comparable way. So we tried to mask the fact that the CAD tool was being much less sensitive than in the original trial as this might cause them to change their own threshold (and their ways of using the machine prompts) to compensate. Table 1 summarises the composition of the data set we used for Studies 1 and 2.
We tried to keep as many case characteristics as possible similar to those in the original data sets. We gave priority to the following parameters:
• The number of cases (N=60): the goal was to present a data set of the same
size as each of the sets in the original trial, so that the participants would see it as a “natural” follow-up to the trial.
• The number of cancers: we wanted to have as many cancers as possible in the
• The specificity of CAD: we were not interested in studying how false positives
affect the readers’ behaviour. If the specificity were significantly different in the new set, we would be introducing an additional variable which may have effects that we could not control/elucidate. CAD’s specificity for our data set is 27%, within the range of the original data sets (23%-41%).
• The number of correctly marked cancers: the reason to keep this number
“constant” (though not the rate, i.e., the sensitivity) was so that it would not be too obvious to the participants that they were going to see many more false negatives by CAD than in the previous sets; again if we reduced the number of correctly marked cases, this could influence the readers’ expectations about the performance of the CAD tool early on in the session. We kept this at the lower end of range of the sets in the HTA trial (minus one).
In the data sets of the HTA trial, the average number of cancers missed by CAD is around 5 (between 27% and 35% of the cancers). For the new data set, we decided to increase this number as much as possible within the constraints noted above. The figure we ended up with is 20 (66% of the cancers in our set).
A parameter we were aiming to keep constant was the number of cases (whether cancers or not) on which CAD put no marks at all. However, since the effect of unmarked cancers was one of the features we were interested in measuring through this study, the overall number of unmarked cases ended up being much higher than in the data sets in the HTA trial.
The primary abnormality for 10 of the cancers was calcification; the other 20 were masses (either round or ill defined).
Procedure
The reading procedures were essentially the same as in the HTA trial. However there were two important differences:
1. All the readers went through one reading session only, viewing all the cases with computer support (i.e., they only saw the cases in the “prompted condition”). 2. The order in which a reader viewed the cases in the set was randomised separately
for each reader (whereas in the trial, all the readers viewed the cases within each data set in the same sequence).
Otherwise, the instructions given to the participants were the same as in the HTA trial.
In addition, at different stages of the HTA trial and of Study 1, the readers were asked to fill in a series of questionnaires which asked about various issues related to CAD, breast screening practice and the characteristics of the cases used in the studies. A final questionnaire asked about the perceived differences between the data set in Study 1 and the sets in the HTA trial in terms of the behaviour of the CAD tool and the characteristics of the test cases.
2.3 Study 2
of readers with computer support (“prompted condition”). However the results of the study were highly unexpected. The average reader sensitivity was surprisingly low (52%) and this decrease was particularly strong for cancers which had not been prompted by CAD (see Table 1). One plausible explanation for these results was that computer failures had had a significant negative impact on readers’ decisions. But we could not exclude the possibility that the cases in our study had characteristics that made them particularly difficult (perhaps mammographically undetectable) for both the human readers and the computer tool.
We decided to conduct Study 2, in which readers saw the same cases without computer support (“unprompted condition”), as a “control” for Study 1. The goal was to elucidate whether the readers failed to recall such large proportion of cancers because of the misleading influence of CAD or because of the intrinsic difficulty of the cases or whether it was the combination of both factors.
Participants
Nineteen film readers from three different screening centres in the UK participated in the study. None of them had taken part in Study 1, but a large subset (11 of them) had participated in the HTA trial. The characteristics of the readers were equivalent to those of the participants in Study 1 in terms of years of experience, professional qualifications, etc. Six of them were radiologists, seven were trained radiographers and six were breast clinicians. They were all actively involved in breast screening.
We decided to use readers who had not participated in Study 1 partly because of pragmatic reasons (limited availability of the readers) and partly because we wanted to avoid "memory effects". A main goal of Study 2 was to elucidate how "difficult" the cases in our set were and if we had used the participants from Study 1, their responses may have been influenced by their previous exposure to the cases. Naturally, since Study 2 was designed as a reaction to the results of Study 1, it was impossible to randomise the allocation of readers to the two conditions (unprompted vs. prompted), which we would have preferred.
Material
The readers saw exactly the same data set used in Study 1.
Procedure
We used the same procedure as in Study 1 except that the readers saw the cases only in the “unprompted condition” (without CAD). As in previous sessions, the readers were presented with the actual films, positioned on a standard viewing roller but instead of a printout of the digitised version of the mammograms they were given an abstract diagram on paper representing the 4 views of the breasts. They were asked to mark the areas on the diagrams that corresponded approximately to the location of the features they had detected on the mammograms.
cancers in our data set. One way of measuring case difficulty would be to look at the proportion of readers who failed to detect (and then recall) a cancer. A cancer which is detected by none (or only by a very small proportion) of the readers would be considered to be “occult” or “mammographically undetectable”. This kind of estimation could be obtained by looking at the readers’ decisions during Study 2 but we wanted to obtain more fine-grained information.
The judges in this new test were presented again with the 30 mammograms containing cancer and were given information about where the cancer was located and the type of cancer it was (e.g. whether it was a mass or calcification). The judges were allowed to look at their own decisions during Study 2 for each of the cases.
The judges were asked to rank each mammogram according to a set of criteria that we believed could be indicators of difficulty, for example, the technical quality of the films and the tissue density of the breasts. The judges were also asked to rank each case in terms of how difficult they thought it was to detect the malignant features on the mammogram and how difficult they found to assess how suspicious the detected features (if any) were. Finally we asked them for a subjective estimate of the proportion of readers who would recall each cancer (in a continuum from “all/most” readers to “very few/none” of the readers).
3. RESULTS
3.1 Supplementary analyses of data from the HTA trial
The administrators of the HTA trial compared the sensitivity and specificity of the readers in the unprompted condition with their sensitivity and specificity in the prompted condition. The analyses showed that the prompts had no significant impact on (neither improved nor diminished) readers' sensitivity and specificity (3).
We were granted access to the trial data and conducted supplementary analyses focusing on the instances in which the readers made different decisions for the same case depending on whether they saw it with the aid of CAD (prompted condition) or without CAD (unprompted condition). These analyses showed that variations in “recall/no recall” decision by the same reader for the same case occurred for about 28% of the readers' decisions. We categorised the decisions as either: (a) "confident" (if the decision was 1 or 4, that is, the reader strongly recommended either recall or no recall); or (b) "unconfident" (if the decision was 2 or 3, which indicated that the reader had some uncertainty about the case and deemed that further discussion was required). One of the striking findings in our analyses was that the readers were likely to issue more correct decisions in the prompted condition when dealing with normal cases for which they had given an "unconfident" decision in the unprompted condition. By "more correct" (for normal cases) we mean that the decision in the prompted condition was closer to the "no recall" decision than in the unprompted condition. In other words, for “non obvious” normal cases, the readers tended to perform better during the prompted condition than during the unprompted condition. This data pattern was statistically significant: this systematic variation in the readers’ decisions was not observed for the cases with cancer.
3.2 Comparison between Study 1 & Study 2
sensitivity in the “prompted condition” in the HTA trial and the average reader behaviour in real world practice (with sensitivity usually around 80% ).
We looked at whether the recall decisions generated by the readers were correct (i.e. they recommended recall for cancers and no recall for normal cases) or not. We found that 73% of all the decisions were correct. However, the proportion of correct human decisions varied greatly depending on whether a case was normal or cancer and whether it had been correctly prompted by the CAD tool or missed. This is shown in Table 2.
A striking data pattern in the table is that very few of the decisions generated for the “unmarked” cancers and only over half of the decisions for the “incorrectly marked” cancers were correct; in contrast with the very high proportions of correct answers for the normal cases and, to a lesser extent, the correctly prompted cancers.
We also found that there was only one “unmarked” cancer that a majority (80%, 16 out of 20) of the readers chose to recall. More strikingly, the remaining seven “unmarked” cancers elicited an “incorrect” decision (not to recall) from 18 or more of the 20 participants; further, for two of those cases, the “incorrect” decision was unanimous: all readers chose not to recall them.
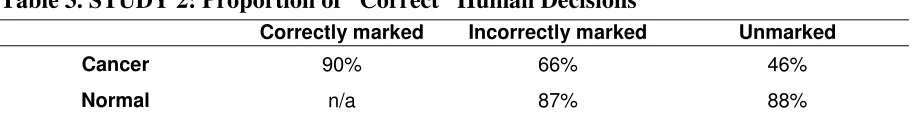
In Study 2 the average reader sensitivity was still relatively low: 68% (minimum: 50%; maximum: 87%). However ANOVA showed a statistically significant difference between readers’ sensitivity in Study 1 and Study 2 (F=17.17, p<0.001). The average specificity in Study 2 was lower than in Study 1 (86% vs. 90%), but the difference was not statistically significant (ANOVA, F=3.91).
The proportion of correct decisions for all cases in Study 2 was 81%. Table 3 shows the proportions of correct decisions for the cases grouped according to the correctness of the output of the CAD tool. Even if the readers in Study 2 saw the cases without prompts, it is helpful to categorise cases according to CAD output as it allows us a fine-grained comparison of readers’ performance with and without computer support. It is worth noting that ANOVA showed highly significant difference (F=22.82, p<0.000001) between the responses given to the “unmarked” cancers by readers in Study 2 and Study 1. The difference was also statistically significant (F=10.71, p<0.01) for the “incorrectly marked” cancers. It is worth noting that also for the “correctly marked” cancers the readers in Study 2 (who saw the cases without computer support) generated more correct decisions than the readers in Study 1 – although the difference is not statistically significant (ANOVA, F=2.09,).
Additionally, the two cases that all readers in Study 1 failed to recall were recalled in Study 2 by 6 and 4 readers respectively.
For the normal cases, readers supported by CAD (Study 1) seemed to perform better than readers in Study 2; but this difference in specificity is statistically significant only for the cases in the “unmarked” category (ANOVA, F=5.98, p<0.05).
3.3 Responses to questionnaires
On the differences between our data set and data sets in HTA trial
a) eight readers answered that the new data set had the same proportion of cancers as or fewer cancers than the sets in the HTA trial (it actually contained a few more cancers)
b) four readers answered that the new data set had the same proportion of cancers missed by CAD (it actually contained many more)
c) eight readers answered that the new cases were as easy to read as (or easier than) the cases in the original trial (as we will show below there are good reasons to believe that the cases in our data set were considerably more difficult than those in the HTA trial)
d) five readers answered that the CAD prompts were more useful in Study 1 than in the original trial because they perceived that in our data set there were fewer “distracting” prompts (in reality, there were fewer correct prompts for cancers).
Subjective estimates of case “difficulty” and further analyses
We found a reasonably high agreement among our six experienced “judges” in their responses to the post-Study 2 questionnaire on case difficulty (see procedure in section 2.3).
The judges’ average subjective estimates of the proportion of readers who would recall each cancer were very strongly correlated with the number of readers who actually recalled each case in Study 2 (ρ=0.843; p<0.001). This seems to suggest that
experienced readers may be good judges of the “difficulty” of a cancer (in terms of how many people will recall it).
We found that, for seven of the cancers in our data set, at least half (three or more) of the judges estimated that no reader (or a very small proportion) would recall them. For five of these cases, at least two judges commented that the cancers were not visible, even after looking carefully at the suspicious areas with a magnifying glass. Two of these cases were the cancers that no reader in Study 1 (prompted condition) recalled.
At least two of the judges commented that one of these seven cases was “visible but difficult”. We decided that the remaining six cases were probably “occult” cancers, undetectable via mammography. These six cases were also ranked by all (or all but one) of the judges as being dense and very difficult to detect and classify. Also all but one of these six cases were ranked by a majority (five) of the judges as being of poor technical quality.
Two of these six cancers had been originally classified as “incorrectly marked” cancers and the other four were “unmarked” cancers. The primary abnormality for all but one of the six cases was calcification.
We reclassified these six cases as “normal” and re-calculated the sensitivity of the readers in Study 1 and Study 2 for the remaining 24 cancers. We found that sensitivity increased for most readers in both studies; but there was still a statistically significant (ANOVA, F=9.40, p<0.01) difference between the average sensitivity of readers in Study 1 (61%; maximum: 79%; minimum: 33%) and readers in Study 2 (73%; maximum: 92%; minimum: 58%).
significant (F=6.27, p<0.05) for the “incorrectly marked” cancers (55% in Study 1 vs. 67% in Study 2).
4. DISCUSSION
Our supplementary analyses of the data from the HTA trial suggest that the output of the CAD tool did have an effect on the readers' decision making even if there was no statistically significant effect on their average performance in terms of sensitivity and specificity. We cannot exclude the possibility of the variations we observed being due to random error (e.g., it is not rare that experts change their decisions in successive presentations of the same case). However our analyses strongly suggest that the output of the CAD tool (in particular, absence of prompts) might have been used by the readers as a sort of reassurance for their “no recall” decisions for normal cases. We believe this possible side effect of CAD use was not anticipated by the designers of the tool, which was essentially designed to assist with cancers.
To a great extent, this is consistent with the results from our follow-up studies. The results of Study 2 suggest that the unexpected behaviours detected in Study 1 (e.g., poor sensitivity of readers ) were caused by a combination of the two factors we had considered: the difficulty of many of the cases in our data set and detrimental effects of incorrect computer output. We saw that at least six of the cases in our test set were probably undetectable (occult) cancers. Many of the other cases, even if detectable, were probably difficult to interpret. Even in the unprompted condition (Study 2), the average sensitivity of readers was below the usual average sensitivity in clinical practice. However this does not account for the striking differences in average reader sensitivity between Study 1 and Study 2, especially for cancers which were “unmarked” by CAD. Even when we removed from our data set those six (possibly) occult cancers, the differences between readers’ sensitivities in the two studies were statistically significant (as reported above).
One possible way of interpreting these results is that the readers were in some way misled by CAD; one could argue that the readers tended to assume, based on past experience with the tool, that the absence of prompting was a strong indication that a case was normal, thus they paid less attention than necessary to those cases with no prompts on. Since the CAD tool’s specificity is very low, many of the prompts it places on the mammograms can be seen as distracting and it may turn out that, in many instances, the absence of prompts is more informative than their presence. This is consistent with results of earlier human factors studies of “automation bias” (6,7), which looked at the effect of wrong computer advice on students’ decisions in laboratory settings simulating aviation monitoring tasks. The kinds of behaviours we encountered in our studies are consistent with what these studies describe as errors of omission, namely, failure to take appropriate action because the automated tool fails to detect or indicate an event or irregularity.
not to recall the case. In other words, for ambiguous signs, readers may have used absence of prompts as a reassurance for a “no recall” decision. This means that readers may have been using CAD not only as a detection aid but also as a classification or diagnostic aid, which is not what the tool was designed for. There is supporting evidence from human factors studies of different (but similar) CAD tools which indicate that readers may occasionally use these tools in such a way (8).
One could argue that using absence of prompts in the ways we have just described is a rational approach, especially considering the low specificity of existing CAD tools, which typically results in an excess of distracting prompts. Indeed human factors studies of warning systems suggest that failing to respond to a hazardous event as a result of the absence of an automated warning is not necessarily an error as it may be cost-effective depending on the circumstances (9). It is not clear what the implications would be for breast screening (in terms of endangering patients' lives) if the kinds of automation biases we are describing actually occur in real world usage of CAD.
We cannot exclude the possibility that these behaviours are an artefact of experimental conditions. A common criticism of studies like the ones we present here is that they are conducted with data sets containing unrealistic proportions of cancers. Egglin (10) in a study of radiologists' interpretations of pulmonary diseases found evidence of "context bias", namely, an influence of the prevalence of disease in the judgments of radiologists. Similarly, a study comparing the behaviour of mammographers in clinical conditions with their behaviours in test conditions (where cancer prevalence was much higher) showed a low correlation between readers' test accuracy and their clinical accuracy (11). One must be careful, therefore, when extrapolating from the behaviours observed in the HTA trial and in our studies to estimated effects in the field. We must highlight, however, that readers in Study 1 and Study 2 saw the same test set; therefore cancer prevalence is unlikely to account for the differences in sensitivity.
Our test set also contained an unrealistic number of cancers that were missed by CAD. All readers who took part in Study 1 had participated in the HTA trial: they had been exposed to the behaviour of the CAD tool and knew it was very sensitive. Prior to their participation in Study 1, the readers were not informed that the tool's sensitivity for the new test set was going to be much lower than for the test sets in the HTA trial to avoid a bias in their behaviour. One could argue that readers' expectations of CAD's behaviour may have influenced the way they approached the cancers missed by CAD in Study 1 (especially the more difficult cancers which were "unmarked"). We have indications from some of our analyses and from informal conversations with film-readers that they may calibrate their performance to the expected prevalence of cancers and to the expected proportion of cancers missed by CAD in a data set. We believe that these effects have not received sufficient attention to date and are definitely worth exploring further.
Even if our results were not an indication of what actually happens in clinical practice with CAD, they still provide evidence of possible unexpected mechanisms of automation bias. Since these may manifest themselves in clinical practice as well, they deserve more research and more attention in CAD design. Assessments of CAD efficacy should in the meantime take their possibility into account.
approaches to CAD evaluation. Trials of medical computer tools tend to focus on the ways in which the tools can help clinical practitioners and may end up overlooking the ways in which these tools could actually damage the reliability of human decisions. This could lead to potential damaging consequences for patients. It may also hide possibilities of improving the average benefit of a computer aid by reducing automation bias effects rather than focusing on improving the computer algorithms used.
ACKNOWLEDGEMENTS
The work described in this paper has been partly funded by UK's Engineering and Physical Sciences Research Council (EPSRC) through DIRC, an interdisciplinary research project investigating the dependability of computer based systems. We would like to thank: R2 Technologies (and very especially Gek Lim, Jimmy Roerigh and Julian Marshall) for their support in obtaining the data samples for our follow-up studies, Paul Taylor and Jo Champness (from UCL) for granting us access to their data, facilitating the follow-up studies and helping run them, DIRC collaborators Mark Hartswood, Rob Procter and Mark Rouncefield for their advice.
REFERENCES
1. Littlewood B, Popov P, Strigini L. Modelling software design diversity – a review. ACM Computing Surveys 2001; 33(2): 177-208.
2. Strigini L, Povyakalo A, Alberdi E. Human-machine diversity in the use of computerised advisory systems: a case study. In: Proceedings of DSN 2003, International Conference on Dependable Systems and Networks, San Francisco, 2003; 249-258.
3. Taylor PM, Champness J, Given-Wilson RM, Potts HWW, Johnston K. An evaluation of the impact of computer-based prompts on screen readers' interpretation of mammograms. British Journal of Radiology 2004; 77(913): 21-27.
4. http://www.r2tech.com
5. Castellino R, Roehrig J, Zhang W. Improved computer aided detection (CAD) algorithms for screening mammography. Radiology 2000; 217(P) 400.
6. Skitka LJ. Does automation bias decision making? Int. J. Human-Computer Studies 1999; 51: 991-1006.
7. Skitka LJ. Accountability and automation bias. Int. J. Human-Computer Studies 2000; 52: 701-717.
8. Hartswood M, Procter R. Computer-Aided Mammography: A Case Study of Error Management in a Skilled Decision-making Task. Journal of Topics in Health Information Management 2000; 20(4): 38-54
9. Meyer J. Effects of warning validity and proximity on responses to warnings. Human Factors 2001; 43(4): 563-572.
10.Egglin TK, Feinstein AR. Context bias. A problem in diagnostic radiology. Journal of the American Medical Association 1996; 76(21): 1752-1755.
Table 1. Composition of the data set used in the follow-up study Correctly marked
(N=10)
Incorrectly marked (N=23)
Unmarked (N=27)
Cancer (N=30) 10 (11-13) 11 (2-5) 9 (1-2)
Normal (N=30) n/a 12 (29-34) 18 (6-11)
Note. The numbers in bold type correspond to the actual numbers in the new data set. The intervals shown within brackets correspond to the ranges in the data sets used in the HTA trial.
Table 2. STUDY 1: Proportion of “Correct” Human Decisions
Correctly marked Incorrectly marked Unmarked
Cancer 81% 53% 21%
Normal n/a 92% 94%
[image:16.595.90.546.295.354.2]Note: The percentages have been calculated out of the total number of “recall/no recall” decisions generated by the 20 participants in each case category.
Table 3. STUDY 2: Proportion of “Correct” Human Decisions
Correctly marked Incorrectly marked Unmarked
Cancer 90% 66% 46%
Normal n/a 87% 88%