Robust Multi-disciplinary Modelling of Future
Re-usable Aerospace Planes
R. Wuilbercq
∗, A. Mogavero
†, R. E. Brown
‡Centre for Future Air-Space Transportation Technology,
University of Strathclyde, 75 Montrose Street, Glasgow G11XJ, United Kingdom
Practical embodiment of the Single-Stage to Orbit concept has long been held as the key to unlocking a future of rapid, reliable, even scheduled access to space. The full potential of Single-Stage to Orbit will only be realised when this vehicle concept is integrated into an airline-like operational paradigm which has, as its basis, the re-usability of the individual vehicles that comprise the fleet, but in addition, extends to the long-term assuredness of operations through sustained reliability, quick turnaround, and control over recurring costs to the point where the profitability of the enterprise can be assured for its owners and investors. The purpose of this paper is to make some initial steps towards providing some quantitative answers as to how decisions that are made regarding the design of the actual hardware might impact on long-term viability of the technology through influencing the reliability of the system and eventually its cost when incorporated as part of an integrated transportation system. This is achieved through embedding a physics-based simulation of the performance of the vehicle subsystems, under operational conditions, into a Discrete Event Simulation of spaceport operations, allowing the statistical relationship between the various design characteristics of the vehicle, and the metrics that are relevant to its operational cost, to be exposed.
I.
Introduction
T
hedesign of any future Space Transportation System will be characterised by the very large numberof technical challenges, across a wide range of engineering disciplines (e.g. aero-thermodynamics, struc-ture, propulsion, thermal environment, reliability, operations and costs), that will require coupled, multi-disciplinary and simultaneous solution. If the true potential of rapid, reliable, even scheduled access to space is to be achieved, particular care will need to be paid to ensuring the safety and reliability of the vehicle under the extremely hostile conditions to which it will be exposed during its mission. Indeed, reliability rates close to those currently enjoyed by the civil airliner industry may come to be expected by the users of the technology before it can become an economical and viable component of any future transport network. Experience shows just how far the ‘Space’ industry may have to evolve, however, before it is able to come even close to achieving these lofty goals, and this paper explores the key relationship between the actual hardware that is designed and how that hardware is used in practice – with the aim of understanding how that relationship might impact on the viability of any future Space Transportation System.
Current indications all point to a very strong incentive for future space-access vehicles to be designed to befully re-usable– thus to allow their owners and operators to ameliorate their acquisition cost over multiple missions. Part of this ownership strategy must also be to limit operational costs by reducing the amount of maintenance and refurbishment that is required between flights. The holy grail in terms of re-usability is the so-called Single-Stage to Orbit (SSTO) concept in which a single vehicle is able to ascend to orbit and then to return,intact, to its operating base in order to be refurbished and subsequently re-flown. The most popular, although not the only, embodiment of this concept is the so-called ‘space plane’ which is inherently aircraft-like in its configuration and in parts of its operational paradigm. The economics of any SSTO-based
transport system will force each individual vehicle in the fleet to have to repeat its mission a large number of times without undergoing any major overhaul. An interval between major inspections of 100 to 200 missions seems not unreasonable given current airline practice, for instance. The re-usability requirement thus creates a difficult challenge that must be overcome by a careful and synergistic design of the various subsystems of the vehicle – despite the very slim design margins that are inherent in the SSTO concept.
There is a clear need to employ a broad-reaching and cross-disciplinary methodology in order to design and optimise this future generation of trans-atmospheric vehicles if they are ever to become a practical reality. At the ‘system of systems’ level, though, it is also clear that many important considerations, particularly with regards to how SSTO vehicles might be operated as part of the overall transport infrastructure, and more specifically as to how the characteristics of the SSTO infrastructure might change as individual vehicles within the fleet begin to age and deteriorate through use, are still very much overlooked in the open literature, or at best are not given the attention that they deserve. The lack of attention to this important topic is perhaps understandable, given the current infancy of the technology as a whole, and indeed the present focus within the community on the evolution, to the point of initial feasibility rather than necessarily to the point of established engineering reliability, of those individual technologies that might one day be brought together to produce a viable SSTO vehicle. The purpose of this paper is to make some initial steps towards providing some quantitative answers as to how decisions that are made regarding the design of the actual hardware might impact on long-term viability of the technology through influencing the reliability of the system and eventually its cost. First, though, in the following three sections of the paper, some flavour is given of the technical challenges that must be addressed in the design of any future SSTO vehicle. Particular emphasis is placed on the impact of design decisions that are made with respect to two of the major subsystems of the vehicle, namely the thermal protection system and the propulsion system, on its subsequent reliability as part of an integrated transportation system. In the third section, some of the issues surrounding the economics and operational cost of the vehicle are highlighted in the context of the vehicle’s design.
I.A. Thermal Protection System
For various compelling technical reasons, future trans-atmospheric vehicles will most likely accelerate up to orbital speed by means of a complex hybrid propulsion system, for example one based on the Rocket-Based Combined Cycle (RBCC) concept, when still within the denser part of the terrestrial atmosphere. The high velocity of the vehicle, when combined with the high air density in the lower atmosphere, will expose it to particularly severe heating as well as to intense gust-induced loading on its structure. By contrast, during atmospheric entry, the same vehicle will most likely follow an un-powered gliding trajectory during which deceleration to lower velocities will occur at high altitude where the density of the air is relatively low. Although it may be possible to design the vehicle so that the peak heating during descent may be somewhat lower than that experienced during ascent, the integrated heat load that will need to be dissipated or absorbed by the vehicle will not be very much different between the ascent and descent phases of its mission. The ability of the vehicle to withstand the imposed thermal loads will be a source of particular concern for the designers when establishing the viability of any new concept. When planning the trajectory of such vehicles, their controls will have to steer both their ascent and re-entry along a corridor that is heavily constrained by considerations of both structural loading and aerodynamic heating. Experience has shown that when these constraints are introduced into the design of the vehicle, a careful balance needs to be struck between the robustness of the Thermal Protection System (TPS) and the resultant mass of the vehicle if later penalties in terms of operational cost and maintenance time are not to be incurred. In fact, one of the many lessons learned from the Space Shuttle programme was how sensitive the economics of a re-usable vehicle could be to the robustness and maintainability of its TPS.
approach, similar to that used on the Space Shuttle, to the use of a combination of passive, semi-passive, and active TPS.1 The resulting thermal shield will most likely make use of a combination of lightweight protective materials together with a complex Active Cooling System (ACS) involving the re-circulation of a coolant through the most severely heated parts of the structural skin – for example the leading edges of the wing, the nose etc. The most effective thermal management strategy might indeed result from a marriage between the active cooling approach and the radiative heat shield technology that was originally developed for advanced re-entry vehicles2 - for example using the Space Shuttle’s Advanced Carbon-Carbon (ACC)
tiles or Ultra High-Temperature Ceramics (UHTC).
Additionally, sizing the TPS exclusively for the high-temperature conditions to which the vehicle might be exposed during its mission may not necessarily ensure that the vehicle will meet all of its performance requirements. Indeed, it is not too difficult to envisage that part of the operation of future re-usable space-access vehicles might involve their being held at a spaceport for a short period of time between missions while their cryogenic propellant tanks are re-filled and small restorative maintenance tasks are performed. During these ground-hold operations, the vehicle will be exposed directly to ambient ground-level conditions, as opposed to the conditions that characterise their in-flight mission profile. Heat transfer from the atmosphere to the surface of the vehicle will thus be primarily convective and will take place at a much lower rate than when the vehicle is in flight. The materials that cover the cryogenic tanks might then need to be sized to prevent the formation of ice on the outer surface of the vehicle prior to launch. Ice formation has the potential to be extremely hazardous, of course, given the aerodynamic and mass penalties that it would induce on the performance of the vehicle were it to take off with the ice layer intact. Repeated and cyclic accumulation of ice or frost on the TPS may also degrade its mechanical properties over time through a process that is well known to geologists who work in the cold climes so familiar to the authors of this paper. Finally, fragments of ice may detach from the surface of the vehicle during the stresses of operation, subsequently to hit and damage other parts of the vehicle. Indeed, this prospect was a source of critical concern in the early design of NASA’s Space Shuttle,3 of course later to be realised with catastrophic consequences for one of the vehicles
and its crew.
I.B. Propulsion System
Essential to achieving the levels of propulsive efficiency required for the SSTO concept to become a practical reality will be the use of air-breathing engine technology. Ignoring for the moment the significant prob-lems that are imposed by takeoff and subsonic flight, a scramjet-powered vehicle might, for instance, use atmospheric oxygen to sustain combustion during the accelerative, low-altitude portion of its trajectory, obviating the need to carry the oxidiser for that part of the mission profile and allowing a significant fraction of the vehicle’s mass budget to be apportioned elsewhere. Of course, beyond a certain speed and altitude, air-breathing propulsion becomes infeasible, necessitating the use of some form of hybrid propulsion system, perhaps using rockets that draw their oxidiser from onboard sources. The challenge here is to design a system that can operate efficiently in both air-breathing and rocket mode without imposing undue complexity on the system (with concomitant impact on the maintainability and reliability of the vehicle) or the carriage of significant dead weight during particular portions of the flight envelope. Elements of the systems that might eventually constitute the propulsion systems for the SSTO vehicles of the future do currently exist, but the state of the art is characterised by, arguably, a very low, and certainly a very uneven, technological readiness level. Understanding how these engines might function after repetitive and cyclic exposure to flight conditions is still relatively low on the list of development priorities for many of these systems, with a notable exception being the work conducted on the ‘thermal cocooning’ of Turbine-Based Combined Cycle (TBCC) engines by Bulman and colleagues at Aerojet Rocketdyne.4
costs) than their hydrocarbon equivalent, merely through the inherent nature of their physics.
The choice of propellant can of course have a wider influence on the system than simply its impact on the technology that is used to propel the vehicle in the first place. The low density of liquid hydrogen necessitates a large volume for its storage (and thus a very bulky vehicle). To save on structural mass, the walls of the cryogenic tanks will most likely thus have to form part of the load-bearing fabric of the vehicle (in a so-called integral tank configuration) in addition to their primary role in insulating their contents from external thermal influences. Since the cryogenic propellant may also be used regeneratively to cool parts of the vehicle (particularly the leading edges of the wings and perhaps elements of the internal structure of the engine), the entire structure of the vehicle might be subjected to significant fatigue loads as a result of thermal cycling. The introduction of new materials, such as advanced fibre composites, that can withstand these loads, may be necessary before cryogenic fuel tanks that allow an economically competitive payload-to-mass ratio become a practical reality. More importantly, given past experience with both carbon and metal composites in aerospace applications, the degradation of the properties of these materials as they are exposed, either simultaneously or cyclically, to the cryogenic environment and to the temperatures on the exterior of the vehicle during hypersonic flight, will need to be properly understood and experience built up in their practical structural use before the appropriate reliability and maintainability regimes can be put in place in order to satisfy the rigours of the airline-like operational paradigm. Last but not least, the close coupling between airframe and propulsion system, that seems to be an inherent by-product (although some might disagree, most notably perhaps the designers of the Skylon space plane) of the combustion characteristics of these fuels, adds significant complexity to the design of the vehicle, complicates the maintenance task and introduces a number of compelling safety concerns regarding redundancy and damage isolation that will need to be addressed in order to meet the standards that are currently achievable in airline practice using, for instance, aircraft with engines slung under the wings in nacelles or pods.
I.C. Engineering Impact on Economics
It is undoubtedly the case that the successful introduction into service of a fully re-usable space-access ve-hicle, particularly one that has its economics ensured through the inherently high reliability of its systems, its easy maintenance and its quick turnaround time, could hasten the onset of an entirely new paradigm in the aerospace industry in which rapid, reliable access to Earth orbit becomes as routine an element of the planetary transport infrastructure as the scheduled airline operations of today.5 As alluded to earlier in this
paper, however, the full potential of SSTO will only be realised when this vehicle concept is integrated into an airline-like operational paradigm which has, as its basis, there-usability of the individual vehicles that comprise the fleet, but in addition, extends to the long-term assuredness of operations through sustained reliability, quick turnaround, and control over recurring costs to the point where the profitability of the enter-prise can be assured for its owners and investors. Elements of this argument have indeed been acknowledged in the glossy literature that has accompanied almost every single SSTO concept that is being promoted or has been promoted in the past. It seems quite straightforward to (re-)assure investors of the affordability, indeed profitability, of one’s own particular SSTO vehicle concept by claiming that its economics are such that its production/purchase cost can quite feasibly be amortised over the lifespan of the vehicle,6 but the question must remain as to the reliability, if not the veracity, of such claims, especially given the very broad margins of uncertainty that necessarily accompany any attempt to apply rigorous, quantitative analysis to such high-level attributes of a technology which is at such an embryonic stage in its development. Indeed, proponents of expendable launch vehicle (ELV) technology argue that the successful introduction of viable re-usable launch vehicle technology, let alone SSTO, would require simultaneous breakthroughs in such a large number of critical technologies (e.g. in the fields of propulsion, thermal management and materials as described earlier) as to be unachievable given likely levels of investment in such a project. Indeed, in the words of one influential commentator, “twenty-five billion dollars investment to achieve significant RLV progress is not out of the question”.7 Although history has had a curious tendency to prove such emphatic
the argument misses the point that there is fundamental difference between the concepts of technological qualification, as applied within the ‘Space’ industry, and incremental validation, as practised for many years within the aeronautics industry, particularly when it comes to establishing systems reliability.
Nonetheless it is clear that RLV and SSTO technology will need to distinguish itself clearly from its competitors on economic grounds before a clear case can be made for moving it from the minds of enthusiastic supporters and the projection screens of esoteric conferences to the drawing boards, onto the shop-floors and onwards into the air and thus into Earth orbit and back again. Never has this been clearer than now, given the very strong economic competition from other nascent technologies, particularly the partially re-usable rocket systems that are engendering significant excitement within the industry and will, in all likelihood, come into service long before the first SSTO vehicle.
II.
Spaceplane Operations
B
road and philosophical arguments aside, the question then must be asked if a somewhat more prosaicapproach might not be adopted to shed light on some of these arguments, thus to move the current, and inherently unresolveable, polemic between the various detractors and proponents of SSTO technology towards a consensus that is based on reliable quantitative information. The na¨ıvet´e of this question might seem obvious, given the immaturity of the technology and the impossibility of predicting the relevant attributes of the political, economic and technological environment, in which these advanced vehicles will have to operate, as far forward into the future as would be necessary to answer it. Nevertheless, in this paper, a small step in this direction is presented that the authors hope will be of some use in shedding a little light onto some of these important issues.
Present activities naturally, perhaps even necessarily, focus attention on system timescales that are more closely related to the duration of a single mission rather than to the life-span of the vehicle. Today, fully integrated Multi-disciplinary Design Analysis and Optimisation (MDAO) procedures are often used and applied to both the ascent and re-entry phases of the vehicle trajectory in order to try to optimise, concurrently, the various vehicle subsystems to a point where the concept might become technically feasible. Looking further into the future, however, there is a strong need to embed these MDAO studies into some form of analysis which is capable of assessing, as early on in the design as is possible, the effects that preliminary design and technological choices can have on both the efficiency and economic viability of the vehicle when embedded into the broader space-access system of which it is intended to be a part. The present paper will provide preliminary results from a newly developed Spaceport Discrete Event Simulator (S-DES), dubbed HyPort and described in more detail in the next sections of the paper, that can be used to evaluate a number of important operational metrics for a fleet of SSTO-type space-access vehicles early on during concept exploration activities, and indeed that can incorporate certain elements of the reliability and variability of the system into the analysis.
The basic principle underlying HyPort is that the lifecycle costs associated with the operation of a fleet of SSTO vehicles will be the predominant metric in defining whether the system will be economically viable, and hence worthy of public and private investment, or not. In this vein, arguments of strategic necessity or of potential military feed-in or spin-off (such as those that complicated the financial justification of the Space Shuttle programme) are explicitly ignored. These lifecycle costs are then assumed to be associated principally with the cost of operation, as influenced by the frequency and duration of post-flight inspections, scheduled depot maintenance, un-scheduled maintenance, mid-life refurbishment etc, as well as by the vagaries of weather and the many other factors that influence the availability of the system in practice. A causal link can then be established between these factors and the condition of the vehicle, in terms for instance of the integrity and condition of the TPS, and elements of the vehicle’s configuration, for instance the rate at which certain subsystems might fail and the subsequent ease with which these failed components can be accessed – and thus between the cost of operations and the design of the vehicle.
II.A. HyPort Discrete Event Simulator
A small number of other DE simulators for the modelling of the operations of future space-access vehicles can be found in the open literature.9, 10, 11 The HyPort model is similar to these, in that it is able to simulate the
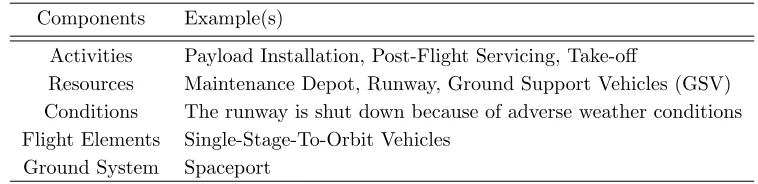
Components Example(s)
Activities Payload Installation, Post-Flight Servicing, Take-off
Resources Maintenance Depot, Runway, Ground Support Vehicles (GSV) Conditions The runway is shut down because of adverse weather conditions Flight Elements Single-Stage-To-Orbit Vehicles
[image:6.612.115.494.55.147.2]Ground System Spaceport
Table 1: The basic objects embedded within the HyPort DE simulator.
into a suite of reduced-order tools for the design of re-usable space planes.2 HyPort exploits the Object-Oriented Programming (OOP) formalism that is inherent in various high-level simulation languages such as C++and Matlab. Using this formalism, a number ofclass objects can be defined; in HyPort each class object represents one particular activity that can be conducted within the simulation. The basic objects that are currently implemented in HyPort are summarised in Table 1 along with some examples to illustrate their use. The space plane operations system is then defined in terms of a combination of processes and activities, together with the way that these processes and activities are sequenced and interconnected to define the ‘process flow’ within the system. Similarly to the RLVSim model of DePasquale et al.,9 HyPort assumes
that there is an unlimited market demand for payload delivery (unless specified otherwise). The demand is thus made equal to the maximum amount of payload that the SSTO transportation system that is based at the spaceport can insert into orbit per year. The number of vehicles and the size of the vehicles in the fleet is determined by the inputs to the model. As such, the model ignores such macro-economic questions such as whether or not the scale of the transportation system is properly adapted to the size of the overall market for its services.
II.B. Activity Modelling
Within the HyPort DE simulator, a discrete sequence of chronologically-ordered activities is defined in order to represent the range of activities that must be carried out on the SSTO vehicle in the interval between its landing following a mission to orbit and its subsequent take-off. Each of these various ‘turnaround’ activities can be arranged to be conducted either in series or in parallel with other activities. Indeed, a series of tasks can be processed concurrently on a given vehicle: for instance the maintenance of the vehicle’s leeward side TPS can be conducted at the same time as the inspection of its air-breathing engine. Alternatively, if the spaceport has sufficient resources, the model can allow the same activity to be performed simultaneously on several separate vehicles. During a simulation, the model propagates forward in time as a sequence of discrete jumps from event to event, with each activity being represented by two events, namely its beginning
time tbegin and its end time tend. The model acknowledges that the duration of any particular activity is,
to all practical intents and purposes, non-deterministic, and thus, in essence, uncertain – for example the duration of a maintenance operation may well depend on the performance of a particular maintenance team on the day, and this may have more to do with the amount of sleep that one particular operator manages to accumulate the night before than on anything more profoundly scientific or predictable.
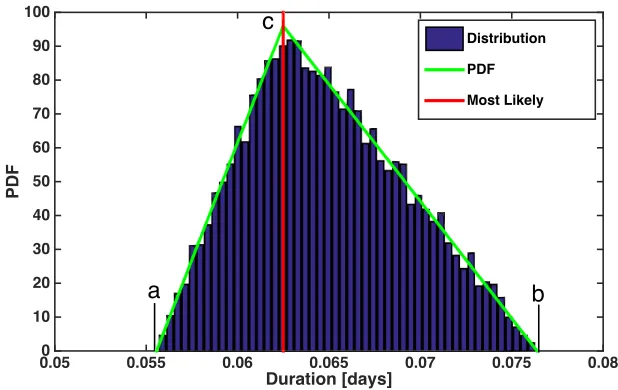
In order to model this randomness that lies at the heart of the various activities and processes that are of interest, HyPort can represent the duration of an activity in stochastic fashion by assigning a probability density function (PDF) to it. While any form of PDF could potentially be used as input to the model, a triangular distribution is commonly held to best model the distribution of times that might be taken to complete any activity of the type that might be classified broadly as ‘industrial maintenance’.9 The
advantage of the triangular distribution is that it can be parameterised in terms of three values which are usually relatively straightforward to estimate from data: the minimal value, the maximal value and the most likely value (see Fig. 1).
II.C. Flight Elements, their Health Monitoring System and their Maintenance
Duration [days]
0.05 0.055 0.06 0.065 0.07 0.075 0.08
0 10 20 30 40 50 60 70 80 90 100
Distribution PDF Most Likely
b
a
[image:7.612.145.454.55.250.2]c
Figure 1: An example of triangular Probability Density Function (PDF) whereais the best-case estimate,
cis the most likely value and bis the worst-case estimate.
think of this as a schedule or check-list) is attributed to all Flight Elements within the fleet at the beginning of each new mission. The sequence is not necessarily static: additional activities may be appended to the list during the simulation if some pre-determined set of conditions is met or following the occurrence of an aleatory event – for instance if premature deterioration of the TPS due to micro-meteorite impact is detected, and this is deemed to require the addition of an unscheduled maintenance activity to the list of activities to be attributed to the Flight Element. Each FE possesses a centralised Health Monitoring System (HMS) that evaluates, after each completed mission, the state of the vehicle’s subsystems (for instance its TPS and its propulsion system). Each of the FE’s subsystems carries a ‘health bar’ that represents the number of ‘Health Points’ (HPs) that it has left. The health bar of each subsystem loses its HPs through deterioration or damage to the subsystem, the extent of which is determined during each mission either through physical modelling of the degradation processes themselves or through the application of simple physics-based heuristics (see Section IV) until the bar is emptied. When the health bar of a subsystem is emptied, the subsystem is deemed to have failed completely, with consequences for the vehicle that range from inconsequential, to degradation of its capability, through to hull loss depending on the design of the vehicle and its vulnerability to failure of the subsystem in question.
A subsystem can have its HPs restored either through unscheduled maintenance activity (for instance if the number of HPs remaining is deemed to signal a possible threat to the vehicle’s integrity or readiness for subsequent missions) or during a scheduled overhaul. Using this formalism, HyPort is able to account for both the stochastic nature of the various activities to which the fleet might be subjected as well as for the more predictable elements of each process. This is done by defining the duration of any activity as
∆t=ρ+hi/r×NHP (1)
whereρis selected randomly with probability according to the PDF that is associated with the activity,hi/r
denotes the number of hours of maintenance per HP that is required to inspect or repair a given subsystem, andNHP is the number of health points that are to be restored during the activity. The number of HPs that are possessed by each subsystem at the beginning of a simulation can either be based on the design margins that have been predicted through preliminary design analysis (see Section IV) or can simply be assigned by the user.
Whenever an activity begins (at time tnow), its duration, ∆t, is computed as described above and the completion time for the activity is scheduled fortend=tnow+ ∆t. Once all the changes to the state of the
system associated with a particular activity have taken place at tend, the simulation then proceeds to the
Category Environmental Factors
Natural Weather-related constraints
[image:8.612.158.453.55.118.2]Work-related Number of working days a week, Daylight launch Random Micro-meteorite impact
Table 2: Some of the Environmental Factors (EFs) that are considered in HyPort.
II.D. Resources and Queue Modelling
In the HyPort model, a set of resources can be defined to represent the various elements of support, such as the Ground Facilities (GFs), Ground Support Vehicles (GSVs) or Ground Personnel (GPs) (technicians, operators, engineers, etc) that are required to carry out the various pre-defined activities on the vehicles within the fleet. Resources are defined by their capacity κ(the total number of Flight Elements that the resource can accommodate at a given time), and theirstatus, either busy (1) or idle (0). Aqueue(or waiting list) is associated with each resource. For the moment, only a simple First In First Out (FIFO) queue process model has been implemented. A Flight Element which requires the use of a particular resource to have an activity performed upon it can be inserted into the queue for the requested resource if the resource is not immediately available (i.e. if its status is ‘busy’). The resource becomes ‘idle’, and hence available, when the activity on the FE currently using that particular resource terminates and the next activity no longer requires use of the resource. In that case, the next FE in the queue is allocated the resource. Once all requisite resources are allocated, the next activity associated with that FE proceeds. The availability of Ground Facilities can cause bottlenecks within the system: a FE can only be moved from one GF to another if the GF required for the next activity is available for use, otherwise the current user of the facility is kept on hold until the situation changes.
A system of priority queues has also been implemented for use in various special or unique situations. For example, when a vehicle is about to take off, a check is first performed to detect if another vehicle is on approach to land – if so, then priority is then given to the landing vehicle. In a future development of the model, the priority queue might be extended to test the effect of various low-probability events on the behaviour of the system – for example, if a priority payload must be delivered into orbit, and the weather conditions are such that only one vehicle can be dispatched before the launch window closes, then the vehicle containing that payload might be moved to the head of the queue for takeoff.
II.E. Environmental Constraints
It is also possible to consider a range of Environmental Factors (EFs) in terms of their potential impact on operations. Three categories of EFs have been taken into account, namely Natural EFs (NEFs), Work-related EFs (WEFs) and Random EFs (REFs). Table 2 summarises the set of EFs that is currently implemented within HyPort, together with some examples of their practical manifestation.
The REF category is included in the model simply to capture any one of a number of random but significant events that might take place during vehicle operations. These events are assumed to occur with a pre-determined probability during the course of the simulation.
The Work-related EF category is used to capture procedural effects that might have significant impact on the operations of the space transportation service. For instance, the spaceport launch window may be restricted to daylight because of environmental or safety concerns, the number of hours the operators are allowed work might be limited, or maintenance activities may only be continued overnight under reduced staffing, and so on.
Finally, the NEF category is included in the model principally to capture the effects of the weather on operations from the spaceport. The methodology used in HyPort to evaluate the effects of local weather on operations is similar to that outlined by Altino et al.12 and is based on a statistical analysis of long-term
records of measured weather dataa at the actual location of the spaceport being simulated. As an example,
Fig. 2 compares the probability of rain and adverse weather conditions (such as thunderstorms, hail, heavy snow, overcast etc...) for spaceports located in Kourou (French Guiana) and at Prestwick Airport (Scotland). After defining a set of thresholds on the severity and scope of the meteorological conditions under which
Day of the Year
0 50 100 150 200 250 300 350
Likelihood of Rain [%]
0 5 10 15 20 25 30 35 40
Prestwick (UK) Kourou (FRG)
(a) - Rain
Day of the Year
0 50 100 150 200 250 300 350 Likelihood of Adverse Weather Conditions [%] 0
5 10 15 20 25
Kourou (FRG) Prestwick (UK)
[image:9.612.87.521.53.196.2](b) - Hazardous Conditions
Figure 2: A comparison of the likelihood of (a) rain and (b) other adverse weather conditions at Prestwick
Airport (Scotland, UK) and Kourou (French Guiana) based on real weather data from January 2005 to January 2015.
operations can still continue, the likelihood of a weather-related event causing a delay to operations can then be assessed. For instance if it is deemed that landing and takeoff can continue only if no thunderstorm is detected within a 20 km radius of the spaceport, takeoff can be allowed only if visibility is greater than 10 km and so on, then this information can be used to constrain operations from the spaceport. As implemented within HyPort, the weather for the day is predicted at the beginning of each day based on the probability of its occurrence. If then, for instance, a launch is scheduled to take place during a time interval that is constrained by a NEF, the activity may be postponed until the weather improves sufficiently for the NEF to no longer apply. In addition, weather-related EFs can be applied to processes other than takeoff and landing. For instance, a Launch Commit Criterion similar to that for the Space Shuttle, where “[cryogenic] propellant loading [...] shall not be initiated if the 24-hour average temperature for the preceding 24 hours has been below 5 degrees Celsius”13 can be applied to the re-fuelling process as implemented in HyPort.
III.
The Link between Operations and Vehicle Design
I
tshould be clear from the previous sections of the paper that many of the parameters within the HyPort model are very strongly influenced by the details of the design of the vehicles that comprise the SSTO fleet that is based at the spaceport that is being modelled. For instance, the quantification of the number of Health Points to be deducted from the TPS of any given vehicle after a mission relies on an accurate characterisation of the thermal environment to which the vehicle is exposed. This in turn requires the trajectory of the vehicle to be known. In the context of operations modelling, proper account must also be made for characteristics of the system which are essentially stochastic in nature, such as the possibility and likely influence of micrometeoroid impacts along the trajectory, the vagaries of the weather en route, and so on. This input to the model is provided by an automated Multi-disciplinary Design and Optimisation (MDO) platform2which, at its heart, relies upon a reduced-order aero-thermodynamic model for hypersonic vehicleanalysis, known as HyFlow.14 The HyFlow model is written in the same OOP framework as HyPort, and as
such is composed of several tightly-coupled subsystems models, which, when given a geometric description of the vehicle’s configuration, allow the aerodynamic and thermal loads on the vehicle to be determined and hence the vehicle’s likely performance to be predicted. The automated MDO platform within which the HyFlow model is encapsulated then proceeds to determine the best trajectory for the vehicle in order for it to achieve its pre-specified mission objectives, while concurrently optimising the performance of the propulsion system, determining the mass breakdown for the vehicle, sizing the active and passive thermal shields, and organising the vehicle’s internal configuration.
for realistic estimates of the margins on the likely performance of the vehicle to be provided for use in the HyPort operations model.
III.A. Physical Characterisation of Systems Inputs
As an example of the application of the HyFlow-based MDO formalism to quantifying the inputs to the HyPort model, consider the task of modelling the effects on the system if the performance of the thermal protection systems of the fleet of SSTO vehicles is allowed to deteriorate during the course of several missions into Earth orbit. As described earlier, the windward surface of any future re-usable space-access vehicle will, in all likelihood, be comprised of overlapping, sharp-cornered panels made out of materials that are resistant to the very high temperatures at which the vehicle will have to operate during certain parts of its mission to and from orbit. If it is assumed that degradation of the material from which the TPS is constructed takes place at a rate that is dependent on the temperature to which the material is exposed as well to as the properties of the material itself, then, in the formalism of HyPort, a certain number of health points will necessarily be lost by the TPS each time the vehicle flies. The actual number of points lost can be determined once the heating to which the vehicle is exposed along its trajectory is determined (using the HyFlow model described earlier), and these can be made up by performing the necessary maintenance on the vehicle once it returns to base.
Not all contributions to the degradation of the TPS are captured by this essentially deterministic view of the relevant physics, however. Indeed, the surface of any future re-usable space plane is unlikely to remain smooth for very long, especially when subjected to the rigours of operational service. It can easily be imagined that, under repeated use, these panels would be very likely to deform and shift relative to each other to yield a pattern of edges that protrude into the flow over the vehicle’s surface.15 The panels themselves
might also bow and deform temporarily under the aero-thermal loads of re-entry. Also, maintenance errors during the handling of the vehicle on the ground prior to launch would be very likely to result in localised, if minor, damage to the surface of the vehicle, and the vehicle might even have been allowed to take off with a damaged TPS having sustained micrometeoroid damage during a previous mission. All the asperities on the surface of the vehicle that result from these many sources have the potential to induce instability in the flow immediately adjacent to the vehicle’s surface (i.e. in the so-called ‘boundary layer’). Under certain conditions, particularly the high-altitude, high-speed conditions of re-entry, these instabilities can cause premature transition of the boundary layer from a laminar state to turbulence (for instance through the formation of so-called turbulent wedges or the process known as roughness-induced transition). Premature immersion in a turbulent flow could, in turn, lead to the surface of the vehicle downstream of the asperities being temporarily subjected to a more severe heating environment (and greater skin friction) than might otherwise be the case. Any increase in local surface temperature that results from this process could then act as a catalyst for the local degradation of the materials that comprise the underlying structure of the vehicle.
Quantification of the damage to the TPS as a result of premature turbulent transition is first of all reliant on knowledge of the distribution of asperities on the surface of the vehicle. Given the practical impossibility of modelling the system directly down to the level of detail which would allow the formation of individual asperities to be simulated, a statistical analysis is as best as can be achieved. Indeed, statistical analysis of the re-entry into the atmosphere of the Space Shuttle has shown that early transition (i.e. transition when travelling at speeds greater than Mach 10.9) occurred on 20% of flights, and that transition was asymmetric in 60% of those cases.16 Twelve percent of the shuttle flights suffered from the formation of a turbulent
wedge, the origin of which could not always be identified. For lower Mach numbers, the probability of asymmetric transition reduced to only about 10%, and its consequences for the temperatures experienced by the vehicle’s surface were significantly reduced. Using this information to guide the analysis within the HyFlow model described earlier, a random distribution of asperities over the surface of the vehicle can be generated (as illustrated for the CFASTT-1 vehicle2 shown in Fig. 3) and the effects of these asperities on promoting local turbulence, hence enhanced heat transfer and frictional load on parts of the vehicle, can then be determined.17 Then, using the same methodology as described before, the health points associated
with this essentially stochastic process can be extrapolated from the thermal loads and material properties and deducted from the affected regions of the TPS.
1366 1462 1508 1520 1804 1873 2019 2039 784 1458
[image:11.612.129.484.76.229.2]1 2 3 4 5 6 7 8 9 10
Figure 3: Locations of various simulated surface asperities that might be used to trigger the onset of
roughness-induced laminar-turbulent transition on the surface of the CFASTT-1 vehicle.
side of the vehicle with Tailorable Advanced Blanket Insulation (TABI) and the nose, leading edges of the wing and strakes tip with Advanced Carbon-Carbon material (ACC). Then, under the nominal conditions of a mission to low Earth orbit from an equatorial launch site, the model predicts the TPS to require about 24 hours of restorative maintenance after the vehicle returns to base. If the vehicle is unlucky enough to have roughness-induced transition occur on the forward fuselage strake (point 6 in Fig. 3) at 510 s after entry interface (i.e. with the vehicle travelling at about Mach 17), then an additional 23 hours will be required to carry out the subsequent inspection and repair activities once the vehicle has landed. Whether these figures are acceptable or not in terms of the economical operations of the fleet of SSTO vehicles becomes a question that can then be addressed once this information is fed into the HyPort simulation.
IV.
Scenario-Based Simulation
T
heHyPort S-DES model can be used to analyse the impact of early design decisions and various systemstrade-offs on both the operational performance and economics of an SSTO concept when embedded into a broader Multi-Disciplinary Design framework. Given the stochastic nature of the simulations, S-DES models such as HyPort are not only able to give estimates of operationally-pertinent metrics such as the average time for vehicle turnaround (as a function of time of year, for instance), mission duration, recurring cost per flight, as well as the total number of launches per calendar period, the average number of launches per year, the rate of vehicle loss, the number of both scheduled and unscheduled maintenance activities, the average depth of the queue per facility, and so on, but also an estimate of the variation of all these properties about their mean values. The advantage of being able to express these metrics in this way is that the data can be extrapolated and combined with the requisite financial information in order to yield, admittedly in very careful hands, not only a prognosis of the economics of the operation but also a characterisation of the likely risk to which its investors might be exposed. Tradeoff studies on the parameters of the model might then allow the major influences on the financial viability of the system to be exposed and, where possible, to be ameliorated or at least kept under close control.
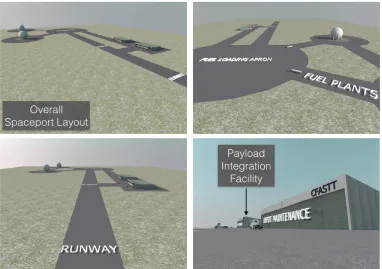
Figure 4: Layout of the spaceport and its various facilities.
Simulation # Parameters
1 : Facilities have unlimited capacity, all Activities have deterministic duration 2 : as #1 except all Activities have random duration
3 : as #1, but only one Runway and one Tank Servicing Facility
4 : as #3, also including Degradation of TPS, Loss of Vehicle and early BL transition 5 : as #3, also including Weather-Related Events (at Prestwick)
6 : as #3, also including Weather-Related Events (at Kourou)
Table 3: Summary of the various HyPort simulations described in Section IV.
Firstly, the model’s ability to characterise the impact of various restrictions on operations at the spaceport on the overall time necessary to complete vehicle turnaround operations has been quantified by varying several basic parameters such as the number of vehicles in the fleet, the capacity of the various facilities and the frequency with which routine maintenance and overhaul activities must be conducted on the vehicles.
The ability of the model to expose the link between vehicle design and operations is then explored by quantifying the effect of the natural degradation of the TPS, as described in Section III, on the operational metrics of the fleet. An important element of the approach is its ability to accommodate the occurrence of random (even low-probability) events within the analysis. Two such scenarios have been considered in the present work. The first is the possibility of catastrophic loss of one or more elements of the fleet (the probability of which is based on the overall reliability rate of the vehicle as composed from reliability data for its subsystems). The second is the more likely event that formation of an asperity on the surface of the vehicle during operation might lead to early transition of the boundary layer, exacerbate local heating on parts of the TPS, as described in Section III, and extend the vehicle turnaround time as result of the additional post-flight inspections and maintenance that is required to repair the resultant damage to the fabric of the vehicle.
[image:12.612.71.544.379.478.2]Activity Duration Minimum Maximum
[image:13.612.162.454.53.240.2]Install Payload 45 min 40 min 80 min Pre-flight Checks 20 min 18 min 25 min Tow to Take-off Apron 15 min 12 min 18 min Tank Servicing 90 min 80 min 110 min Take-off 2 min 1.9 min 2.4 min Ascent 15 min 14.8 min 17 min Payload Delivery 2 days 1.5 days 4 days Reentry 60 min 55 min 70 min Landing 10 min 9.5 min 12 min Tow to Hangar 30 min 25 min 35 min Post-flight Activities 1 day 0.9 days 1.5 days Overhaul 15 days 10 days 25 days
Table 4: Timeline of the various activities that are assumed to be carried out during the mission of the
CFASTT-1 SSTO vehicle.
the spaceport at Kourou in French Guyana, in other words in a tropical location near to the equator, and another with the spaceport located at Prestwick, Scotland, one of the five Northerly, perennially cold and weather-beaten sites currently being considered as potential sites for the United Kingdom’s own spaceport. A summary of the properties of these various simulations is presented in Table 3.
The timeline of the activities that are assumed to be carried out during a typical vehicle mission is summarised in Table 4, together with the expected duration of each activity. Minimum and maximum durations are also defined in order to associate the duration of each activity with a triangular probability distribution as discussed in Section II. The schedule of activities listed within this Table are inspired by the timeline for operations that is proposed in the Operator’s Manual for the Skylon SSTO vehicle.6 In this vein, the duration of the various tasks is held to be representative of those that a SSTO vehicle might have to achieve were it to be integrated successfully into an airliner-like operational model that is characterised by very quick turnaround time, at least in comparison to the standards that have been set by current space-access systems.
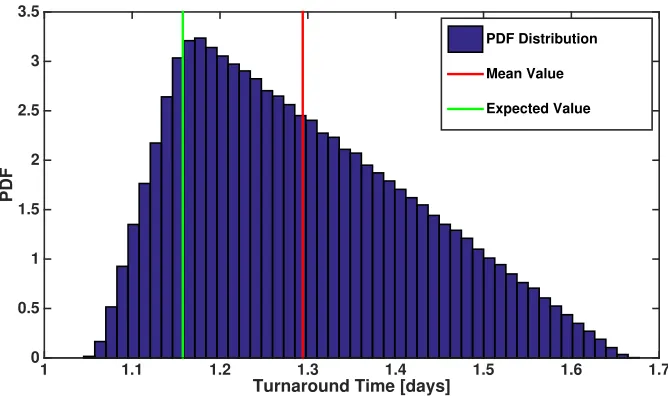
Simulations 1 and 2 (see Table 3) can be treated as the baseline cases, the results of which can be compared against those of the other simulations that have a more complex representation of the operations at the spaceport. The results for the overall turnaround time per vehicle at the spaceport, as predicted from these two simulations, are shown in Fig. 5, where a sample size of 10,000 missions has been used to build up an approximation to the PDF. The expected turnaround time (i.e. the result from the fully-deterministic Simulation 1) is about 28 hours, but the stochastic nature of Simulation 2 allows this simulation to reveal the useful additional insights that turnaround might, in practice, take anything from 25 hours to 40 hours, with a significantly greater mean than expected duration of about 31 hours.
The addition of constraints, in terms of the number of resources that are concurrently available to support operations from the spaceport, leads to queuing behaviour within the system. The results obtained for the turnaround time per vehicle during Simulation 3, where the spaceport is assumed to have only one runway and one refuelling area, is shown in Fig. 6. Indeed the similarity of the quantitative data for the bounds of the PDF to that obtained in Simulation 2 suggests that the spaceport, even though constrained in this case in terms of its number of facilities, still has large enough capacity to handle its resident fleet of SSTO vehicles. Nevertheless, occasional delays due to queuing, particularly in the propellant loading facility and in access to the runway do result in the PDF deviating to quite some extent from the simple triangular form that was obtained in the baseline case. The long tail of low-probability events stretching out to 25 days is a consequence of the inclusion in the simulation of the possibility of the occasional very long-term maintenance event that might remove a vehicle from the fleet entirely for a significant period of time.
Turnaround Time [days]
1 1.1 1.2 1.3 1.4 1.5 1.6 1.7
0 0.5 1 1.5 2 2.5 3 3.5
PDF Distribution
Mean Value
[image:14.612.137.471.53.251.2]Expected Value
Figure 5: Distribution of turnaround times when only variability in the length of each activity is accounted
for. The result of Simulation 1 is shown in green (the expected value) and the average turnaround time (from Simulation 2) is depicted in red.
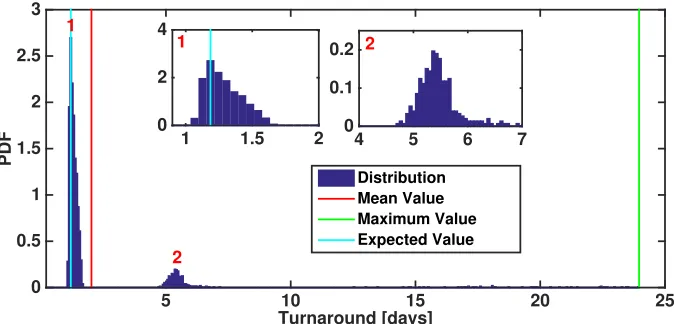
layer transition yields a prominent secondary peak to the PDF, however, and this can be interpreted to mean that the most likely turnaround time for the vehicles within the fleet, even in the presence of this particular damage mechanism, still lies between 20 and 40 hours, but that a turnaround time of closer to 5.5 days is also quite reasonably likely.
Finally, Figs. 9 and 10 show the distribution of turnaround times that is obtained if the consequences on operations of the variability in the weather conditions at the location of the spaceport is taken into account. Taking inspiration from NASA’s Space Shuttle Weather Launch Commit Criteria document,13a number of
operationally-pertinent weather-related constraints have been incorporated into Simulations 5 and 6 to reveal some of these effects. Firstly it is required that, prior to filling the internal tanks of any one of the vehicles in the SSTO fleet with cryogenic propellant, the predicted 24-hour average temperature for the day of launch should not be below 5 degrees Celsius, and, secondly, the temperature the day previous to launch should also not have fallen below 0.5 degrees Celsius. If these two conditions are met, then tank servicing activity can be conducted on the vehicles. If not, loading of propellant into the internal tankage of the vehicles is suspended for the day. Additionally, the temperature on the ground is monitored after tank servicing has taken place. If the temperature exceeds 37 degrees Celsius for more than 30 consecutive minutes before launch, then propellant loading activity on the affected vehicle is postponed. If necessary, launch is also rescheduled to 30 minutes after the cessation of adverse weather-related events such as thunderstorms or hail showers. The prognosis for launch from Prestwick and from Kourou during the last ten years, based on these criteria, is shown in Fig. 8. The resultant PDFs of turnaround time predicted by HyPort are shown in Fig. 9 for Kourou and Fig. 10 for Prestwick. These figures again show the typical triangular PDF associated with the underlying mathematical form that was assumed for the PDFs of the individual operations that comprise the simulations, but this observation should not detract from the fact that inclusion of the influences of the weather causes the simulations to predict quite a significant quantitative difference between the characteristics of the operations at the two different sites.
Turnaround [days]
0 5 10 15 20 25
0 0.5 1 1.5 2 2.5 3 3.5 4
Distribution Mean Value Maximum Value Expected Value
1 1.2 1.4 1.6
[image:15.612.135.472.63.224.2]0 1 2 3 4
Figure 6: Distribution of turnaround times when available resources at the spaceport are constrained. The
maximum value is shown in green, the expected value is shown in cyan and the average turnaround time is depicted in red.
Turnaround [days]
5 10 15 20 25
0 0.5 1 1.5 2 2.5 3
Distribution Mean Value Maximum Value Expected Value
1 1.5 2
0 2 4
4 5 6 7
0 0.1 0.2 2
2 1
1
Figure 7: Distribution of turnaround times when vehicle design considerations are factored into the
space-port operations. The maximum value is shown in green, the expected value is shown in cyan and the average turnaround time is depicted in red.
V.
Conclusions
[image:15.612.135.472.289.451.2]Time [days]
0 500 1000 1500 2000 2500 3000 3500
Temperature [C]
-5 0 5 10 15 20 25
30 5 C limit for fueling
Temperature
T 24hrs T
24hrs < 5 C
Adverse Weather Conditions
(a) - Prestwick Airport, Scotland.
Time [days]
0 500 1000 1500 2000 2500 3000 3500
Temperature [C]
0 5 10 15 20 25 30 35 40
5 C limit Temperature T
24hrs 37 C limit
Adverse Weather Conditions Occurrences
[image:16.612.119.486.143.567.2](b) - Kourou, French Guiana
Figure 8: Weather-based criteria for Prestwick Airport and Kourou over the last ten years as modelled
Turnaround [days]
0 5 10 15 20 25
0 0.5 1 1.5 2 2.5 3 3.5
Distribution Mean Value
Maximum Value Expected Value
1 1.2 1.4 1.6 1.8
[image:17.612.135.472.62.224.2]0 0.5 1 1.5 2 2.5 3 3.5
Figure 9: Distribution of turnaround times when variability in the weather conditions at the location of
the spaceport in Kourou are factored into the spaceport operations. The maximum value is shown in green, the expected value is shown in cyan and the average turnaround time is depicted in red.
Turnaround [days]
0 5 10 15 20 25 30 35 40
0 0.5 1 1.5 2 2.5 3
Distribution Mean Value Maximum Value Expected Value
0.9 2 4 6
0 0.5 1 1.5 2 2.5 3
Figure 10: Distribution of turnaround times when variability in the weather conditions at the location
of the spaceport in Prestwick are factored into the spaceport operations. The maximum value is shown in green, the expected value is shown in cyan and the average turnaround time is depicted in red.
paradigm that lies at the heart of an economical future such system, or whether significant additional work is instead required in terms of systems performance, reliability and safety before the dream can be realised of a safe, scheduled and reliable means of extending the reach of the human species beyond the bounds of its own planet.
References
1Glass, D.E., Ceramic Matrix Composite (CMC) Thermal Protection Systems (TPS) and Hot Structures for Hypersonic Vehicles,
15th AIAA Space Planes and Hypersonic Systems and Technologies Conference, Dayton OH, 28 April - 1 May 2008.
2Wuilbercq, R., Pescetelli, F., Mogavero, A., Minisci, E., and Brown, R. E., “Robust multi-disciplinary design and optimisation
of a re-usable launch vehicle,”19TH AIAA International Space Planes and Hypersonic Systems and Technologies Conference, Atlanta, Georgia, United States, 2014.
3Rhodes, R.E., Walker, S.W., Evaluation of Ice and Frost Accumulation on the Space Shuttle External Tank.
4Norris, G., “Aerojet Unveils TriJet For Reusable Hypersonic Power,” Aviation Week & Space Technology, Jun 13, 2011. 5Reeves, J. D., Olds, J. R., “Discrete Event Simulation of re-usable Launch Vehicle Ground Operations (RLVSim),” AE8900 MS
Special Problems Report, Georgia Institute of Technology, US, 30 July 2004.
6Hempsell, M., and Longstaff, R.,The Skylon Users’ Manual, Reaction Engines Limited, 2010.
[image:17.612.136.471.291.452.2]Simulation [#]
1 2 3 4 5 6
Value
0 0.5 1 1.5 2 2.5
Average Turnaround Time [days]
[image:18.612.136.471.60.223.2]Flight Rate [Flights/Day]
Figure 11: Summary of predicted average turnaround time and flight rate for each of the simulations
summarised in Table 3.
Accessed March 18, 2015, launiusr.wordpress.com, 2012.
8Butrica, A. J.,re-usable Launch Vehicles or Expandable Launch Vehicles? A Perennial Debate. In: Dick, S. J., Launius, R. D., Critical Issues in the History of Spaceflight, pp. 301-341, 2006.
9DePasquale, D., Kelly, M., Charania, A.C., and Olds, J. R., “Activity-Based Simulation of Future Launch Vehicle
GroundOp-erations,” AIAA SPACE 2008 Conference and Exposition, San Diego, CA, 9-11 September 2008.
10Ruiz-Torres, A. J., and Zapata, E., “Simulation Based Operational Analysis of Future Space Transportation Systems,”
Pro-ceedings of the 2000 Winter Simulation Conference, 2000.
11Staton, E., Cates, G., Finn, R., Altino, K. M., Burns, K. L., and Michael D. Watson, “Use of DES Modeling for Determining
Launch Availability for SLS,”SpaceOps 2014 Conference, Pasadena, CA, 5-9 May 2014.
12Altino, K. M., Burns, K. L, Barbre, R. E, and Leahy, F. B., “Analyzing the Impacts of Natural Environments on Launch and
Landing Availability for NASA’s Exploration Systems Development Programs,”SpaceOps 2014 Conference, Pasadena, CA, 5-9 May 2014.
13Space Shuttle Weather Launch Commit Criteria and KSC End of Mission Weather Landing Criteria, National Aeronautics and
Space Administration, Kennedy Space Center, FL.
14Wuilbercq, R., Brown, R. E., “Rapid Aero-Thermodynamic Analysis for Hypersonic Air Vehicles,”8th European Symposium on Aero-thermodynamics for Space Vehicles, Lisbon, Portugal, March 2015.
15Reda, D. C., “Review and Synthesis of Roughness-Dominated Transition Correlations for Re-entry Applications,”Journal of Spacecraft and Rockets, Vol. 39, No. 2, pp. 161-167, 2002.
16Hale, N. W. Jr., Lamotte, N. O., and Garner, T. W., “Operational Experience with Hypersonic Flight of the Space Shuttle,”11th AIAA/AAAF International Space Planes and Hypersonic Systems and Technology Conference, Orleans, France, 29 September - 4 October 2002. 49.
17Wuilbercq, R., Pescetelli, F., Minisci, E., and Brown, R., “Influence of boundary layer transition on the trajectory optimisation