Relevance in Technicolor
Ulises Cervi˜no Beresi1
, Yunhyong Kim1
, Dawei Song1
, Ian Ruthven2 , and Mark Baillie2
1 The Robert Gordon University, School of Computing
2 The Strathclyde University, Department of Computer and Information Sciences
Abstract. In this article we propose the concept of relevance criteria
profiles, which provide a global view of user behaviour in judging the rel-evance of retrieved information. We further propose a plotting technique which provides a session based overview of the relevance judgement pro-cesses interlaced with interactions that allow the researcher to visualise and quickly detect emerging patterns in both interactions and relevance criteria usage. We discuss by example, using data from a user study con-ducted between the months of January and August of 2008, how these tools support the better understanding of task based user valuation of documents that is likely to lead to recommendations for improving end-user services in digital libraries.
1
Introduction
Faced with the decision of whether or not to retain a piece of information in their personal collection, individuals engage in gauging the value of a document. This is distinct from a binary judgement regarding whether the document is relevant or not relevant. The situation is akin to the valuation process used by an antique dealer in assessing the value of a artefact: several criteria are employed to determine the object value, e.g. in terms of date, rarity, popularity, and condition of the object. Likewise, the qualitative or pragmatic value of a document is determined by a number of criteria, e.g. currency, novelty, validity and clarity. The consideration of these criteria results in an overall estimate of the document’s usefulness within the context of user tasks. The criteria employed, although clearly related to metadata elements employed within libraries (e.g. Dublin Core Metadata Elements http://dublincore.org/documents/dces/), as well as the topicality of the document, do not map directly onto either of these. By studying the way in which information searchers and seekers utilise and weight these criteria, we hope to bridge the gap between human information valuation behaviour, and implementations of information retrieval (IR) engines and library end-user services.
the use of simulated work task situations; descriptions of a situation in which needs for information are triggered on users. This gathered data allows the ex-perimenter to analyse not only final results such as number of relevant objects retrieved but also the processes that led to judgements of relevance. The anal-ysis of the performance data gathered is usually done through the examination of the relevant metrics such as Precision and/or Recall [5], however analysing cognitive data such as the thought processes that led to the user-valuations of the documentation retrieved –relevance processes as we call them – may not be as straightforward.
In this article we propose a custom plotting technique which provides a novel approach to analysing both the relevance and interaction information gathered using Borlund’s method. This approach involves customised visualisation tech-niques as well as the usage of protocol analysis. Qualitative data such as verbal reports are transformed into quantitative data using protocol analysis techniques which include transcriptions, segmentation and tagging of the segmented tran-scriptions. Once tagged, the segments can be analysed using standard quantita-tive measures. A quick overview of the potentially emerging patterns is obtained using a custom plotting of the data. This plotting includes information about the dimensions of relevance, the sequence of relevance judgement processes and the interactions observed during the search sessions.
The remainder of the article is structured as follows. In Section 2 we in-troduce Barry and Schamber’s relevance criteria classes[2]. Section 3 describes think-aloud protocols and their processing. The main contribution of this work, namely relevance criteria profiles and session visualisations, are introduced and discussed in Section 4. In Section 6 we explore the data obtained from a user study conducted during the first half of 2008 using the techniques described in the previous section. We conclude with some final remarks and recommendations for future work in Section 7.
2
Relevance Criteria
Relevance judgements are often reduced to being binary judgements, or graded assessment, of relevance at best (cf. dicussions in [3]) providing no explanation to why the value was assigned. It could be that while a user considers one document to be relevant based on the length and depth of the information provided, s/he considers another document relevant based on it providing factual data and it being well written. In this paper, we focus on some of the reasons that might motivate relevance judgements.
Borlund in the method of evaluation for Interactive IR (IIR) systems presented in [4].
Relevance criteria are preferences expressed by users when evaluating whether to obtain and use information, i.e. when they are evaluating the rel-evance of said information. Barry and Schamber suggest that there is“evidence that a finite range of [relevance] criteria exists and that these criteria are applied consistently across types of information users, problem situations, and source
en-vironments”[2]. The starting point they suggest for examining relevance criteria
consists the overlap of taxonomies resulting from two studies[1, 11] on user rel-evance criteria. Both studies are similar in the methodologies used however the types of users, information sources and formats are quite different. In our work, we extend this overlap with some of the criteria appearing in Barry’s original taxonomy[1]. The extension includes three forms of information novelty, users’s background knowledge and their ability to understand the information. Some of the relevance criteria codes used are listed below:
– Depth/Scope/Specificity: whether the information is in depth or focused, has enough detail or is specific to the user’s needs. Also whether it provides a summary or overview or a sufficient variety or volume.
– Tangibility: whether the information relates to tangible issues, hard data/facts are included or information provided was proven.
– Affectiveness: whether the user shows an affective or emotional response when presented the information.
– Ability to Understand: user’s judgement that he/she will be able to under-stand information presented
– Document novelty: the extent to which the document itself is novel to the user
Here, we focus on profiling users and sessions with respect to their use of such relevance criteria in judging document relevance within the context of a task. We studied 21 subjects. These subjects were characterised by three types of affiliation (10 subjects from computing, 8 from information management, and 3 from pharmacy). Subjects were also grouped according to their levels of research experience (10 Ph.D. students, 7 researchers, and 4 senior researchers) and were assigned a task according to this level: writing a literature review for a thesis, framing the impact of a grant proposal, and preparing a keynote speech at a conference respectively.
3
Talk-aloud Protocols
Talk aloud protocols are based on the idea that talking aloud while solving a task provides a view of the thoughts as the task solving process is ongoing[6]. In an IR context using talk aloud protocols would provide a researcher with a raw view of the relevance judgement processes that users go through when searching for literature. By observing these processes, a researcher can examine them and in turn observe the relevance criteria within those processes.
After the verbal reports have been collected, they are transcribed and have to be segmented in utterance which are then to be encoded. The granularity of encoding performed on the utterances, if any, will depend on the researchers’ needs. In our work we initially encoded utterances using one or more labels from the following encoding:
– Interaction: any utterance that indicates the participant is performing an operation on/with the system or interacting with it, e.g. reading a document, clicking on a document surrogate, going back a page, etc.
– Intent: any mention of the participant’s intentions regarding the obtained information or regarding their actions, e.g. using a retrieved document to impress their supervisor or initiating a search in the hopes of finding a par-ticular type of information.
– Relevance Criteria: any mention of factors that may affect the participant’s choices regarding whether they are to keep or not a document, e.g. if the user picks the document because it is a survey.
Utterances encoded as interaction were further encoded according to the following listing:
– Navigation: user interacts with the system by navigating, e.g. closing a doc-ument window, going back a page, etc.
– Reads out loud: user interacts with the system by reading a portion of text out loud
and utterances tagged asrelevance criteriawere encoded using the taxonomy of relevance criteria described in Section 2.
4
Relevance Criteria Profiles
potentially anomalous search sessions. Other studies related to relevance crite-ria have mostly concentrated on qualitative investigations (e.g. [1, 11]) or simple statistics presented in tables (e.g. [12]). Our method, in contrast, aims to pro-vide a more comprehensive view of citeria usage that will highlight patterns with respect to users and sessions.
Coded utterances are grouped at the session level and counted; all mentions of a particular relevance criterion within the search session contribute to a single count for that criterion. For any one participant there is what we define a “rele-vance criteria profile”. A rele“rele-vance criteria profile is the grouping of the mentions of the relevance criteria during the search session. A typical relevance criteria profile, visualised as a chart, looks like Figure 2. These profiles provide a global view of the number of times that each criterion has occurred during the search session for each participant. To make the numbers comparable across profiles, we normalise the counts within each profile by dividing by the sum of all criteria mentions: i.e.
rc′
i=
rci
PN
j=0rcj
(1)
where rc′
i is the new, normalised, count for relevance criterion i, rci is the
count for relevance criterioniandNis the total number of relevance criteria (in this articleN = 15).
Aggregating profiles, for instance by participant’s affiliation or research ex-perience does not require any special processing. Criterion counts are added by restricting the sums and counts to the group for which the profile is being created.
Profiles can be further compared by using the Jensen-Shannon (JS) diver-gence measure [9] for comparing profiles as it is based on the Kullback-Liebler[8] divergence but is symmetric. The JS divergence considers the KL divergence be-tween pandq under the assumption that if they are similar to each other they should both be “close” to their average. As the JS divergence is based on the KL divergence, the smaller the divergence the more similar the two profiles are. Nor-malised relevance criteria profiles satisfy the properties of discrete probability functions so they can be compared using this divergence measure.
5
Session Visualisation
As a complement to global relevance profiles we designed a technique for vi-sualising search sessions. Graphs resulting from applying our technique include information on the order of occurrence of the relevance criteria observed during a search session and the recorded interactions (if there were any).
With relevance criteria piles we model relevance judgement processes. As long as relevance criteria are observed together one after the other with no other utterances of a different type in between, e.g. interactions, we consider them to be part of the same relevance judgement process. Interactions are plotted in between relevance criteria piles.
To plot a search session first we group the tagged utterances in relevance cri-teria groups. For each group, we plot the first relevance criterion in the sequence at the bottom of the pile, the second on top of it one unit to the right and so on. Blocks are made as long as need be so that the final shape of the pile resembles a staircase. An example graph can be seen in Figure 1. In this graph there are two interactions to the left and one to the right of the relevance pile which are plotted asN to denote anavigation interaction.
Fig. 1.An example with three relevance criteria and interactions plotted.
There are assumptions behind the piles metaphor. First of all there is the assumption of aggregation. When a relevance criterion has been observed we assume that this criterion will apply all the way until the user has made a final judgement. The application of criteria is done sequentially until the user is able to make a judgement about the relevance of the information. The length of each block in the graph symbolises this assumption. One of the consequences, should this assumption hold true, is that the sequence in which criteria are used matters and that there might be a degree of relationship between relevance criteria. Users might follow a pattern when using relevance criteria. By using piles we can start analysing whether a user’s relevance judgement process exhibits these dependen-cies between relevance criteria. We also assume that each criterion contributes, either negatively or positively, to a final judgement. Negative contribution are represented as a minus sign next to the block in the graph.
to a certain extent since the dynamics of the session might become more vis-ible. Gathering click-through data and using it to better delimit the relevance judgement processes might also alleviate this situation.
Plotting sessions using our technique allows a researcher to investigate the relative strength, or importance, of a relevance criterion. In Figure 1 we see that one of the three criteria mentioned has a negative sign next to it. This represents situations in which the user expressed a relevance criterion in a negative way, e.g. “this is too old, it’s from back in the 60’s”. In the example the criterion has been mentioned in a negative fashion, yet the judgement process continues. This may suggest that its strength, relative to the overall judgement process, is not as strong as to end it right there and then. The explanations can be varied, however the point is that researchers can direct their attention to further investigate these scenarios.
Choosing a Colour Sequence According to Ware[13] the effectiveness of coding using colours for coding is degraded as more categories are added. Ware recommends 12 colours which are normally used when labelling using colours. The first six colours, which also correspond to the basic colours in the colour opponent theory[7], are: white, black, red, green, yellow and blue. The remaining six colours are: pink, grey, brown, magenta, orange and purple.
Taking the colours as an ordered sequence of recommendations, we use the number of occurrences of relevance criteria, in an aggregated profile, as indices to select an appropriate colour. The most occurring relevance criteria is then assigned the first colour in the sequence, the second most occurring criterion the second colour in the sequence and so on. The rationale behind this procedure is that, since aggregated profiles are obtained by averaging across users, higher rel-evance criteria counts mean that users have mentioned the criterion, on average, more often hence it is likelier to be observed in any one search session. Choosing the most contrasting colours for the most commonly occurring relevance criteria should make easier the visual detection of the different criteria.
6
Results
In this section we present and discuss data obtained from a user study carried out from January to August of 2008. A total number of 21 people accepted the invitation to participate in the study. All users were research scientists and were affiliated to one of three groups: the School of Computing, the Information Management Group and the School of Pharmacy. The main characteristic of the search task given to users was that it required them to search outside their research field for literature related to their own area of research.
6.1 Comparing Relevance Profiles
are the most mentioned criteria. Relevance criteria profiles can be plotted to-gether however before doing so they have to be normalised as described in Section 4. In Figure 3 the profiles of the three schools are plotted together. By plotting the profiles together we can quickly see similarities and differences. In the figure we see that while participants from the School of Computing have a distinguish-able preference for tangible data, members of the other two schools prefer other aspects of the information such as its depth, scope and specificity. Furthermore, we can also observe that members from all three schools share the same interest (in terms of proportions) for the novelty of the documents found.
Depth/Scope/Specificity Accuracy/Validity
Clarity Currency
Tangibility
Quality of Sources
Accessibility Availability Verification Affectiveness
Background/Experience Ability to understand
Content novelty Source novelty Document novelty
0 0.1 0.2 0.3 0.4
[image:8.612.214.403.203.336.2]Global
Fig. 2.Global aggregated relevance profile
Depth/Scope/Specificity Accuracy/Validity
Clarity Currency
Tangibility
Quality of Sources
Accessibility Availability Verification Affectiveness
Background/Experience Ability to understand
Content novelty Source novelty Document novelty
0 0.1 0.2 0.3 0.4
0.5
School of Computing Information Management Group School of Pharmacy
Fig. 3.The school profiles plotted together.
[image:8.612.216.401.404.543.2]The JS divergences between each individual profile and the other profiles are depicted as a matrix in Figure 4.
5 10 15 20
5 10 15 20 (a) 0.0 0.1 0.2 0.3 0.4 0.5 0.6 0.7
5 10 15 20
5 10 15 20 (b) 0.0 0.1 0.2 0.3 0.4 0.5 0.6 0.7
5 10 15 20
5 10 15 20 (c) 0.0 0.1 0.2 0.3 0.4 0.5 0.6 0.7
5 10 15 20
[image:9.612.191.436.131.330.2]5 10 15 20 (d) 0.0 0.1 0.2 0.3 0.4 0.5 0.6 0.7
Fig. 4. Jensen-Shannon divergence measure between all individual profiles and the
global profile.
to a certain extent, with almost every other profile. These profiles are those in rows 1,2,3,7 (members of the School of Computing) and 12 and 17 (members of the Information Management Group). That these profiles are convergent with most other profiles could be due to that the participants represented by these profiles follow a globally shared behaviour in using relevance criteria to judge the relevance of the information presented, however before confirming/rejecting this suggestion, a closer inspection to the search sessions should be conducted.
6.2 Plotting Sessions in Practice
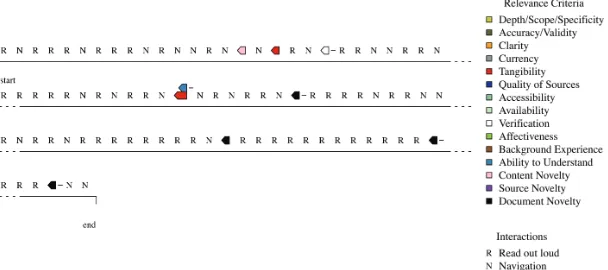
[image:10.612.157.461.306.441.2]A much quicker approach to confirming the anomalous behaviour of the diverging profile found in Figure 4 would have been to look at the visual representation of the participant’s search session. This visualisation is presented in Figure 5. At first sight it can be seen that the participant not only did not mention relevance criteria very often but also that the participant spent almost all of the session reading out loud. This could reflect a misunderstanding in the instructions for the study or simply that the participant did not find any documents that were even remotely interesting.
Fig. 5.The anatomy of an anomalous search session.
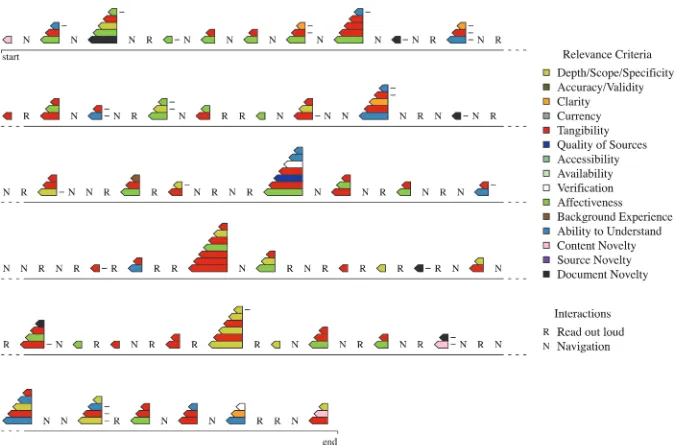
Fig. 6.A typical search session visualised using the piles metaphor.
This complements the global view presented by the relevance criteria profile (see Figure 3) which showed thattangibilitywas a commonly used criterion by partic-ipants from the School of Computing. During the participant’s session,tangibility
not only was a commonly used criterion, but also one that was present in most relevance judgement processes. Moreover, the criterion is present in relevance judgement processes of different complexities covering almost the full range.
7
Discussion
Relevance criteria are not theoretical concepts, but rather tangible and opera-tionalising them can potentially impact positively on search services. Operational estimations of the most observed criteria may be embedded in systems in an at-tempt to increase their performance in returning relevant information. If, and only if, we can measure them. Tangibility, may be approximated, for instance, by looking at the number of tables in a document, anddepth/scope/specificity, by looking at the number of pages in a document (document length has been mentioned frequently as a relevance criteria). Relevance processes, and the inter-twined interactions, may be used to model user search behaviours in an attempt to personalise and adapt the system to better accommodate the current infor-mation needs of users.
References
1. C.L. Barry. User-defined relevance criteria: an exploratory study. Journal of the American Society for Information Science, 45(3):149–159, 1994.
2. C.L. Barry and L. Schamber. Users’criteria for relevance evaluation: A cross-situational comparison.Information Processing and Management, 34(2-3):219–236, 1998.
3. Pia Borlund. The concept of relevance in IR. Journal of the American Society for Information Science and Technology, 54(10):913–925, 2003.
4. Pia Borlund. The IIR evaluation model: a framework for evaluation of interactive information retrieval systems. Information Research, 8(3):8–3, 2003.
5. CW Cleverdon, J. Mills, and EM Keen. Factors Determining the Performance of Indexing Systems, Vol. 1: Design, Vol. 2: Test Results. Aslib Cranfield Research Project, Cranfield, England, 1966.
6. K.A. Ericsson and H.A. Simon. Protocol analysis: verbal reports as data. MIT Press Cambridge, MA:, 1993.
7. Leo M. Hurvich and Dorothea Jameson. An opponent-process theory of color vision. Psychological Review, 64:384–404, 1957.
8. S. Kullback and R. A. Leibler. On information and sufficiency. Annals of Mathe-matical Statistics, 22:79–86, 1951.
9. Jianhua Lin. Divergence measures based on the shannon entropy. IEEE Transac-tions on Information theory, 37:145–151, 1991.
10. S. E. Robertson and M. M. Hancock-Beaulieu. On the evaluation of ir systems. Information Processing Management, 28(4):457–466, 1992.
11. L. Schamber. Users’criteria for evaluation in a multimedia environment. Proceed-ings of the 54 Annual Meeting of the American Society for Information Science, 28:126–133, 1991.
12. Peiling Wang and Marilyn Domas White. A cognitive model of document use during a research project. study ii. decisions at the reading and citing stages. Journal of the American Society of Information Sciences, 50(2):98–114, 1999. 13. C. Ware. Color sequences for univariate maps: Theory, experiments and principles.