1
Bank regulation, risk and return: Evidence from the credit and sovereign
debt crises
Hafiz Hoquea,*, Dimitris Andriosopoulosb, Kostas Andriosopoulosc, Raphael Douadyd
a
University of York, Freboys lane,YO10 5GD,York, United Kingdom
b
Strathclyde University, 100 Cathedral Street, G4 0LN, Glasgow, United Kingdom
c
ESCP Europe Business School,527 Finchley Road, NW3 7BG London, United Kingdom
d
CNRS, University Paris 1 Pantheon-Sorbonne, and Riskdata, France
Abstract
In this paper, we analyze whether regulation reduced risk during the credit crisis and the
sovereign debt crisis for a cross section of global banks. In this regard, we examine distance
to default (Laeven and Levine, 2008), systemic risk (Acharya et al., 2010), idiosyncratic risk,
and systematic risk. We employ World Bank survey data on regulations to test our
conjectures. We find that regulatory restrictions, official supervisory power, capital
stringency, along with private monitoring can explain bank risk in both crises. Additionally,
we find that deposit insurance schemes enhance moral hazard, as this encouraged banks to
take on more risk and perform poorly during the sovereign debt crisis. Finally, official
supervision and private monitoring explains the returns during both crisis periods.
Keywords: Distance to default, systemic risk, idiosyncratic risk, beta, buy-and-hold returns, regulations.
JEL classifications: E44, G2, G20, G28.
*Corresponding author: Tel.: +44 (0)1904325047.
E-mail addresses: hafiz.hoque@york.ac.uk (H. Hoque), d.andriosopoulos@strath.ac.uk (D. Andriosopoulos), kandriosopoulos@escpeurope.eu (K. Andriosopoulos),
2 1. Introduction
Journalists, policymakers, and academics have argued that lenient regulations, reliance on
short-term funding, excessive risk taking, and corporate governance failure are responsible
for the recent crisis. This paper examines the impact of regulations on the risk and returns of
global banks during the credit and sovereign debt crises. We examine an extensive sample of
large international banks that are the targets of current regulatory efforts while many of them
are considered to be too big to fail by central banks. These banks are characterized by their
large capitalization, global activity, cross-border exposure, and/or representative size in the
local industry. In this regard, we examine the determinants of distance to default (Laeven and
Levine, 2008), systemic risk (marginal expected shortfall [MES] proposed by Acharya et al.,
2010), idiosyncratic risk, and systematic risk.
There is scant literature examining the impact of bank regulations on bank fragility
and risk. Demirgüç-Kunt and Detragiache (2011) use the adherence to the core principles
from the Basel Committee on Bank Supervision and show that bank supervision and
regulation have very little effect on bank risk. Barth et al. (2004) use the World Bank survey
data II and show that countries with higher regulatory restrictions have a higher probability of
experiencing a banking crisis. Barth et al. (2013) show that banking restrictions are
negatively related to bank efficiency. To the best of our knowledge, no prior studies examine
the impact of World Bank regulations on bank risk and return during the recent credit and
sovereign debt crises. We fill this gap in the literature and take this opportunity to examine
the effectiveness of World Bank regulations in terms of bank risk taking and returns.
We use the 2008 World Bank survey on bank regulation data to examine whether
lenient regulations were responsible for excessive risk taking by the banks, which led them to
perform badly during the crisis (Stiglitz, 2010). The banking regulations survey contains 312
3
We form scores for measuring different dimensions and following Beltratti and Stultz (2012)
and Pasiouras et al. (2006), we classify the survey questions used into five categories: (1)
capital regulations; (2) restrictions on bank activities; (3) official supervisory power; (4)
private monitoring; and (5) deposit insurance. We test whether capital regulations,
restrictions on bank activities, official supervisory power, private monitoring, and deposit
insurance are related to risk and whether they affected the banks’ stock performance during
the credit and sovereign debt crises. We perform our tests on a number of different risk
measurements.
Our first measure of risk is the distance to default (log z), as in Laeven and Levine (2009). Log z measures the distance from bankruptcy (Roy, 1952). Since a large number of
banks went bankrupt following the credit and sovereign debt crises, it is imperative and
timely to examine whether regulations have any impact on global banks’ distance to default
risk during these periods of turmoil. Our second measure of risk is the systemic measure of
risk, MES. The use of individual banks’ contribution to systemic risk is relatively new and
allows us to test the effects of regulations during the credit and sovereign debt crisis. Most of
the earlier empirical work has examined the relationship between regulation and systemic
stability by using the incidence of banking crisis at the country level as a measure of systemic
risk (e.g., Demirgüç-Kunt and Detragiache, 2002). We examine the impact of regulation on
individual banks’ contribution to the overall systemic risk. Our third measure of risk is the
idiosyncratic risk of banks. Fahlenbrach et al. (2012) argue that banks have learned from
previous financial crises, leading banks to change their behavior and protect themselves from
a future financial crisis. In light of the regulatory changes that occurred after the credit crisis,
we assess whether banks changed their business models by taking risk more sensibly, as
4
estimated based on the market model. We also examine whether regulations impacted banks’
systematic risk during the credit and sovereign debt crisis.
Bank supervisors form their assessments on bank risk based on their proprietary
information. However, this information is accessed over infrequent intervals. Moreover, the
daily change of market variables reflects bank risk in a timelier manner, but does not fully
reflect all the information that is available to supervisors (Berger et al., 2000). Therefore, the
information on bank risk, which is inherent in equity market variables, can complement
supervisory assessment markets (Gunther et al., 2001; Hall et al., 2001; Elmer and Fissel,
2001; Curry et al., 2001).To assess whether the market variables explain risk, we include
buy-and-hold abnormal return (BHAR) calculated before the credit and sovereign debt
crises.1 Since return is the reward for taking risk, we evaluate the impact of regulations on
banks’ stock performance.
Our results show that restrictions, private monitoring, and deposit insurance explain
the distance to default during the credit crisis, while official power and private monitoring
had a consistent impact on banks during the sovereign debt crisis. However, we do not find
any evidence of deposit insurance having an impact. Following the credit crisis, official
supervisory power has a significant impact on banks’ distance to default. This suggests that
countries with higher official power could take the necessary corrective actions and
strengthen their banking system. Additionally, we find that deposit insurance explains the
distance to default during the credit crisis, but not in the sovereign debt crisis. We argue that
as sovereign states were affected during the sovereign debt crisis, they were unable to support
banks at the time. Hence, banks in countries with deposit insurance schemes have a higher
probability to default.
5
Regarding our second risk measurement (MES) we find that activity restrictions and
deposit insurance explain MES during the credit and the sovereign debt crisis. Capital
restrictions also explain MES but only during the sovereign debt crisis. This is due to the fact
that not only Tier I capital requirements have increased, but the quality requirements of
capital have also increased. After the credit crisis, there have been significant changes in
terms of capital adequacy and stress testing. We find that banks in countries with stricter
capital requirements have lower systemic risk contributions.
The results on the third risk measurement, idiosyncratic risk, show that with greater
official power and in the presence of deposit insurance schemes, banks take more risk
resulting in higher idiosyncratic risk during the credit crisis. However, official power is no
longer significant during the sovereign debt crisis. We argue that this could be due to the fact
that banks became significantly fragile and therefore, regulators could not exert benefits
anymore. Finally, we find a positive relationship between deposit insurance and idiosyncratic
risk during both crisis periods, reinforcing the view that deposit insurance increases moral
hazard.
We also examine whether regulations impacted banks’ systematic risk during the
credit and sovereign debt crisis. We find that higher official power results in banks having
higher systematic risk. This suggests that rent extraction by the regulators is also reflected by
market risk. Additionally, banks in countries with higher capital restrictions are more
protected in case of financial turmoil, and private monitoring prevents banks from taking
riskier decisions, as reflected by a lower systematic risk. These findings hold for both the
credit and sovereign debt crises. BHAR is significant in most of the risk regressions,
suggesting that market variables reflect bank risk in a timely manner. Hence, regulators
should complement their decisions with the information inherent in market variables. Our
6
The rest of the paper is organized as follows. In section 2, we develop the hypotheses.
In section 3, we perform a descriptive analysis of the credit and the sovereign debt crises.
Section 4 describes the variables used and employed methodology. Section 5 discusses the
data sources and descriptive statistics. Section 6 presents the results on the impact of
regulation on risk and returns during the credit and sovereign debt crises. In section 7, we
conduct robustness checks. The conclusions are in section 8.
2. Hypothesis development for testing the impact of regulations on bank risk and
returns
We take advantage of the 2008 World Bank survey on bank regulation data to examine
whether lenient regulations were responsible for excessive risk taking by the banks, which led
them to perform badly during the crisis. Following Beltratti and Stultz (2012) and Pasiouras
et al. (2006), we classify the survey questions used into five categories: (1) capital
regulations; (2) restrictions on bank activities; (3) official supervisory power; (4) private
monitoring; (5) deposit insurance. Since, excessive risk taking is primarily blamed for the
crisis (Beltratti and Stultz, 2012), in this section, we show that these five categories of
regulations can relate to the risk-taking behavior of the banks. Therefore, we focus on these
five categories of regulations to develop and test our hypotheses. Finally, due to the
conflicting theoretical predictions, it is an empirical question whether bank regulations have a
positive or negative impact on bank risk and returns.
2.1. Bank capital and capital regulation
Core (Tier I) capital is at the focal point of banking regulation, as it helps banks when
they face liquidity problems. Likewise, an index of regulatory capital oversight looks at the
quality of regulatory capital held by the banks. In this section, we pay attention at the quantity
7
reduce banking risk (Fernandez and González, 2005). We test the importance of capital
adequacy and respective capital-requirement regulations and how they can impact banks and
their tendency on risk taking and performance during the recent crises.
Bank regulations stress the benefits of capital adequacy requirements (Dewatripont
and Tirole, 1994), as adequate capital enables banks to absorb unexpected losses and thus
remain solvent. Likewise, banks with limited liability are less prone to assume more risk with
larger amounts of capital at risk. Berger et al. (1995) and Keeley and Furlong (1990) argue
that capital adequacy requirements along with deposit insurance can have a significant effect
on aligning the incentives of bank owners with those of depositors and other creditors.
However, theory offers contradictory predictions as to whether the imposition of
capital requirements will have positive effects (see Santos, 2001; Gorton and Winton, 2003).
A number of studies argue that capital requirements may increase risk-taking behavior
(Koehn and Santomero, 1980; Kim and Santomero, 1988; Besanko and Kanatas, 1996; and
Blum, 1999). Similarly, Thakor (1996) models the effect of risk-based capital requirements
on bank asset allocation decisions when screening borrowers is costly. Assuming that equity
capital is more expensive to raise than deposits, then an increase in risk-based capital
requirements reduces the banks’ tendency to screen investment opportunities and increase
their lending. Gorton and Winton (2000) show that in a general equilibrium framework, the
increase of capital requirements has an inverse impact on banks’ supply of deposits, hence
reducing the traditional liquidity-provision role of banks.
We use the recent credit and sovereign debt crises and address the theoretical
contradictions on capital adequacy requirements along with the shift on new risk-based
capital requirements in Basel II and III accords. We do so by examining the impact of capital
requirements, regarding Tier I capital, on bank risk and stock performance across countries.
8
index also includes indicators for capital sources, other than cash and government securities,
that are included in regulatory capital and whether authorities verify the source of capital.
During a crisis we expect the banks to benefit from higher capital requirements. Hence, our
first hypothesis is:
H1a: Higher capital requirements reduce bank risk during financial turmoil. H1b: Higher capital requirements increase banks’ stock returns during financial
turmoil.
2.2. Restrictions on Bank Activities
If banks are allowed to do a broad range of activities they might engage in risky
ventures that can be suboptimal for investors (Boyd et al., 1993). Restricting bank activities
means imposing restrictions on activities and securities banks may hold. Since bank assets are
opaque, during a financial turmoil the value of risky securities can decline significantly.
Limiting risky undertakings may decrease the financial losses given the opacity of bank
assets. However, the results of Barth et al. (2004) indicate the opposite: restricting bank
activities is negatively related to bank stability and increases the probability of a banking
crisis. Therefore, we examine the relationship between activity restrictions and risk taking
and returns during the recent financial and sovereign debt crises as it can assist in assessing
the effectiveness of restrictions.
According to Barth et al. (2004), the reasoning for restricting bank activities and
banking commerce rests on five hypothetical reasons. First, there can be significant conflicts
of interest if banks are involved in diverse activities such as securities and insurance
underwriting and real estate investment. For instance, banks may try to “push” securities of
troubled firms to uninformed investors (John et al., 1994; Saunders, 1985). Second, due to
moral hazard, if banks are allowed to diversify their operations and range of activities, they
9
1998). Third, the size and complexity of certain banks makes them difficult to monitor.
Fourth, such banks may become so politically and economically powerful that they become
“too big to discipline” (Laeven and Levine, 2007). Finally, large financial conglomerates can
stifle competition and reduce banking efficiency (Barth et al., 2013). Based on these
arguments, government supervision and regulation can improve banking by restricting bank
activities. Moreover, these arguments imply a negative relationship between activity
restrictiveness and bank risk and a positive relationship between return and activity
restrictions.
However, there are alternate theoretical reasons for permitting banks to engage in a
broader range of activities. For instance, less supervisory restriction will allow banks to better
utilize economies of scale and scope (Claessens and Klingebiel, 2000). Moreover, fewer
regulatory restrictions might increase the banks’ franchise value, thus increasing their
incentive to adopt prudent behavior. Finally, if banks are allowed to engage in a wider array
of activities, this will increase their income diversification, resulting in better stability. The
empirical evidence largely shows that restricting bank activities has adverse outcomes. In a
cross-country investigation, Barth et al. (2001) find that more regulatory restrictions on bank
actions are related to a higher probability of suffering a major banking crisis and lower
banking sector efficiency. Barth et al. (2004) find that restricting bank activities is not related
to less concentration, more competition, or greater securities market development. Barth et al.
(2013) find that tighter restrictions are negatively associated with bank efficiency. What is
more, bank restrictions can be designed in such a manner that they give regulators discretion
and thus enhance their bargaining power for rent seeking (Djankov et al., 2002). In summary,
there are contradicting views on the effects of activity restrictions, and therefore, we assess
empirically the effect of activity restrictions during the credit and sovereign debt crises on
10 H2a: Greater restrictions to banking activities reduce bank risk during financial
turmoil.
H2b: Greater restrictions to banking activities increase banks’ stock returns during financial turmoil.
2.3. Official Supervisory Power
Supervisory power can affect risk taking, and during turbulent times, supervisors
should be able to perform corrective actions. Stringent supervisory control can potentially
prevent managers from engaging in excessive risk-taking behavior. There are evidence (e.g.,
Fernandez and González, 2005) and contra evidence (e.g., Barth et al., 2004) on that issue.
Since we observe two crises with a short time lapse between them, and official supervisory
power is a core part of World Bank regulations, we examine whether risk taking depends on
monitoring and supervisory power.
It is costly and difficult to monitor banks and yet too little monitoring would lead to
suboptimal performance. Therefore, greater official supervision and monitoring can mitigate
this suboptimal performance (Beck et al., 2006). Moreover, banks can be susceptible to bank
runs and respective contagion due to information asymmetries. Supervision can reduce
information asymmetries and help protect banks from potential bank runs to a certain extent.
In addition, greater official supervision can help reduce the inherent moral hazard of deposit
insurance schemes - as deposit insurance can lead banks to take excessive risks - and at the
same time reduce the depositors’ incentives for privately monitoring the banks. In this regard,
supervisory power is expected to be positively associated with bank returns and negatively
associated with risk.
To the contrary, powerful supervisors may use their powers to benefit favored voters,
attract campaign donations, and extract bribes (Shleifer and Vishny, 1998; Djankov et al.,
11
corruption and hurting bank performance and stability. Kane (1990) and Boot and Thakor
(1993) focus on a different perspective, which is the agency costs between bank supervisors
and taxpayers. Rather than focusing on political influence, Boot and Thakor (1993) model the
behavior of a self-interested bank supervisor when there is uncertainty about the supervisor’s
ability to monitor banks. Under these settings, they show that supervisors might lead to
socially suboptimal arrangements. Thus, greater supervision can hinder bank operations when
conditional on bank supervisors’ incentives and the ability of taxpayers to monitor
supervision. As Beck et al. (2006) argue, if bank supervisory agencies have the authority to
discipline noncompliant banks, the supervisors might use this power to induce or force banks
to allocate credit so as to generate private or political benefits. As a consequence, supervisor
power might be negatively associated with bank returns and positively associated with risk.
During a crisis we expect banks to benefit from higher supervisory power. Our hypotheses on
supervisory power are stated as follows:
H3a: Greater supervisory power reduces bank risk during financial turmoil. H3b: Greater supervisory power increases banks’ stock returns during financial
turmoil. 2.4. Private monitoring
Apart from regulatory supervision and monitoring, shareholders can also monitor
banks’ operations and performance and influence their policy through investors’ monitoring
ability. Related to this market-based view of regulations where market reward good banks
and penalize bad ones, Fernandez and González (2005) find that regulations that promote and
assist private monitoring of banks increase banks’ financial soundness by reducing moral
hazard created by information asymmetries. Therefore, this section provides a discussion on
how private monitoring can substitute or complement regulators’ supervision and affect
12
Private monitoring can be motivated and enhanced by official bank supervisors. For
instance, Barth et al. (2006) find that some regulatory agencies require banks to obtain
certified audits and/or ratings from international rating agencies and to produce accurate,
comprehensive, and consolidated information on the full range of their activities and risk
management procedures. A set of countries also hold bank directors legally liable if
information is erroneous or misleading. Also, some countries enact deliberately a “no deposit
insurance” policy to stimulate private monitoring. Nevertheless, there are opposing views
regarding the role and impact of bank monitoring by the private sector. One view argues for
greater reliance on private monitoring and against official supervision. Shleifer and Vishny
(1998) argue, regarding government regulations, that banks will put pressure on politicians
who, in turn, can inappropriately exert influence on the supervisory oversight. Moreover,
regulators do not invest their own wealth in banks, resulting in a divergence of their
incentives, in terms of monitoring and disciplining banks, with those of private creditors.
In contrast, another view argues for less reliance on private monitoring. Countries
with under-developed capital markets and weak accounting standards and legal systems
might not be able to rely effectively on private monitoring. Moreover, the fact that banks are
complex and opaque institutions makes it difficult for private monitoring to keep up even in
the most developed economies. Therefore, a greater reliance on private monitoring of banks
may lead eventually to the exploitation of depositors and poor bank performance (Barth et al.,
2004). We explore the effect of these supervisory schemes on bank risk taking and
performance during the credit and sovereign debt crises. Our hypotheses are as follows:
H4a: Greater private monitoring reduces bank risk during financial turmoil. H4b: Greater private monitoring increases banks’ stock returns during financial
13 2.5 Deposit insurance
During the credit crisis deposit insurance schemes came in the limelight and are
considered as one of the tools in the regulators’ disposal for preventing the credit crisis from
spreading further in the financial services system. On the other hand, the moral hazard in
presence of deposit insurance induces banks to engage in excessive risk taking (Barth et al.,
2004) and Demirgüç-Kunt and Detragiache, 2002) Therefore, in this section, we discuss how
the presence of deposit insurance can affect risk taking and how it affects performance. The
effectiveness and role of deposit insurance can be evaluated once a crisis happens. Hence, we
examine the role of deposit insurance on risk taking by global banks during the credit and
sovereign debt crises.
In order to protect banks that experience liquidity problems but remain solvent,
countries adopt deposit insurance schemes in order to prevent bank runs. Since deposit
insurance can safeguard payment and credit systems overall, it enjoys a great number of
supporters. Starting with Merton (1977), a number of theoretical papers have studied the
relationship between deposit insurance and banking sector stability. This positive
stabilization effect of deposit insurance obviously has greater importance during economic
downturns when contagion is more likely to spread and bank runs are more likely to occur.
Consistent with this view, Gropp and Vesala (2004) show that the adoption of deposit
insurance is related to lower bank risk in the European Union. Similarly, Chernykh and Cole
(2011) show that the adoption of deposit insurance in Russia created safer banks. For US
credit unions, Karels and McClatchey (1999) find stabilization effects from the adoption of
deposit insurance. Anginer et al. (2013) find that bank risk is lower during a crisis in
countries with deposit insurance.
However, deposit insurance may have adverse consequences, as it may encourage
14
2004). There is also sizable agreement in the literature that deposit insurance enhances moral
hazard problems in the banking sector by incentivizing banks to take on excessive risk. When
deposits are insured, however, bank depositors lack incentives to monitor (Demirgüç-Kunt
and Huizinga, 2004; Ioannidou and Penas, 2010). The lack of market discipline leads to
excessive risk taking, culminating in banking crises. Anginer et al., (2013), Demirgüç-Kunt
and Detragiache (2002), Demirgüç-Kunt and Kane (2002), and Barth et al. (2004) find
evidence in support of this view. Nonetheless, there is the argument that regulation and
supervision can control the moral hazard problem by designing an appropriate insurance
scheme. Therefore, we examine the relationship of deposit insurance with banks’ returns and
risk. During a crisis we expect banks to benefit from the presence of deposit insurance
schemes. The hypotheses are stated as follows:
H5a: The presence of deposit insurance reduces bank risk during financial turmoil. H5b: The presence of deposit insurance increases banks’ stock returns during
financial turmoil.
3. A narrative of the credit and sovereign debt crises
Over the period 2000 to 2007, banking activities over the world experienced rapid
growth leading to an expansion of their balance sheets and therefore to an increase in their
risk appetite. For instance, banks increasingly via financial innovation expanded into foreign
currency assets such as US dollar-denominated claims, and European banks in particular
showed the largest growth in foreign claims. Even though the exposures to the respective
foreign currency claims were hedged off-balance sheet, this still led to an increase in funding
risk, in which European banks had substantial funding needs of $1.1 to $1.3 trillion USD by
mid-2007 (McGuire and von Peter, 2009). Similarly, Acharya and Schnabl (2009) argue that
the global imbalances do not offer a valid explanation as to why the financial crisis spread
15
account surplus and deficit countries had large exposures to asset-backed commercial paper
(ABCP) conduits (valued at $1.2 trillion USD of short-term ABCP outstanding in June of
2007) that caused the financial crisis to spread so rapidly in 2007. Acharya and Schnabl
(2009) also argue that it was the lax regulation monitoring the financial services industry that
contributed to the financial crisis of 2007.
When the financial crisis started to unfold in 2007, this funding risk became more
pronounced for banks, which had a significant impact in the markets such as FX and money
markets. Moreover, European banks required the support of central banks in dealing with this
associated risk until the end of September, 2008 (McGuire and von Peter, 2009). During
2008–09, there was limited concern regarding European sovereign debt, but the shockwaves
of the 2007 financial crisis triggered a reevaluation of asset prices, risk, and growth
prospects, especially in countries with economic imbalances (Lane, 2012). As shown in
Figure 1, there is a significant increase in the market valuations relative to GDP leading up to
the financial crisis. Once the financial crisis starts unfolding in 2007, there is a significant
decrease of market valuations relative to GDP. Accordingly, we use 2007–08 as the credit
crisis period to measure risk and stock returns. In 2009 and 2010, the markets are recovering
from the financial shock of 2007–08, when the sovereign debt crisis starts to take hold,
leading to further reduction in market valuations across the board. We use 2011 to measure
risk and return during the sovereign debt crisis. In 2012, though, there are signs of recovery,
and in both crises, there is a significant decrease in market valuations, due to reevaluations of
asset prices and factoring new potential risks (Lane, 2012), lasting more than a year and
followed by a recovery.
[Insert Figure 1 here]
Figures 2 and 3 show the evolution of total loans outstanding and the respective
16
countries and the US. The figures show that after 2004, the value of loans outstanding
experiences a significant increase, reaching their peak in 2007 when the financial crisis
erupts. Following the financial crisis, there is a small adjustment in the value of loans in 2008
and 2009, which increases again in 2010when the sovereign debt crisis starts. In the two
years that follow the sovereign debt crisis, there is a small downward readjustment in the
value of loans.
[Insert Figures 2 and 3 here]
After 2007, there is a constant growth in sovereign debt (Figure 4), resulting in a
significant and abrupt rise in the yields of sovereign debt bonds in a number of countries in
the European periphery. Following, there is a divergence for a number of European periphery
countries in terms of sovereign bond yield spreads, starting in early 2010. Lane and
Milesi-Ferretti (2012) find a relationship between high current account deficits over 2005–08 and
significant current account reversals and expenditures over 2008–10. Toward the end of
2009, there is an increase in the number of countries reporting large deficit-to-GDP ratios
(Lane, 2012). Hui and Chang (2011) show that CDS spreads rose significantly to almost 250
bps in February 2010, which they surpass in the spring of the same year.
[Insert Figure 4 here]
4. Variables used and methodology
4.1 Distance to default
We use log z, as introduced by Laeven and Levine (2009), to capture default risk. Log z, which measures the distance from bankruptcy (Roy, 1952), is estimated as the average
ROA plus the capital-to-asset ratio divided by the standard deviation of the ROA. A higher
z-score indicates lower bank risk. We use the natural logarithm of z-z-score in our regressions,
17
Laeven and Levine (2009) show that the impact of the capital stringency index on the
distance to default depends critically on the ownership structure. In widely held banks, a
marginal increase in capital stringency has little impact on bank distance to default, while
stronger capital stringency boosts bank risk when the bank has a powerful owner. The
evidence is consistent with the view that capital regulations increase the risk-taking
incentives of owners (Koehn and Santomero, 1980; Buser, Chen and Kane, 1981). In the
absence of a powerful owner the stringency of capital regulations has little marginal influence
on risk. Beltratti and Stultz (2012) assess the log of distance to default in the credit crisis and
report that banks with higher ownership by the controlling shareholder have a lower distance
to default. In addition, banks with a more shareholder-friendly board have a lower distance to
default. Finally, the index of capital regulation has a positive coefficient, while the current
account, the index of powers of the supervisors, the index of private monitoring, and the
deposit insurance variable all have a negative coefficient. Our focus in this paper is to assess
whether regulations are effective when a crisis hits the banking sector. We estimate the
following equation with log z calculated during the credit and the sovereign debt crises.
Log zi,j,crisisis log z for bank i, in country j during the credit and sovereign debt crises
respectively. We calculate log z as the average ROA plus the capital-to-asset ratio divided by the standard deviation of ROA. For estimating log z during the credit crisis, we use the capital-to-assets ratio in 2008 and for ROA we use the average return on assets during 1998-
2008 along with the standard deviation of ROA over the same period, as in Beltratti and Stutz
(2012). For the sovereign debt crisis, the capital-to-assets ratio is taken at 2011 and for ROA
we use the average return on assets during 2001-2011, along with the standard deviation of
ROA over the same period. Officiali,jis a score that reflects the power of the commercial
18
bank supervisory agency where banki is located in country j. Capitali,j is a score that reflects
the regulatory oversight of bank capital for bank i in country j. Restrict i,jis a score that
measures the regulatory restrictions on the activities of banks where banki is located in country j. Private monitoring i,jis a score that measures the degree of private monitoring
where bank i is located in country j. Deposit insurance i,jis a dummy variable equal to one
where there is explicit deposit insurance (Demirgüç-Kunt et al., 2007).
The explanatory regulation variables are retrieved from the World Bank3 as in Caprio
et al. (2007, revised in June 2008), The banking regulations survey contains 312 questions on
different dimensions, and most of the questions require yes/no types of answers. We form
scores for measuring different dimensions, which are called official, capital, restrict, and
private monitoring. All the bank-level and country-level controls are described in sections 4.6
and 4.7, respectively. Finally, we estimate equation (1) with ordinary least squares (OLS).
We ensure that multicollinearity is not present by checking the correlation matrix and by
estimating the variance inflation factor (VIF) following the estimation of our models.4
4.2 Marginal expected shortfall
The recent financial crisis has led to a reevaluation of risk taking and regulation of the
financial system, with a transformed interest in systemic fragility and macro prudential
regulation. This needs an effort to understand not only the risk of individual financial
institutions but an individual bank’s contribution to the risk of the financial system as a
whole. Therefore, from a regulatory viewpoint, there is an increasing agreement that in
safeguarding systemic stability, the link in the risk-taking behavior of banks is much more
important than the absolute level of risk taking in any individual institution. As an alternative
measure of bank-level risk, we compute a measure of each bank’s contribution to the system
3
This data set is taken from http://econ.worldbank.org/
4
19
as a whole. Our measure of marginal expected shortfall is based on the expected capital
shortfall framework, as in Acharya et al. (2012).
The systemic expected shortfall of an institution refers to the capital deficiency a
financial firm would face in case of a systemic event. It is based on the idea that a shortage of
capital is hazardous for the individual firm but becomes risky for the whole economy if it
happens just when the rest of the banking sector is also undercapitalized. This measure is
intended to capture how much each firm adds to the risk of the banking system as a whole.
The MES of a firm is the expected loss an equity investor in a financial firm would
experience if the market declined substantially. Following Acharya et al. (2010), we use MES
as our systemic risk measure. MES measures the average firm return on days when the
market as a whole is in the tail of its loss distribution:
) 2 )...( (
1
1
T
t
M t i t i
t R R
T MES
i t
R is the equity return of financial firm i, andRtM is the market index return. A
systemic event is defined as a drop of the market index below a threshold , over a given
time horizon. The systemic event is thus denoted by RtM<.We estimate the MES by
following Acharya et al. (2010) at a standard risk level of 5%, using daily data for equity
returns retrieved from DataStream. This means that we take the 5% worst days for the market
returns (RtM ) during the credit and sovereign debt crises and then compute the average return
on any given firm (Rti) for these days. Our main focus in this paper is whether regulations are
effective when a crisis hits the banking sector. We estimate the same equation using MES as
20
MESi,j,crisisis the marginal expected shortfall for bank i, in country j during the credit and
sovereign debt crises respectively. We calculate MES, using equation 2 above, for the credit
crisis from June 2007 to December 2008 to measure banks’ systemic risk, as in Fahlenbrach
et al. (2012) and Beltratti and Stulz, (2012). For the sovereign debt crisis, we calculate MES
from May 2011 to December 2011 to measure banks’ systemic risk during that period. In the
robustness section, we use two alternative time period to calculate systemic risk during the
sovereign debt crisis. Finally, we use the same explanatory variables and econometric
procedure as in section 4.1.
4.3 Idiosyncratic risk
We analyze idiosyncratic risk as a measure of business/operational risk of banks as in
Kane and Unal (1988) and Flannery and James (1984). Recently, after being hit by the
financial crisis, there was a significant increase in interest in idiosyncratic risks of banks. For
instance, Hoque (2013) reports a positive relationship between idiosyncratic risk and bank
capital during the credit crisis and a negative relationship during the sovereign debt crisis.
Beltratti and Stultz (2012) find a negative relationship between idiosyncratic risk and bank
capital and a positive relationship between ownership and idiosyncratic risk. Anginer et al.
(2013) show that deposit insurance is positively associated with risk taking in the pre-crisis
period and negatively associated with risk taking in the crisis period. Idiosyncratic is the idiosyncratic volatility, which is the annualized standard deviation from the market model
regression residuals that estimate beta. We assess whether regulations are effective when a
crisis hits the banking sector. We estimate the same equation twice using idiosyncratic risk as
21
Idiosyncratic riski,j,crisisis the annualized residual risk for bank i, in country j for the credit
and sovereign debt crises respectively. For the credit crisis, we calculate idiosyncratic risk
from the one-factor market model regression residuals by using banks’ stock returns and the
MSCI World Index returns, as a proxy for the market portfolio, over June 2007 to December
2008, as in Fahlenbrach et al. (2012) and Beltratti and Stulz (2012). For the sovereign debt
crisis, we calculate the idiosyncratic risk from the one factor market model regression
residuals by using banks’ stock returns and the MSCI World Index returns, as a proxy for the
market portfolio, from May 2011 to December 2011. In the robustness section, we use two
alternative time periods to calculate idiosyncratic risk during the sovereign debt crisis.
Finally, we use the same explanatory variables and econometric procedure as in section 4.1
4.4 Systematic risk
We analyze systematic risk as a measure of banks’ market risk, as in Kane and Unal
(1988) and Flannery and James (1984). A higher sensitivity of bank share prices with market
indices during both crises leads us to examine what factors drive market risk. Haq and
Heaney (2012) analyze the systematic risk of banks in European countries and find that
systematic risk is negatively related to bank capital, size, and charter value. Our systematic
risk measure, Beta, is the beta coefficient estimated based on the one-factor model (CAPM) by regressing individual banks’ stock returns against the MSCI World Index returns. We
analyze whether regulations affect systematic risk when a crisis hits the banking sector. We
estimate the same equation twice, using Beta as the left-hand side variable calculated during the credit crisis and the sovereign debt crisis.
22
Beta,i,j,crisis is the measure of systematic risk for bank i, in country j for the credit and
sovereign debt crises, respectively. For the credit crisis, we estimate beta by employing
one-factor market model regressions from June 2007 to December 2008, as in Fahlenbrach et al.,
(2012) and Beltratti and Stulz, 2012). For the sovereign debt crisis, we estimate beta by
employing one-factor market model regressions over May 2011 to December 2011 . We use
the MSCI World Index returns as the proxy for market returns. In the robustness section, we
use two alternative time period for estimating beta during the sovereign debt crisis. Finally,
we use the same explanatory variables and econometric procedure as in section 4.1.
4.5 Buy and hold abnormal returns (BHAR)
Since the late 1990’s, there has been a growing shift in the view of the importance of
market variables on the risk assessment of banks and how these variables can enhance
supervisory monitoring (Greenspan, 1998;Curry et al. 2001, 2003). Moreover, bank
supervisors assess a bank’s risk through their proprietary information gathered at infrequent
intervals. Berger et al. (2000) suggest that market data are not only informative but that they
can also contain information not yet incorporated into supervisors’ information, while market
data do not fully reflect all the information that is available to supervisors. Since market
variables contain information on firm risk reflected in the daily price changes, supervisory
assessment can be complemented via the equity markets (Gunther et al., 2001; Hall et al.,
2001; Elmer and Fissel, 2001; Curry et al., 2001). Krainer et al. (2001, 2003) also show that
cumulative abnormal returns are able to anticipate changes to banks’ risk captured by credit
ratings. Moreover, the authors argue that equity market variables add value to regulators’
assessment of banks and in a timely manner.
23
As in Krishnan et al. (2005), banks’ stock market performance contains
supplementary information regarding banks’ risk, which is also reflected in a timely manner.
Based on the learning hypothesis, banks that learn from a past bad experience will adjust their
risk attitude (Fahlenbrach et al., 2012). In turn, the shift in banks’ risk attitude should be
reflected in their stock performance. Therefore, as in Belttrati and Stulz (2012) and
Fahlenbrach et al. (2012), we estimate banks’ buy-and-hold abnormal returns to assess what
drives their performance and whether supervision regulations and any capital measures affect
banks’ risk as reflected in their stock price.
To measure stock market performance, we calculate the BHAR following Beltratti
and Stulz (2012), as follows:
)
6
.(
)...
1
(
)
1
(
1 , , 1 , , , ,
T t crisis t M T t crisis j i crisis ji
R
R
BHAR
Where BHARi,j,crisisis the buy-and-hold abnormal return for bank i in country j during
a crisis period, Ri,j,crisis is the daily return of bank i in country j, and RM,j,crisis is the daily return
on the market proxied by the MSCI World Index return. Then, we estimate the following
equation twice, using BHAR as the left hand side variable calculated during the credit and
sovereign debt crises.
) 7 ...( Pr Re , , 1 , , , 5 , 4 , 3 , 2 , 1 , , t j i t j i j i j i j i j i j i Crisis j i controls Country and Bank urance DepositIns ivate strict Capital Offical BHAR
We calculate BHAR from June 2007 to December 2008 to measure banks’ share price
performance. Even though the credit crisis did not officially end at the end of 2008, since it
continued through the first few months in 2009, the fall in share prices at the beginning of
2009 may have been partly due to bank rescues. Moreover, we use December 31, 2008, as a
24
We calculate the BHAR from May 2011 to December 2011 to measure banks’ share price
performance during the sovereign debt crisis. In the robustness section, we use two
alternative period definitions to calculate risk and return during the sovereign debt crisis. We
use the same explanatory variables and econometric procedure as in section 4.1.
4.6. Bank-level controls
To understand the importance of bank capital during times of turmoil, we use Tier I
capital, which is a measure of capital adequacy, following Laeven and Levine (2009), and
which was more relevant during the crisis, according to Demirgüç-Kunt et al. (2010). Tier 1
capital is defined as shareholder funds plus perpetual noncumulative preference shares
relative to risk-weighted assets and off-balance sheet risks, measured under the Basel
rules. This figure is expressed as a percentage and should be at least 4%. Banks with greater
quality capital are more able to absorb losses during financial turmoil (Beltratti and Stultz,
2012). Therefore, investors attach great importance to a bank’s capital quality, and we expect
a positive relationship between bank capital and risk.
To shed light on the impact of liability structures, we use deposits, defined as total deposits relative to total assets (Anginer et al., 2013). With explicit deposit insurance in
place, deposit financing is not subject to runs. However, other money market-related funding
is subject to runs (Adrian and Shin, 2010; Gorton, 2010) and dries up during crisis times.
Therefore, we use funding fragility, introduced by Demirgüç-Kunt and Huizinga (2010), defined as the ratio of deposits from other banks, other deposits, and short-term borrowing to
total deposits plus money market and short-term funding. We expect banks with more
deposits and less funding fragility to take more risk.
To capture the asset side of the balance sheet, we use several measures. The major
25
commercial loans, and other loans minus reserve against possible losses on impaired or
nonperforming loans. Banks with more loans on their books are more likely to have relatively
lower exposure to off-balance sheet securities (e.g., derivatives), and thus run a lower risk
with the widening of the credit spreads during a crisis (Beltratti and Stultz, 2012). Therefore,
banks with higher loans rather than risky securities should perform better, ceteris paribus. However, because we do not have the composition of loans as such, we do not have an
expectation of the sign of loans. Following Laeven and Levine (2009), we use liquidity, defined as liquid assets scaled by total assets. As banks with more liquid assets are expected to perform better during a crisis, we expect a positive relationship between liquidity and stock
performance.
To capture the income statement exposure, we use income diversity. Banks that derive their income from diverse activities have less exposure during a crisis. We use income
diversity, by following Laeven and Levine (2008), defined as the absolute value of difference
between net interest income and other operating income divided by total operating income.
4.7. Country-level governance and macroeconomic variables
We include macroeconomic variables as additional controls. For instance, countries with a higher level of financial development and economic fundamentals might have different
risk and returns. To control for country-level development, we use the gross domestic product
(GDP) per capita at 2006 constant terms, as in Anginer et al. (2013). To control for the financial position of the country, we use current account balance, as in Klomp and Haan
(2012). Current acc. bal. is the current account balance divided by GDP. To control for level of market competition, we use concentration, as in Laeven and Levine (2009).Concentration
is the total assets of the largest three banks in each country divided by total banking assets.
Evidence shows that companies in countries with better country-level governance
26
Porta et al.’s (1998) anti-director index as revised by Djankov et al. (2008). A higher value
means better protected shareholder rights. The variable institution is used, following Klomp and Haan (2012). It is the arithmetic average of six indicators called voice, political stability,
government effectiveness, regulatory quality, rule of law, and corruption that are reported in
Kaufmann et al. (2008). A higher value for an institution means that better and more efficient
supervisory institutions are present.
5. Data and descriptive statistics
5.1. Descriptive statistics
We collected bank data from Bankscope. We searched for the largest 1,000 banks in
Bankscope by asset size at the end of 2006. Included in the sample are commercial banks,
savings banks, cooperative banks, and mortgage banks. When we selected the largest 1,000
banks, Bankscope provided both listed and unlisted banks, with a total of 502 unlisted banks.
Since we focused on listed-only banks, this reduced the number of banks to a significant
extent. Moreover, as we assessed the impact of regulations on global banks in the credit and
sovereign debt crisis, we employed those banks listed during the credit crisis and the
sovereign debt crisis. In total, 120 banks were delisted following the credit crisis. In addition,
as we required bank balance sheet and income statement data for 2006 and 2010, we
excluded the delisted banks, as data was not available in Bankscope. Our final sample
included 378 global banks. We retained 378 banks for which we had accounting and share
price data. All the systematically important banks (29) are included in the sample.6 Finally,
6
27
we downloaded data on share prices and the MSCI World Index from DataStream; all data is
in US dollars.
Table 1 provides the descriptive statistics. The mean (median) distance to default is
3.106 (2.965) during the credit crisis. The distance to default is higher during the credit crisis
and significantly different than in the sovereign debt crisis. Our measure for systemic risk,
MES, is lower during the credit crisis. The mean (median) difference test shows a significant
difference between the credit crisis and the sovereign debt crisis. Systematic risk, as
measured by beta, was lower during the credit crisis as compared to the sovereign debt crisis.
It seems to increase after the 2007–08 credit crisis. Idiosyncratic volatility shows a similar
picture, as it is higher before the 2011 crisis. The 2007–08 credit crisis contributed to the
systematic and idiosyncratic volatility. The mean (median) BHAR2007–08 during the credit
crisis is –0.502 (–0.571), which shows that banks perform poorly. BHAR2011 is also
negative and shows that banks perform badly during the sovereign debt crisis as well.
[Insert Table 1 here]
All the accounting variables are calculated before the crisis. Tangible equity does not
show any significant difference between these two periods. Average Tier I capital shows that
banks increase regulatory capital significantly before the 2011 crisis period, in order to
gradually comply with the new capital requirements introduced in Basel III. Liquid assets are
significantly higher before the 2007–08 crisis than in 2011. There is no significant difference
in the deposit ratios of the banks during those periods. Funding fragility is higher before the
credit crisis compared to the sovereign debt crisis. The results give an early indication that in
the aftermath of the 2007–08 credit crisis, banks strive to strengthen their positions by
reducing their funding fragility. The loan to total asset ratio is slightly higher before 2011.
28
Even though the per-capita GDP is the same during both crisis periods, the current account
balance as a percentage of GDP deteriorates during the sovereign debt crisis.
All the regulations variables show a good degree of variability. The 5thpercentile for
official supervisory power is 7, and the 95th percentile is 13. Capital restrictions are bounded
between 4 and 8. The country-level variables show a wide variety of regulation levels. For
instance, concentration shows a minimum of 0.32 and a maximum of 0.85. Eighty-four
percent of our sample banks have explicit deposit insurance. In sum, there is a lot of variation
in the regulation levels, which makes it possible to test our conjectures.
5.2. Cross-country variations
Table 2 provides the descriptive statistics for the risk and return characteristics of
banks across countries. In particular, we report cross-country variations for countries that
have at least five banks in the sample. Banks in Poland have the highest distance to default
(log z) measure during the credit crisis, but this changes during the sovereign debt crisis, as
banks in Poland become more vulnerable to sovereign debt exposure and uncertainty. We
find that Chilean banks have the highest systemic risk, as the MES is the lowest for these two
countries during both the credit and sovereign debt crises. Banks in Austria have the lowest
idiosyncratic risk in both the credit (18.41) and the sovereign debt (27.34) crises. In contrast,
banks in Indonesia have the highest idiosyncratic risk during both crisis periods. With regard
to beta, banks in Switzerland and the US have the highest beta values for both crisis periods
(beta2007:1.48, beta2011:1.67 for Switzerland and beta2007:1.45, beta 2011:1.78 for the
US, respectively).Moreover, the banks based in Japan have the lowest beta during the credit
crisis (0.67), and this remains low during the sovereign debt crisis (0.86).The lowest BHAR
is reported for Greece during both the credit (-0.759) and the sovereign debt (-0.902) crises.
Banks in Japan perform relatively better during both crisis periods (BHAR is –0.230 in 2007–
29
[Insert Table 2 here]
6. Empirical results
6.1. Impact of regulations on risk and return during the credit crisis
This section presents the results on bank risk and returns during the credit crisis. In
particular, we assess the impact of a number of regulations, while controlling for
bank-specific characteristics, on four measurements of bank risk and the buy-and-hold returns
during the credit crisis.
6.1.1. Distance to default
We first examine whether the regulations have any impact on the distance to default,
as introduced by Laeven and Levine (2009). Table 4, columns (1)–(2) report the regression
results, with distance to default (log z) as the dependent variable. The results for the credit
crisis show that restriction, private monitoring, and deposit insurance are negatively and
significantly related to the distance to default. These results imply that the restrictions
imposed on bank activities do not increase the soundness of the banks when a crisis breaks
out. Due to moral hazard issues, banks may engage in risky activities if they are allowed to
conduct any activities (Boyd et al., 1993). However, we find that restricting bank activities is
negatively associated with bank soundness, consistent with Barth et al. (2004) and Beltratti
and Stultz (2012). According to Demirgüç-Kunt and Detragiache (2002), deposit insurance
could influence bank soundness in two opposite ways. Firstly, if deposit insurance is in place,
it increases bank soundness by reducing the chances of bank runs. In contrast, banks may
engage in excessive risk-taking behavior. Our results here highlight the second view. In the
presence of deposit insurance, banks are less sound amidst financial turmoil. Our results are
consistent with Barth et al. (2004) and Demirgüç-Kunt and Detragiache (2002), who show
that the presence of an explicit deposit insurance scheme tends to increase the probability of
30
[Insert Table 3 here]
In column (2), we include buy-and-hold returns before the credit crisis, Tier 1 capital,
funding fragility, loans, income diversity, log of assets, GDP per capita, current account
balance, and concentration of banking sector. We find that our main results in terms of
regulations survive after controlling for other variables. We include BHAR to test whether
the market provides any information on bank soundness, but we find no such evidence. We
include Tier 1 capital to test whether better capitalized banks are sounder, and we find it is
strongly and positively related to bank soundness. However, this is in contrast to Beltratti and
Stultz (2012). We find that size is negatively related to distance to default, which implies that
larger banks are less safe. Finally, concentration is significantly positively related to bank
soundness.
6.1.2. Systemic risk
From a regulatory viewpoint, there is increasing consensus that the correlation in the
risk-taking behavior of banks is much more relevant than the absolute level of risk taking in
any individual institution. The financial crisis of 2007–08 highlighted the importance of
systemic risk leading regulators to focus more on preventing future financial crises from
spreading through the financial system, e.g., the ongoing work by the Basel Committee and
the Financial Stability Board, striving to set new regulatory requirements for Systemically
Important Financial Institutions (SIFI). Acharya (2009) suggests that if sovereign states or
central banks provide an implicit guarantee to cover losses stemming from a systemic crisis,
banks will have more incentives to take on correlated risks. Guaranteed banks will not have
any incentives to diversify their operations, as they are protected by the guarantees.
According to Anginer et al. (2013), deposit insurance not only increases bank-level risk
taking through the standard moral hazard channel, but it may also increase risk-taking on the
31
relatively new and allows us to test the effects of regulations during the credit crisis and
sovereign debt crisis. Most of the earlier empirical work has examined the relationship
between regulation and systemic stability by using the incidence of banking crisis at the
country level as a measure of systemic risk (e.g., Demirgüç-Kunt and Detragiache, 2002).
In this section, we examine the relationship between regulations and bank-level
systemic risk during the credit crisis. The regression specifications and control variables are
the same as those used in Section 6.1.1. We use marginal expected shortfall as the dependent
variable to measure banks’ systemic risk, as described in Section 4. The results are in
columns (3)–(4) in Table 3. The results show that capital regulation and activity restrictions
are positively related to systemic risk during the credit crisis. This suggests that better
oversight of capital is related to higher MES, which means lower systemic risk, consistent
with Fernandez and Gonzalez (2005), who report that stringent capital requirements reduce
banking risk. Moreover, higher activity restrictions reduce individual banks’ contribution
towards systemic risk. The results also show that deposit insurance is negatively related to
MES, implying that in the presence of deposit insurance, banks take more risk, which
increases the chance of bank runs. These results are consistent with Barth et al. (2004) and
Demirgüç-Kunt and Detragiache (2002), who find that explicit deposit insurance increases
the probability of banking crises. When we introduce bank- and country-level control
variables (column (4), Table 3) most of the results related to regulations survive. None of the
control variables is significant. In this specification, private monitoring is positively related to
MES, implying that higher private monitoring leads to higher MES. In other words, higher
private monitoring reduces individual banks’ contribution towards systemic risk.
6.1.3. Idiosyncratic risk
Next we examine the impact of regulations on idiosyncratic volatility. The regression
32
idiosyncratic volatility as the dependent variable to measure banks’ business risk, as
described in Section 4. The results are in columns (5)–(6) in Table 3. The results in column
(5), i.e., without bank- and country-level controls, show that official power and deposit
insurance is positively and capital and restrictions are negatively related to idiosyncratic risk.
The results show that higher capital restrictions lower the idiosyncratic risk, which is
consistent with Fernandez and Gonzalez (2005). In the presence of deposit insurance, banks
take more risks, as deposit insurance is positively related to idiosyncratic risk, consistent with
Beltratti and Stultz (2012) and Anginer et al. (2013). Our results support the moral hazard
channel of risk taking in the presence of deposit insurance.
We then introduce the bank- and country-level control variables in column (6). The
results with respect to the regulations are mostly the same, with the exception that restriction
is no longer significant. We include BHAR before the crisis and find that it is positive and
significant. This suggests that banks with high returns before the crisis have higher risk
during the crisis. The market imposes some discipline in terms of returns, which leads banks
to take more risk. Moreover, the higher the funding fragility the lower the risk, as before the
credit crisis, the short-term funding market is working well. Finally, larger banks take more
risks as the log of assets is positively related to idiosyncratic risk.
6.1.4. Systematic risk
In this section, we examine the impact of regulations on banks’ systematic risk.
Therefore, we use banks’ beta as the dependent variable, as described in Section 4, along with
the same regression specifications and control variables as those in Section 6.1.1. The results
are in columns (7)–(8) in Table 3. The results in column (7), excluding bank- and
country-level variables, show that official supervision is positively related to banks’ market risk. This
is puzzling, as one would expect higher official supervision to prevent banks from taking
33
that capital restrictions and private monitoring are negatively related to market risk. This
finding, which is consistent with Fernandez and Gonzalez (2005), suggests that more
stringent capital regulations and private monitoring prevent banks from taking excessive risk,
resulting in their increased ability to absorb losses and be less sensitive to systematic risk.
Moreover, we do not find any evidence that deposit insurance affects banks’ systematic risk.
We then introduce the bank- and country-level controls, and our results on the impact
of regulations remain the same. We also introduce BHAR to test whether there is any
feedback through the market returns on beta, and we find that BHAR is highly significant and
positive. This suggests that banks with high BHAR before the credit crisis are more sensitive
to systematic risk during the crisis. In addition, we find that larger banks have higher beta,
which shows the systemic importance of large banks in their respective stock markets.
Finally, GDP per capita is positively related while current account balance is negatively
related to beta.
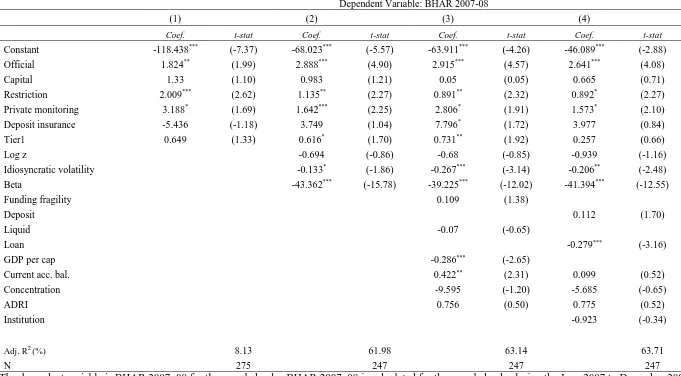
6.1.5. Buy-and-hold-returns
In this section, we assess the drivers of banks’ stock market performance during the
two crises. The results on the stock market performance during the credit crisis, reported in
Table 4, show that official supervision is consistently positive and highly significant. This
suggests that the markets show greater confidence in the banking sector in countries with
better and more effective official monitoring and that banks in these countries are more
resilient during the credit crisis. This is also supported by the fact that regulatory restrictions
are positive and significant, suggesting that in countries with stricter regulations, banks have
a better stock market performance. This suggests that better official monitoring helps keep
banks’ ultimate owners’ interests aligned with those of shareholders, resulting in a better
stock performance during the crisis.
34
The results on private monitoring are positive and significant. Based on the argument
of Belttrati and Stulz (2012), that better governance has a positive effect on bank stock
performance, our results on private monitoring suggest that better external monitoring leads
to better bank governance. This, in turn, leads to better stock performance. We find that
capital requirements have no impact on the market valuation and pricing of bank risk. We
also find some evidence, though not as strong, that banks with higher Tier 1 capital perform
better, consistent with Beltratti and Stulz (2012). The results also show that banks in
countries with deposit insurance perform better. Further, we find that banks with greater
idiosyncratic volatility and systematic risk show a poor performance during the credit crisis,
consistent with Acharya et al. (2010) and Beltratti and Stulz (2012), who find a negative
relationship between beta and returns during the credit crisis. We find no evidence of funding
fragility, liquidity, or ratio of deposits having an impact on banks’ stock performance. We do
find, though, that banks with a lower ratio of loans over assets operating in countries with
slowing economies have a poor stock performance during the credit crisis. We also find some
evidence that banks in countries with higher current account balances have better stock
performance, consistent with Lane (2012), who argues that the 2007 financial shock caused a
reevaluation of asset prices, especially in countries with greater economic imbalances.
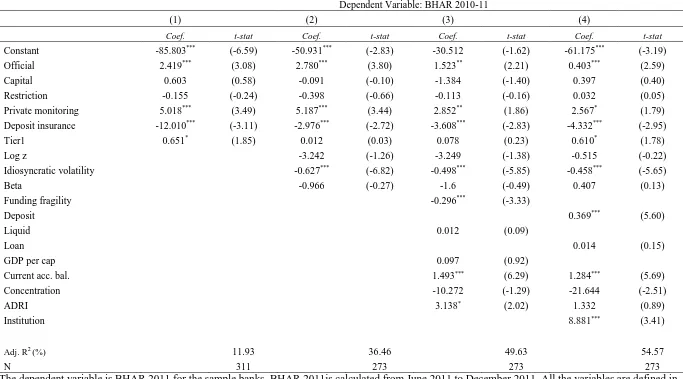
6.2. Impact of regulations on risk and return during the sovereign debt crisis
In this section we repeat the regressions on the same risk variables and the
buy-and-hold returns during the sovereign debt crisis. The objective here is to assess whether banks
take more sensible risks in the aftermath of the credit crisis, and whether the regulations
during the sovereign debt crisis affect banks’ risk and returns the same way as in the credit
crisis.