Kim, D.H. and Yu, D.O. and Kwon, O.J. and Fletcher, T.M. and Scheurich, F. and Brown, R.E. (2010)
Predicting unsteady blade loads of a wind turbine using RANS and vorticity transport methodologies. In:
European Wind Energy Conference, 20-23 April 2010, Warsaw, Poland.
http://strathprints.strath.ac.uk/
27361
/
Strathprints is designed to allow users to access the research output of the University of
Strathclyde. Copyright © and Moral Rights for the papers on this site are retained by the
individual authors and/or other copyright owners. You may not engage in further
distribution of the material for any profitmaking activities or any commercial gain. You
may freely distribute both the url (
http://strathprints.strath.ac.uk
) and the content of this
paper for research or study, educational, or not-for-profit purposes without prior
permission or charge. You may freely distribute the url (
http://strathprints.strath.ac.uk
)
of the Strathprints website.
Predicting Unsteady Blade Loads of a Wind Turbine
Using RANS and Vorticity Transport Methodologies
Da Hye Kim Dong Ok Yu Oh Joon Kwon
Korea Advanced Institute of Science and Technology, Daejeon 305-701, Korea Tel: +8242-350-3720, Fax: +8242-350-3710, email: ojkwon@kaist.ac.kr
Timothy M. Fletcher Frank Scheurich Richard E. Brown
University of Glasgow, Glasgow, G12 8QQ, UKAbstract
Numerical simulations of the NREL phase VI wind turbine operating in yawed conditions have been performed using two computational methods; one based on the solution of the Reynolds-averaged
Navier-Stokes equations (RANS) using
unstructured overset meshes and one known as the Vorticity Transport Model (VTM) that is based on the solution of the vorticity transport equation. Simulations with and without the instrumentation enclosure that was present during the NREL experiments were performed. It was found that the enclosure influenced the loading significantly at the inboard part of the blade when the blade passed through the wake that was developed by the enclosure. Both the RANS and VTM codes are able to predict well the unsteady and time-averaged aerodynamic loadings on the wind turbine blades at low wind speeds. At high wind speeds, leading-edge flow separation and strong radial flow are observed on the suction surface of the blades, when the blades are at the retreating side of the rotor. Both the RANS and VTM codes provide less accurate predictions of the blade loads. However, at the advancing side of the rotor, the flow is mostly attached to the surface of the blade, and both the RANS and VTM predictions of the blade loads are in good agreement with the measured data.
Keywords: wind turbine, RANS, Vorticity Transport Model, yaw, unsteady three-dimensional flow
Nomenclature
c airfoil chord
Cp pressure coefficient, = (P-P∞)/Qlocal
Cn normal force coefficient, = Fn /cQlocal
Ct tangential force coefficient, = Ft /cQlocal
Qlocal local dynamic pressure,
= ½ρ[(-V∞sinβcosψ+rΩ)2+(V∞cosβ)2]
r radial location
V∞ wind speed
β yaw angle
ρ density
ψ azimuth angle
Ω rotor rotational speed
1. Introduction
The blades of horizontal-axis wind turbines are known to experience significant flow separation over the suction surface at modest to high wind speeds. To the rear of the separation line, the flow over the blade can exhibit a large radial component that many of the standard blade element-momentum theory or lifting-line design tools cannot model from first principles. The airfoil performance data that is required by such methods can be augmented in certain cases using semi-empirical stall delay models, but these must be tuned to particular flow conditions and blade geometry. If the wind turbine operates in yaw, then the inflow at the blades, and the subsequent aerodynamic loading, varies dynamically with the rotor azimuth, and this destroys the validity of most simple models for stall delay. Indeed, a poorly understood interaction with dynamic stall effects is introduced. There is a wide acceptance that current wind turbine blades are not optimized for operation across the range of wind conditions that they encounter, and, therefore, do not fully realize their performance potential. A conservative approach to the design of wind turbine blades has, to some extent, developed because of the limitations in the predictive capability of rotor aerodynamic models. Future generations of wind turbine blades, perhaps those incorporating advanced forms of active or passive control, or those that will generate significantly lower fatigue loads, will require significant improvements in the predictive methods that are used to support their design. More fundamentally, the physics of the dynamically
varying, three-dimensional and post-stall
aerodynamics of the blades is still relatively poorly understood (see Refs 1 and 2 for the detailed analysis of the dynamic loading of wind turbines).
modeling of turbulence and hence boundary layer separation, their first-principles type approach renders them a very powerful tool which can be used to inform the development of efficient aerodynamic models that can be used for routine design calculations. The fidelity of the predictions of both the RANS and the VTM models is established by comparing predicted surface pressures and blade loading to measurements made during Phase VI of the NREL Unsteady Aerodynamics Experiment [3]. Several previous
works have investigated the aerodynamic
performance of the NREL turbine in yawed operation, including those of Tongchitpakdee [4],
Benjanirat [5] and Duque et al. [6]. However, the
complex co-existence of the dynamically varying, radial and separated flow around wind turbine blades that are operating in yawed conditions is still relatively poorly understood.
2. Computational Methods
The wind turbine that is modeled in this paper is the two-bladed rotor tested during Phase VI of the NREL Unsteady Aerodynamics Experiment [3]. The key properties of the Phase VI turbine are summarized in Table 1. The blades of the Phase VI rotor were stiff, and the structural deformation of the blades is ignored in the present analysis. The Phase VI turbine was of upwind design, but
included a relatively bulky instrumentation
enclosure that was mounted upstream of the centre of the rotor. All of the measurements that are cited in this paper were obtained from Refs. 4 and 7.
Rotor radius 5.029 m
Airfoil NREL S809
Rotational speed 72rpm
Blade tip pitch 3°
Table 1: NREL Phase VI Rotor
2.1 RANS Solver
In the present RANS calculations, an unstructured
mesh CFD flow solver [8] has been used to
simulate the time-accurate viscous flow around the wind turbine. The fluid motion is modeled by using the incompressible Reynolds averaged Navier-Stokes equations in conjunction with an artificial compressibility method. The equations may be
written in an integral form for arbitrary
computational domain
V
with boundary
V
as(1)
where
Q
is the vector of the primitive variables,and
F Q
( )
andG Q
( )
are the inviscid andviscous fluxes of these variables, respectively. The governing equations were discretized using a vertex-centered finite-volume method. The inviscid flux terms are computed using Roe’s flux-difference splitting scheme, whilst the viscous flux terms are computed by adopting a modified central difference method. Implicit time integration is performed using a linearized Euler backward difference scheme of second order. The Spalart-Allmaras one-equation turbulence model is used to estimate the eddy viscosity, and the flow is assumed to be fully turbulent in all of the RANS
simulations presented in this paper. An
unstructured overset mesh technique [9] was adopted for simulating the unsteady flows around the turbine when operating in yawed conditions.
Two computational meshes, which are
distinguished by the presence of the
instrumentation enclosure and nacelle, were constructed in order to investigate the effect of interference from the enclosure and nacelle on aerodynamic loads on the rotor. Figure 1 shows the surface triangulation at the boundaries of the computational meshes. The no-slip condition was applied on the surface of the blades, enclosure and nacelle. To capture the boundary layer on the blade surface, a hybrid mesh topology, containing both prismatic and tetrahedral cells, was used. The mesh without the enclosure and nacelle consisted of 2.85M nodes and 9.89M cells, and after adding the enclosure and nacelle, the number of nodes and cells increased to 2.95M and 10.4M, respectively. A time-step of 0.5° was used for the RANS calculations to produce converged time-accurate solutions.
2.2 Vorticity Transport Model
The Vorticity Transport Model (VTM), developed by Brown and Line [10], is a computational tool for the simulation of wind turbine aerodynamics that represents particularly well the development of the wake structure of the turbine. After making the physically realistic assumption of incompressibility within the wake, the time-dependent Navier-Stokes equations are cast into the vorticity-velocity form:
(2)
Given the high Reynolds number of the features within the turbine wake, the vorticity transport equation is solved in an inviscid form. The aerodynamics of the wind turbine blades is represented using a version of lifting-line theory, in
which the vorticity source term S is derived from
the temporal and spatial variations of the bound
vorticity,
b, on the blades so that(3)
( )
( )
V V V
V
Q dV
K
Q dV
F Q n dS
t
G Q n dS
2u
u
S
t
b b b
d
S
u
dt
(a) Background mesh
(b) Triangulation of blade surface (c) Triangulation of blade,
[image:4.595.58.528.62.223.2]enclosure and nacelle surfaces
Figure 1: Computational meshes for the RANS calculations.
The forces and moments on the blades are computed using appropriate airfoil performance characteristics. These can be modified to account for the effects of the stall delay phenomenon that can occur when the turbine rotor operates at a low tip speed ratio. The aerodynamic effect of the instrumentation enclosure and nacelle has not been modeled using the VTM. The effect of dynamic stall on the aerodynamic performance of the blade sections is accounted for using a Leishman-Beddoes-type semi-empirical dynamic stall model. Where the performance of the blade sections was modified to account for centrifugal effects, the Corrigan and Schillings stall delay model was used.
3. Effects of Instrumentation
Enclosure and Nacelle
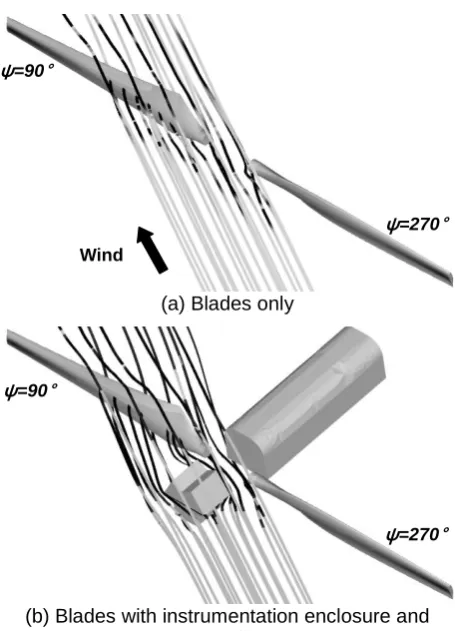
The instrumentation enclosure that was mounted ahead of the NREL rotor and, to a lesser extent, the turbine nacelle located downwind of the rotor, is known to influence the inflow conditions at the rotor during yawed operation. Figure 2(a) shows a cluster of streamlines within the incident flow to the RANS-simulated rotor at a wind speed of 7m/s and at a yaw angle of 60°, with only the blades modeled. In contrast, Fig. 2(b) shows the trajectory of the streamlines when the instrumentation enclosure and nacelle are modeled within the
simulation. In these figures, instantaneous
snapshots of the turbine are shown when the rotor blades are horizontal with respect to the ground plane. The contours on the blades represent the pressure at the blade surface.
A comparison of Figs. 2(a) and 2(b) demonstrates clearly how the incident flow to the turbine rotor is obstructed by the instrumentation enclosure. Figure 2(b) indicates that significant non-uniformity is introduced into the flow behind this feature of the turbine geometry, particularly at those blade sections located furthest inboard. The wake that is created downwind of the instrumentation enclosure propagates across the rotor disk and impinges on
(a) Blades only
(b) Blades with instrumentation enclosure and nacelle
Figure 2: Streamlines around the rotor, and pressure contours on the blade surface, for 7m/s wind speed with the turbine at a 60° yaw angle.
the blades when they are oriented near to 90°azimuth. The nacelle has only a relatively minor influence on the turbine inflow, primarily because it is located downwind of the rotor.
Figure 3 shows the effect of the inclusion of the instrumentation enclosure and nacelle on the distribution of pressure coefficient that is predicted by the RANS solver. The figure presents the chordwise pressure distributions at three radial locations as the blade is oriented at an azimuth angle of 90° and the rotor is operated at a yaw angle of 60°. In Fig. 3(a) the wind speed is 7m/s
Flow with yaw angle, β
β
β
`
Nacelle
Nacelle
Instrumentation enclosure
ψ=270°
Wind
ψ=90°
ψ=90°
[image:4.595.308.536.253.569.2](a) 7 m/s
[image:5.595.307.531.51.523.2](b) 15 m/s
Figure 3: Chordwise distributions of instantaneous pressure coefficient at the three radial stations. The azimuth of the blade is 90° and the turbine is operating at a 60° yaw angle.
whilst in Fig. 3(b) the wind speed is 15m/s. Figure 3 shows that, by modeling the instrumentation enclosure within the simulation, the distribution of pressure coefficient located at the inboard radial stations differs significantly from that predicted when only the blades are modeled.
These differences in the surface pressure distributions in the inboard portion of the blade also lead to significant differences in the RANS-predicted blade loading. Figures 4 and 5 suggest that the sensitivity of the blade loading to the modeling of the enclosure is most pronounced at the inboard blade stations. This is especially noticeable at 90° blade azimuth angle for both wind speed cases by reducing the normal force. The effect on the tangential force is relatively small.
(a) Normal force coefficient
(b) Tangential force coefficient
Figure 4: Radial distributions of instantaneous normal and tangential force coefficients along the blade when the turbine is operating at 7m/s wind speed with a 60° yaw angle.
The increased discrepancies between the
predicted and measured aerodynamic loads [7] at the inboard radial locations of the blade at 15m/s wind speed after including the instrumentation enclosure within the RANS simulation may be attributed to the assumption that the flow is fully turbulent and also to uncertainties about the measured dynamic pressure which had been used to normalize pressure coefficient during the NREL experiment. It is known that the pressure measurements are affected by the wake of the instrumentation enclosure when the turbines have the upwind design and operate with a yaw angle. The dynamic pressure measurement is also known to be invalid for azimuth angles from 0° to 120° in yawed conditions, mainly due to tunnel flow angle exceeding the design range of the probes, as
Blades only Blades with enclosure and nacelle
Blades only Blades with enclosure and nacelle
Blades only Blades with enclosure and nacelle
[image:5.595.62.287.63.520.2]described in Ref. 3. In contrast, at 180° and 270° azimuth, both of the simulations with and without the enclosure provide accurate predictions at all radial locations of the blade.
(a) Normal force coefficient
(b) Tangential force coefficient
Figure 5: Radial distributions of instantaneous normal and tangential force coefficients along the blade when the turbine is operating at 15m/s wind speed with a 60° yaw angle.
4. Time-Averaged Blade Loads
The three-dimensional, highly separated, and dynamically varying flow that exists around the blades of a wind turbine when the rotor operates in yawed conditions can only be fully understood by analyzing its temporal variation. Whilst keeping the dynamic nature of yawed rotor aerodynamics in mind, the ability of the RANS and VTM methods to capture the aerodynamic behavior of the rotor can also be ascertained, to some extent, by comparing
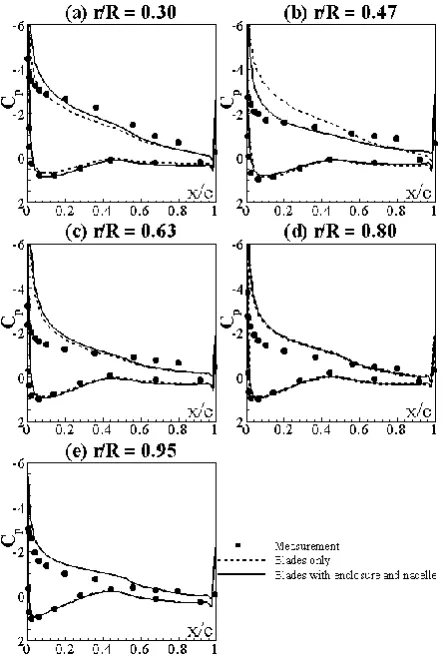
[image:6.595.62.285.122.577.2]the time-averaged loading on the blades with equivalent experimental measurements. Figures 6 and 7 compare the RANS-predicted and NREL-measured distributions [4] of pressure coefficient at five radial stations along the reference turbine blade, where the wind speed is 7m/s and the yaw angles are 30° and 60°, respectively. In each figure, the pressure coefficient data has been averaged over the period of one rotor revolution.
Figure 6: RANS-computed chordwise distributions of time-averaged pressure coefficient in a 7m/s wind speed whilst operating at a 30° yaw angle.
Figure 6 shows that there is excellent agreement between the computed and measured pressure coefficient on the surface of the blade when both the wind speed and the yaw angle are relatively low. Figure 7 shows that by increasing the yaw angle of the rotor to 60°, slight discrepancies in the surface pressure coefficient occur at the blade leading-edge near to the blade root. However, on the outboard portion of the blade, the RANS-predicted distributions of pressure coefficient over the airfoil sections agree very well with the experimental measurements. The effect of the instrumentation enclosure is evident only at the far inboard section of the blade for this time-averaged chordwise pressure distribution.
Comparison of Figs. 6 and 7 illustrates a notable reduction in suction at each of the five radial stations that are analyzed as the yaw angle of the
Measurement Blades only Blades with enclosure and nacelle
[image:6.595.311.535.178.507.2]turbine rotor is increased. The reduction in suction results in an associated reduction in both the mean normal and the mean tangential components of the force coefficient on the blades, as shown in Figs. 8(a) and 8(b), respectively.
Figure 7: RANS-computed chordwise distributions of time-averaged pressure coefficient in a 7m/s wind speed whilst operating at a 60° yaw angle.
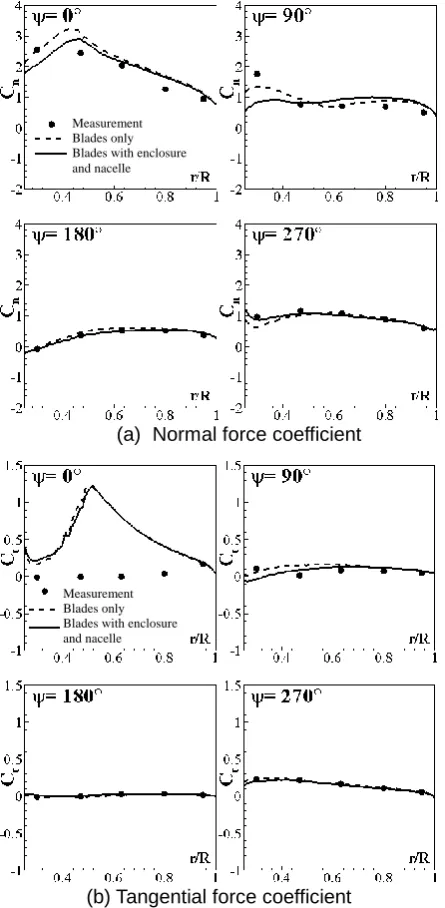
In Fig. 8, the VTM- and RANS-predicted radial distributions of normal and tangential force coefficient are presented along with the NREL measurements [4]. The force coefficient data that is shown in Fig. 8 has, again, been averaged over the duration of one complete revolution of the rotor. The overall reduction in aerodynamic loading on the wind turbine blades as the yaw angle is increased results from the reduction in the angle of attack on the advancing side of the disk. Whilst time-averaged data masks the variations in blade loading with azimuth, the capability of both the VTM and RANS methods to capture the mean loading at smaller yaw angles, and of the RANS method alone at larger yaw angles, is shown to be adequate. The VTM predictions could be further enhanced by tailoring the parameters of the semi-empirical dynamic stall model to the particular NREL experimental data. The inclusion of the instrumentation enclosure improves the accuracy of the RANS-predicted blade loading, particularly at the higher yaw angle.
Figure 8: Radial distributions of time-averaged normal and tangential force coefficients for 7m/s wind speed. Data for turbines operating at two different yaw angles are shown.
Figures 9 and 10 show the RANS-predicted and NREL-measured chordwise distributions of time-averaged pressure coefficient [4] on the blades of the turbine when the rotor operates at yaw angles of 30° and 60°, respectively, but within a 15m/s incident wind. An increase in wind speed from 7m/s to 15m/s excites significant additional physics within the aerodynamics of the blades. The figures show that, at the low angle of yaw, the RANS solver resolves the leading edge suction peak poorly, despite the pressure coefficient on the pressure surface of the blade being well-predicted. At higher yaw angles, excellent predictions of pressure coefficient at the outboard radial stations are in strong contrast to the poor prediction of the surface pressures further inboard. The leading edge pressure is over-predicted primarily because the location of separation point on the suction surface of the blade is strongly dependent on the turbulence model that is used within the RANS solver. The separation of the flow on the suction surface is known to be difficult to simulate accurately at wind speeds above approximately 10m/s for this particular wind turbine configuration. The inclusion of the instrumentation enclosure at this wind speed shows noticeable differences in the pressure distributions at the inboard blade sections for both yaw angle cases simulated.
(a) Normal force coefficient
[image:7.595.316.532.59.356.2]Figure 9: RANS-computed chordwise distributions
of time-averaged pressure coefficient in a 15m/s
wind speed whilst operating at a 30° yaw angle.
Figure 11 shows that the over-prediction of the pressure coefficient on the suction surface leads to an associated over-prediction of the time-averaged normal and tangential force coefficient along most of the length of the blade when the yaw angle of the turbine is 30°. When the yaw angle is relatively high, the poor prediction of the suction on the inboard portion of the blade manifests as a significant under-prediction of both the time-averaged normal and tangential
force coefficient. The inclusion of the
instrumentation enclosure improves the results slightly, particularly at the higher yaw angle. The figure also shows that, with the exception of the
most outboard blade stations, the VTM
[image:8.595.63.285.63.394.2] [image:8.595.309.538.469.708.2]significantly under-predicts the normal and tangential force coefficient on the blades. It is known that, at relatively high wind speeds, the separation of the boundary layer near to the leading edge and the radial flow aft of the separation line creates, in reality, a significantly higher lift on the blade at angles of attack beyond that where static stall ordinarily occurs. This phenomenon cannot currently be modeled accurately using quasi-two-dimensional methods such as the lifting-line approach that is implemented within the VTM.
Figure 10: RANS-computed chordwise distributions of time-averaged pressure coefficient
in a 15m/s wind speed whilst operating at a 60°
yaw angle.
(a) Normal force coefficient
(b) Tangential force coefficient
Figure 11: Radial distributions of time-averaged normal and tangential force coefficients for 15m/s wind speed. Left: 30° yaw; right: 60° yaw.
Measurement Blades only (VTM) Blades only (RANS) Blades with enclosure and nacelle (RANS)
5. Unsteady Blade Loading and
Radial Flow Effects
The aerodynamic characteristics of wind turbines when they operate in yawed conditions can be understood more clearly by analyzing the unsteady loads on the rotor and the associated temporal variations in the flow field around the blades. Figure 12 shows contours of the instantaneous pressure coefficient on the suction surface of the turbine rotor when operating in a wind of speed 15m/s at a yaw angle of 30°. The distribution of pressure coefficient is shown at intervals of 30° of azimuth. The pressure is normalized using the tip speed of the rotor, rather than local dynamic pressure as in all the figures presented earlier in this paper. There is significantly greater suction on the advancing side of the rotor (at 180° azimuth) than when the blade is retreating from the incident wind (at 0° azimuth). Figure 12 thus demonstrates clearly the strong temporal variation in the aerodynamic environment that is encountered by the blades of the rotor when the turbine operates at non-zero yaw with respect to the wind.
On the retreating side of the rotor, where the angle of attack at each blade section is, in general, higher than that experienced on the advancing side of the rotor disk, a distinct reduction in pressure coefficient behind the leading edge suction peak occurs nearer to the leading edge mostly at the outboard portion of the blade. The reduced suction that is developed on the blades whilst retreating from the incident wind suggests that a greater proportion of the blade experiences flow separation, compared to that on the opposing side of the disk.
Figure 12: Instantaneous pressure contours computed by the RANS solver on the suction surface of the blades when the turbine rotor operates in a 15m/s wind at a 30° yaw angle.
(a) Normal force coefficient
(b) Tangential force coefficient
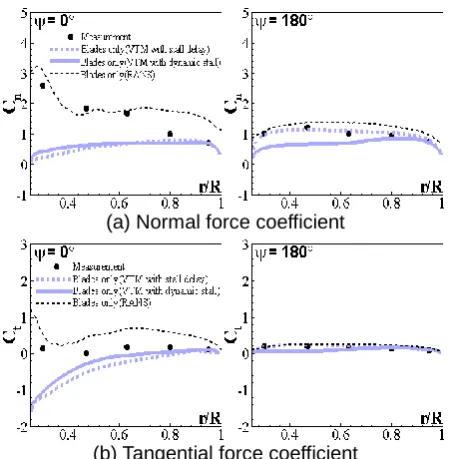
Figure 13: Radial distributions of instantaneous normal and tangential force coefficients for 15 m/s wind speed with 30° yaw angle.
Figures 13(a) and 13(b) show the radial distributions of the instantaneous normal and tangential force coefficients on the blades, respectively, when the rotor operates in a 15m/s wind at a 30° angle of yaw. In each figure, the measured distributions of blade loading from the NREL experiment [7] are presented alongside those computed using the RANS solver and the VTM. Two sets of VTM-computed data are presented in each sub-figure, one where a semi-empirical dynamic stall model has been used to augment the static two-dimensional lift, drag and moment coefficient data for the airfoil, and a second where a stall delay model has been applied to the static airfoil data.
Figure 13(a) shows that, when the blade is retreating from the incident wind, the RANS solver is able to predict the normal force coefficient well at the inboard portion of the blade, but provides less accurate predictions toward the blade tip. The RANS solver slightly over-predicts the tangential force coefficient at all radial locations on the blade. The VTM significantly under-predicts the blade loading on the retreating side of the disk, with the exception of the tip. In addition, neither the stall delay model nor the dynamic stall model improves the accuracy of the VTM-predicted blade loads. Previous experience in using both stall delay and dynamic stall models suggests that they require
careful tuning in order to yield notable
improvements in the prediction of post-stall blade loading, and may, indeed, be wholly inadequate for use in conditions where the tip speed ratio of the rotor is below approximately 4–5. At the advancing side of the rotor where the flow is mostly attached to the surface of the blade along most of the span, both the RANS and VTM predictions show good agreement with the measurement.
V∞ sin β
ψ=90°
ψ=180°
ψ=270°
[image:9.595.309.534.60.290.2] [image:9.595.66.289.488.721.2]`
(a) 0° azimuth
[image:10.595.64.523.61.334.2](b) 180° azimuth
[image:10.595.82.511.356.548.2]Figure 14: Instantaneous streamlines computed by the RANS solver for the suction surface of the blade for the turbine operating in a 15m/s wind at a 30° angle of yaw.
Figure 15: Instantaneous streamlines around the blade when it is located at 0° azimuth whilst in a wind of speed 15 m/s and the turbine is at a 30° angle of yaw.
Figure 14 illustrates the instantaneous
streamlines on the suction surface of the blade when it is located at azimuth angles of 0° and 180° and operating in 15m/s wind at a 30° angle of yaw. The figure demonstrates that, when the blade is at an azimuth of 0°, the flow over its suction surface separates along the inboard part of the leading edge, and is gradually skewed aft towards the trailing-edge of the blade as the radial distance further increases. In contrast, Fig. 14(b) shows that when the blade is located at an azimuth of 180°, and is therefore advancing into the incident wind, the flow remains attached over the entire suction surface of the blade. Separation of the flow over the suction surface of the blades is suppressed on
the advancing side of the disk by the higher in-plane velocity, and the associated lower angle of attack at the blade.
The instantaneous streamlines that are shown in Fig. 14 illustrate clearly that the flow over the suction surface of the blade has a significant component in the radial direction, particularly when the flow has separated, but also when the flow remains attached to the blade surface. Figure 15 shows instantaneous streamlines in the flow above the blade at three radial stations along the blade (0.3R, 0.63R and 0.95R). The flow over the pressure surface at each of the three radial stations remains largely attached until it reaches the trailing edge of the blade. In contrast, the flow over the inboard portion of the suction surface
Separation line Separation line
0.3R 0.63R 0.95R
separates at the leading edge, and is driven radially outward by centrifugal effects that result from the rotation of the blades. The flow over the station closest to the mid-span of the blade (0.63R) also separates near to the leading edge of the blade, but remains largely parallel to the blade chord, and is not driven outboard toward the tip of the blade. At the tip of the blade, the flow over the suction surface, though separated from just forward of the mid-chord location, is dominated by the proximity of the tip vortex of the blade, and is largely unaffected by the centrifugal flow further inboard. Figure 15 suggests that the formation of the tip vortex and its effect in limiting the flow separation on the outboard portion of the suction surface acts to constrain, to some extent, the radial flow that occurs over the suction surface of the blade further inboard.
6. Conclusion
Two numerical tools, one based on the Reynolds-averaged Navier-Stokes (RANS) equations, and a second that couples a lifting-line blade model to numerical solution of the vorticity transport equation (known as the Vorticity Transport Model, or VTM) have been used to expose the complex fluid dynamics that is encountered by the blades of wind turbines when they are operated in yaw. A matrix of operating conditions that included two different wind speeds of 7m/s and 15m/s, and two yaw angles of 30° and 60°, were analyzed.
At 7 m/s wind speed, the present RANS and VTM results showed good agreement with the measured aerodynamic loads. As the yaw angle was increased from 30° to 60°, the loading on the blades of the wind turbine was reduced. The RANS
predictions show that the effect of the
instrumentation enclosure on the aerodynamic loads is noticeable when the blade is oriented within the wake that the enclosure creates.
At 15 m/s wind speed, significant flow separation occurs on the suction surface of the blades when the blade is retreating from the incident wind. Incorrect prediction of the leading edge suction peak leads to substantial discrepancy between the predicted and the measured aerodynamic force coefficients. As the yaw angle is increased from 30° and 60° for the same wind speed of 15 m/s, the radial extent of the region where separation occurs decreases, and the prediction of the aerodynamic coefficients improves.
The RANS method yields significant insight into the flow physics around the blades in the challenging conditions that relatively high wind speeds and yawed wind turbine operation present. The co-existence of separated, radial and dynamically varying flow regimes that the RANS method reveals should inform the development of improved low-order models that can be used to augment blade-element or lifting-line aerodynamic models.
Acknowledgments
This work is the outcome of a Manpower Development Program for Energy & Resources supported by the Korean Ministry of Knowledge and Economy. The authors would also like to acknowledge the support of the British Council through the PMI2 Connect program.
References
[1] Huyer, S. A., Simms, D., and Robinson, M. C., “Unsteady Aerodynamics Associated with a
Horizontal-Axis Wind Turbine,” AIAA Journal,
1996, 34, (7), 1410–1418.
[2] Robinson, M. C., Hand, M. M., Simms, D. A., and Schreck, S. J., “Horizontal Axis Wind Turbine
Aerodynamics: Three-dimensional, Unsteady,
and Separated Flow Influences,” NREL CP-500-26337, Apr 1999.
[3] Hand, M. M., Simms, D. A., Fingersh, L. J., Jager, D. W., Cotrell, K. R., Schreck, S., and Larwood, S. M. Unsteady Aerodynamics Experiment Phase VI: Wind Tunnel Test Configurations and Available Data Campaigns. NREL TP-500-29955 2001.
[4] Tongchitpakdee, C., “Computational Studies of
the Effects of Active and Passive Circulation
Enhancement Concepts on Wind Turbine
Performance”, Doctoral Dissertation, Georgia Institute of Technology, May, 2007
[5] Benjanirat, S., “Computational Studies of
Horizontal Axis Wind Turbines in High Wind Speed Condition Using Advanced Turbulence Models”, Doctoral Dissertation, Georgia Institute of Technology, Dec 2006.
[6] Duque, E. P. N., Burkland, M. D., and Johnson, W., “Navier-Stokes and Comprehensive Analysis Performance Predictions of the NREL Phase VI
Experiment,” Journal of Solar Energy Engineering,
2003, 125, 457–467.
[7] Hand, M. M., Simms, D. A., Fingersh, L. J.,
Schreck, S., and Larwood, S. M. “NREL
Unsteady Aerodynamics Experiment in the NASA-Ames Wind Tunnel: A Comparison of Predictions to Measurements”, NREL TP-500-29494, Jun 2001.
[8] Kang, H. J. and Kwon, O. J., “Unstructured Mesh Navier-Stokes Calculations of the Flow Field of a
Helicopter Rotor in Hover,” Journal of American
Helicopter Society, 2002, 47, (2), 90–99.
[9] Jung, M. S. and Kwon, O. J., “A Parallel
Unstructured Hybrid Overset Mesh Technique for
Unsteady Viscous Flow Simulations,"
International Conference on Parallel
Computational Fluid Dynamics, Antalya, Turkey, 21–24, May 2007.
[10] Brown, R. E. and Line, A. J., “Efficient High-R