Chapter 1
CLASSROOM ENVIRQNMENT,
STUDENTS' PERCEPTIONS OF
ASSESSMENT, ACADEMIC EFFICACY
AND ATTITUDE TO SCIENCE:
A LISREL ANALYSIS
Jeffrey P. Dorman Australian Catholic University
Australia Darrell L. Fisher Curtin University of Technology
Australia Bruce G. Waldrip
University of Southern Queensland Australia
2 1. P. Dorman, D. L. Fisher & f B. G. Waldrip 1. Background
1.1 Classroom environment
The concept of environment, as applied to educational settings, refers to the atmosphere, ambience, tone, or climate that pervades the particular ) setting. Research on classroom environments has focussed historically on its psychosocial dimensions - those aspects of the environment that focus
on human behaVIOur in origin or outcome (Boy & Pine, 1988). Reviews
of classroom environment research by Fraser (1998a), Dorman (2002), Goh and Khine (2002) and Khine and Fisher (2003) have delineated at least 10 areas of classroom environment research. One of the strongest traditions of classroom environment research has been the study of links between classroom environment and student cognitive and affective outcomes. This chapter is situated within this tradition.
Results of studies conducted over the past 30 years have provided convincing evidence that the quality of the classroom environment in schools is a significant determinant of student learning (Fraser, 1994, 1998a). Studies conducted in Indonesia by Margianti, Fraser, and
Aldridge (2001), Singapore (Fraser & Chionh, 2000; Goh & Fraser,
1998) and Brunei (Riah & Fraser, 1998) confirmed this general view.
Research by Wong and Fraser (1996) in Singapore and Henderson
Fisher and Fraser (2000) focussed specifically on the
relationshi~
between science classroom environments and attitudinal outcomes. A cross-national investigation of links among 10 classroom environment dimensions, student self-handicapping and student academic efficacy was reported by Dorman, Adams and Ferguson (2002). A sample of 3,602 students from 29 schools in Canada, England and Australia was surveyed. Simple and multiple correlation analyses
between 10 classroom environment scales from the What Is Happening
In this Class (WIHIC) and the Constructivist Learning Environment Survey (CLES) and self-handicapping were conducted with and without
control for academic efficacy. Results showed that classroom environment scales accounted for appreciable proportions of variance in self-handicapping beyond that attributable to academic efficacy. Enhanced affective dimensions of the classroom environment were associated with reduced levels of self-handicapping. Commonality analyses revealed that the WIHIC scales accounted for a much greater proportion of variance in self-handicapping that did the CLES scales.
Classroom Environments: A LISREL Analysis 3
Other recent envi~onment-outcomes studies have investigated
school-level environments and student outcomes in mathematics
(Webster & Fisher, 2004), the relationship between learning
environments, family contexts, educational aspirati6ns and attainment .' (Matjoribanks, 2004), the effect of classroom and home environments on
student academic efficacy (Claiborne & Ellett, 2005) and the effect of
technology on learning environments and student attitudes in secondary
science classes (Temons, 2005). \
The purpose of the present chapter is to report the use of classroom environment scales, perceptions of assessment scales and affective outcome measures in the one study. Most of the above studies reflect the strong tradition of investigating associations between environment and outcomes through simple, multiple and canonical correlation techniques. The research reported in this chapter uses structural equation modelling to study a postulated model in which classroom environment dimensions are linked to student perceptions of assessment, academic efficacy and attitude to science. This chapter also reports the use of confirmatory factor analysis to establish the structure of the 12 scales employed in this study.
1.2 Students' perceptions of assessment
Despite the growth in emancipatory conceptualisations of classrooms that embrace a constructivist epistemology, little contemporary evidence exists to support the view that students are genuinely involved in decision-making about their assessment tasks. That is, forms of assessment and specific assessment tasks employed in schools are overwhelmingly decided by
teachers and administrators. Furthermore, even though reports like The
Status and Quality of Teaching and Learning in Australia (Goodrum,
Hackling, & Rennie, 2001) have asserted that assessment is a key
component of the teaching and learning process, teachers tend to utilise a very narrow range of assessment strategies on which to base feedback to
parents and students. In practice, there is little evidence that teachers actually
use diagnostic or formative assessment strategies to inform planning and teaching (Radnor, 1996). This could be due to teachers feeling that they need to 'sacrifice learning with understanding for the goal of drilling students in the things for which they will be held accountable' (Hobden, 1998, p. 221).
4 J. P. Dorman, D. L. Fisher & B. G. Waldrip
written questions should be used in assessing student's leaming. The inclusion of alternative assessment strategies, such as teacher observation, personal communication, and student performances, demonstrations, and portfolios, have been offered by experts as having greater usefulness for evaluating students and informing classroom instruction (Stiggins, 1994). Based on research with teachers, Barksdale-Ladd and Thomas (2000) identified five best practices in assessment:
•
•
•
•
•
providing feedback to help students improve their leaming;
conceptualising assessment as part of a student's work, which can go into a working portfolio;
providing flexibility so that assessment does not dominate the curriculum;
ensuring that assessment informs instruction to help teachers improve their teaching, thereby ensuring student learning; and using more than one measuring stick to assess students' leaming.
Reynolds, Doran, Allers, and Agruso (1995) argued that for effective learning to occur, congruence must exist between instruction, assessment and outcomes.
In the USA, assessment of student learning has become highly
politicised with most states having standardised testing procedures in which even the teacher is, to some extent, marginalised from any professional judgment of whether a student is ready to move to the next year level. A similar trend is developing in Australia with benchmarking, testing and reporting to authorities assuming great importance in schools today. Paradoxically, while teachers have been bombarded with information from educators on what they should be doing regarding assessment, ideologically-driven state educational bureaucrats have become more prescriptive by deciding what teachers will do. Against this backdrop, the reality for students is one of almost complete exclusion from the assessment process. The overwhelming view is that, in fOmI and design, assessment tasks should not involve students: bureaucrats have a role, teachers have a scaled-down role, students have no role.
Few textbooks on classroom teaching and assessment suggest a substantive role for students in developing assessment tasks. This
position is historically and culturally based and is root~d in an outdated
"assembly-line" view of learning in which recitation of facts is highly prized. In today's information age, jobs are increasingly demanding
r
Classroom Environments: A LISREL Analysis 5
higher levels of literacy skill and critical thinking and these demands require students to actively engage and monitor their learning rather than passively receive knowledge. This requires a fundamental review of how teachers involve students in assessment tasks (Rogoff! 2001).
" An effective assessment process should involve a two-way communication system between teachers and their students. Historically, teachers have used testing instruments to transmit to students and their parents what is really important for them to know and do. While this reporting tends to be in the form of a grade, the form and design of assessment can send subtle messages on what is important. There has been a substantial amount of research into types of assessment but very little
research into students' perceptions of assessment (see e.g., Black & Wiliam,
1998; Crooks, 1998; Plake, 1993; Popham, 1997).
In one of the few studies conducted on students' perceptions of
assessment, an American sample of 174 students in Years 4 to 12 responded to a specially-designed questionnaire (Schaffuer, Bury, Stock, Cho, Boney, & Hamilton, 2000). This research, which also elicited teachers' self-reported perceptions of competence in the design and implementation of assessment tasks, found that teachers were not asking students about what should be included in assessment tasks. By including students in the teaching - testing - grading cycle, the validity of the assessment processes can be enhanced and invalid assessment instruments that result in very high failure rates can be avoided (see e.g., Steinberg, 2000).
1.3 Academic efficacy
The broad psychological concept of self-efficacy has been the subject of much theorising and research over the past two decades (see e.g., Bandura, 1997; Schunk, 1995). Within this field, one particularly strong area of interest is that of academic efficacy, which refers to personal judgements of one's capabilities to organise and execute courses of action to attain designated types of educational performances (Zimmerman, 1995). Consistent with self-efficacy theory, academic efficacy involves judgements on capabilities to perform tasks in specific
academic domains. Accordingly, within a classroom learning
environment, measures of academic efficacy must assess students'
perceptions of their competence to do specific activities. It is therefore
6 J. P. Dorman, D. L. Fishef & B. G. Waldrip (1996) investigated academic efficacy at mathematics-related tasks. Similarly, Schunk, and Rice (1993) studied self-efficacy among students receiving remedial educational services. Recently, Zeldin and Pajares (2000) explored the self-efficacy beliefs of women in mathematical, scientific and technological careers.
Research studies have provided consistent, convincing evidence that academic efficacy is positively related to academic motivation (e.g.,
Schunk & Hanson, 1985), persistence (Lyman, Prentice-Dunn, Wilson,
& Bonfilio, 1984), memory performance (Berry, 1987), and academic performance (Schunk, 1989). Multon, Brown, and Lent (1991) performed a meta-analysis of research studies that related academic efficacy to the attainment of basic cognitive skills, course work, and standardised achievement tests. This analysis revealed that academic efficacy is a consistent positive predictor of academic achievement. However, the influence of academic efficacy was not uniform. Whereas the strongest effect was for the influence of academic efficacy on basic cognitive skills, the weakest effect was for the influence of academic efficacy on standardised tests. According to Schunk (1996), the relationship between academic efficacy and both motivation and effort is reciprocal. That is, motivation and effort influence, and are influenced by, academic efficacy. This suggests a type of multiplier effect: as students perceive their progress in acquiring skills and gaining knowledge, their academic efficacy for further learning is enhanced. Schunk (1996) notes that academic efficacy influences persistence provided that the task is sufficiently difficult. In this situation, low academic efficacy students opt out whereas students with high academic efficacy persevere with the task.
According to Bandura (1997), there are four sources of self-efficacy: enactive mastery experiences, vicarious experiences, verbal persuasion and physiological and affective states. Analogously, Schunk (1996) believes that students appraise their academic efficacy through performance, vicarious (observational) experiences, forms of persuasion and physiological reactions. While not explicitly recognised by efficacy theorists, some of these sources can be attributed to the psychosocial learning environment that students experience in Their schools and classrooms. For example, students in classrooms regularly observe their peers performing tasks successfully and unsuccessfully. Even a cursory review of the learning environment literature of the past three decades indicates that the learning environment is not an inert contributor to the
"
Classroom Environments: A LISREL Analysis 7
sources of academic
effi~acy
identified by Bahdura and Schunk. Indeedit is striking that academic efficacy theory has not recognised the
potential of psychosocial environment in explaining a~ademic efficacy.
1.4 Attitude to science
Teachers have a profound effect on the learning environment in their classrooms. Given the national importance given to the teaching of science and inculcation of positive attitudes to science in students, it was both timely and opportune to examine classroom environment, students' perceptions of assessment tasks, academic efficacy and their associations with attitude to science. Successful implementation of teaching strategies to teach science is likely to result in the establishment and maintenance of positive students' attitudes to science and consequently, achievement. Previous research has shown that students' perceptions of classroom
environment are related to attitudes to science (Fisher & Waldrip, 1999;
Klopfer, 1992). This study built on these findings by including students' perceptions of assessment tasks as a construct in a hypothesised model that predicts student attitudes to science.
2. Design of Present Study
The aims of the study described in this chapter were to:
• validate the structures of five scales of the What Is Happening In
this Class (WIHIC), the Student Perceptions of Assessment
Questionnaire (SPAQ) and measures of academic efficacy and attitude to science using confirmatory factor analysis,
• identify classroom environment and perceptions of assessment
dimensions that predict academic efficacy and attitude to science, and
• investigate whether a postulated model of relationships among
/
8 1. P. Dorman, D. L. Fisher & B. G. Waldrip 2.1 Sample
The sample employed in this study consisted of 449 students in secondary schools in Queensland. Table 1.1 describes the sample which consisted of 203 year 8, 136 year 9 and 110 year 10 students.
Table 1.1. Description of Sample
.
Sample SizeGender
Year 8 Year 8
Male 95 Male 95 Male
Female 108 Female 108 Female
Total 203 Total 203 Total
2.2 Instrumentation
2.2.1 Assessment of classroom environment
To assess classroom environment, five scales from the What Is Happening In this Class? (WIHIC) instrument were selected. The WIHIC is a well-established and widely-used questionnaire in classroom
environment research (see Aldridge & Fraser, 2000; Dorman, 2003). As
this study involved data collection on four facets of classroom life for students (viz. classroom environment, perceptions of assessment, academic efficacy and attitude to science) it was decided in the interests of economy to use five of the seven WIHIC scales: Student Cohesiveness, Teacher Support, Involvement, Task Orientation, and Equity. A four-point Likert response format (viz. Almost Never, Sometimes, Often, and Almost Always) was used. Scale scores for each respondent were obtained by aggregating scores for the eight items for that scale.
The WIHIC's reliability and validity has been reported in many studies. Since its initial development, the WIHIC has been used successfully in studies to assess the learning environment in Singapore
(Fraser & Chionh, 2000), Australia and Taiwan (Aldridge & Fraser,
2000), Brunei (Khine & Fisher, 2001), Canada (Zandvliet & Fraser, in
press), Australia (Dorman, 2001), Indonesia (Adolphe, Fraser, &
Aldridge, 2003), Korea (Kim, Fisher, & Fraser, 2000), the USA (Allen &
Fraser, 2002), and Canada, England, and Australia (Dorman, 2003).
r
Classroom Environments: A LISREL Analysis 9
Table 1.2. Descriptive Information for Five Classroom Environment, Five SP AQ, and Two Outcome Scales
Scale Scale Description r Sample Item Classroom Environment
Student The extent to which students know, I am friendly to members of Cohesiveness help and are supportive of one another. this class.
Teacher The extent to which the teacher helps, , The teacher considers my Support befriends, trusts and is interested in \ feelings.
students .
Involvement The extent to which students have I explain my ideas to other attentive interest, participate in students.
discussions, do additional work and enioy the class.
Task The extent to which it is important to I know how much work I Orientation complete activities planned and to stay have to do.
on the subi ect matter.
Equity The extent to which students are treated I get the same opportunity equally by the teacher. to answer questions as other
students. SPAQ
Congruence The extent to which assessment tasks My assignments/tests are with Planned align with the goals, objectives and about what I have done in Learning activities of the learning program. class.
Authenticity The extent to which assessment tasks I find science assessment feature real life situations that are tasks are relevant to what I relevant to the learner. do outside of schoo I.
Student The extent to which students are I have a say in how I will be Consultation consulted and informed about the forms assessed in science
of assessment tasks being employed.
Transparency The extent to which the purposes and I am clear about what my forms of assessment tasks are well- teacher wants in my defined and clear to the learner. assessment tasks. Diversity The extent to which all students have I have as much chance as
an equal chance at completing any other student at assessment tasks. completing assessment
tasks. Outcomes
Academic Students' judgements oftheir Even if science is hard, I can Efficacy capabilities to organise and execute learni!.
courses of action to attain designated types of educational performances.
Attitude to The extent to which students are I enjoy the activities we do Science interested in, enjoy and look forward to in science
[image:5.830.432.785.92.556.2] [image:5.830.50.376.171.238.2]10 J. P. Dorman, D. L. Fisher /I" & B. G. Waldrip 2.2.2 Students' Perceptions of Assessment Questionnaire (SPAQ)
Students' perceptions of assessment were assessed with the 30-item SPAQ. These items are assigned to five internally consistent scales. Table 1.2 shows these scales, their descriptions and sample items. The SPAQ is the result of instrument development and validation procedures
conducted in Essex, England (Dorman & Knightley, 2005) and Australia
(Fisher, Waldrip, & Dorman, 2005). While discussion of this earlier
work is outside the scope of the present chapter, validation statistics including the results of confirmatory factor analysis performed on data collected in the present study are presented later in this chapter. The present form of the SP AQ employs a four-point Likert response format for each item (Almost Never, Sometimes, Often, and Almost Always).
2.2.3 Outcome scales
Two outcome scales, Academic Efficacy and Attitude to Science, were employed in the present study. Perceived academic efficacy refers to students' judgements of their ability to master the academic tasks that they are given in their classrooms. A six-item scale using items developed by Midgley and Urdan (1995), Midgley et al. (1997), and Roeser, Midgley and Urdan (1996) was used to assess perceived academic competence at science class work. Each academic efficacy item was modified to elicit a response on academic efficacy at science. All items in the Academic Efficacy scale had a four-point response
format with anchors of 1 (Disagree) and 4 (Agree). An 8-item scale
assessed attitude to science. This scale was employed in Waldrip and
Fisher's (2002) previous research on attitude to science. It is an adaptation of
scales from the Test of Science-Related Attitudes (TOSRA: Fraser, 1981).
All items in the Attitude to Science scale used a four-point response format with anchors of 1 (Disagree) and 4 (Agree).
2.3 Data collection procedures
Students were surveyed in science classrooms. This was particularly significant to the present study because classroom environment, perceptions of assessment, and the two outcomes measures (viz. academic efficacy and attitude to science) were subject specific. Students responded once to the questionnaire.
r
, '
Classroom Environments: A LISREL Analysis 11
2.4 Data analysis and interpretation
There were three distinct components to the analyses conducted in the
present study. First, confirmatory factor analysi~ (CFA) and scale
reliability analysis were employed to substantiate the structures of the 12
scales. For each scale, a measurement model in which a latent variable
was assessed by that scale's items was tested using CFA. Latent
variables are not measured directly. Their v~lues are indicated by
observed variables.
Three indices for CF A models are reported in the present chapter: the Root Mean Square Error of Approximation (RMSEA), the Tucker-Lewis Index (TLI), and the Parsimony Normed Fit Index (PNFI). Whereas the RMSEA assesses model fit, the TLI and PNFI assess model comparison and model parsimony respectively. To interpret these indices, the following rules which are generally accepted in the SEM literature as reflecting good models were adopted: RMSEA should be below 0.08 with perfect fit indicated by an index of zero, TLI should be above 0.90
with perfect fit indicated when TLI
=
1.00, and PFNI should be above0.50 with indices above 0.70 unlikely even in a very sound fitting model. In addition to these fit indices, the Coefficient of Determination was computed. The Coefficient of Determination for measurement models indicates how much variance in the latent variable is accounted for by the observed variables. Accordingly, the Coefficient of Determination falls between 0.00 and 1.00 with good models having high values. Further discussion on indices and acceptable values is provided in Byrne (1998), Kelloway (1998) and Schumacker and Lomax (1998). The internal consistency reliability of all scales was explored.
Second, stepwise multiple regression analyses were used to identify those WIHIC and SP AQ scales which were significant predictors of the two outcome scales. Correlations among the WIHIC and SP AQ scales were used to identify significant relationships among these scales. This information was used subsequently to develop a baseline or postulated model for testing with structural equation modelling (SEM) using
LISREL 8.3 (Joreskog & Sorbom, 1989).
12 J. P. Dorman, D. L. Fisher & B. G. Waldrip observed variable. For example, in the present study, the latent variable Involvement was indicated by a composite observed variable computed from the involvement items of the questionnaire.
Holmes-Smith and Rowe (1994) used the theory of Munck (1979) to show that loadings of paths (A.) which link composite observed variables to latent variables and error variances (9) for composite observed variables can be fixed in structural equation modelling. Furthermore, provided correlation matrices are analysed, these parameters are related to scale reliability ® by the formulae
and 9
=
1- r.This means that, provide scale reliabilities are known, paths from composite observed variables to latent variables and error variances of composite observed variables can be fixed. The advantage of this theory is that the number of parameters to be estimated by LISREL is sharply reduced with consequent improvement in model robustness.
As indicated earlier in this section, three fit indices are reported in the present chapter: the Root Mean Square Error of Approximation (RMSEA), the Tucker-Lewis Index (TLI), and the Parsimony Normed Fit
Index (PNFI). While the use of X2 tests to report goodness of fit of the
model to the data is acknowledged as problematic in SEM, it was used in the present study to report improvements to the overall model fit as post-hoc adjustments were made. The squared multiple correlation coefficient
(R2) for each structural equation is also provided. The Total Coefficient of Determination which is the amount of variance in the set of dependent variables explained by the set of independent variables was also computed. In addition to overall fit statistics, it is important to consider the strength and statistical significance of individual parameters in the
model. Each path was tested using at-test (p <0.05).
3. Results
3.1 Confirmatory factor analysis - Measurement models for each scale
Measurement models for each of the 12 scales were tested using LISREL 8.3. Table 1.3 shows values for the RMSEA, TLI, PNFI and Coefficient of Determination for each of these models. Apart from the SPAQ's Diversity scale, all values for RMSEA are at or below the benchmark of
Classroom Environments: A LISREL Analysis 13
0.08. This indicates sound model fit to the data. Additionally, TLI values are very good for all scales with values at or above 0.95. Similarly PNFI values for all measurement models were generally sound. The
" Coefficient of Determination ranged from 0.74 (congruence with planned
learning) to 0.93 (attitude to science), thus indicating good overall models for each scale.
I
Table 1.3. Results ofCFA Measurement Models for 12 Scales
Scale RMSEA TLI PNFI Coefficient of
Detennination Classroom Environment
Student Cohesiveness 0.05 0.98 0.39 0.88
Teacher Support 0.08 0.98 0.49 0.91
Involvement 0.03 0.99 0.50 0.86
Task Orientation 0.07 0.97 0.39 0.87
Equity 0.08 0.98 0.40 0.92
SPAQ
Congruence with Planned
0.08 0.97 0.52 0.74
Learning
Authenticity 0.08 0.98 0.59 0.87
Student Consultation 0.06 0.97 0.52 0.85
Transparency 0.07 0.98 0.53 0.87
Diversity 0.09 0.95 0.45 0.79
Outcomes
Academic Efficacy 0.07 0.98 0.52 0.91
Attitude to Science 0.07 0.98 0.52 0.93
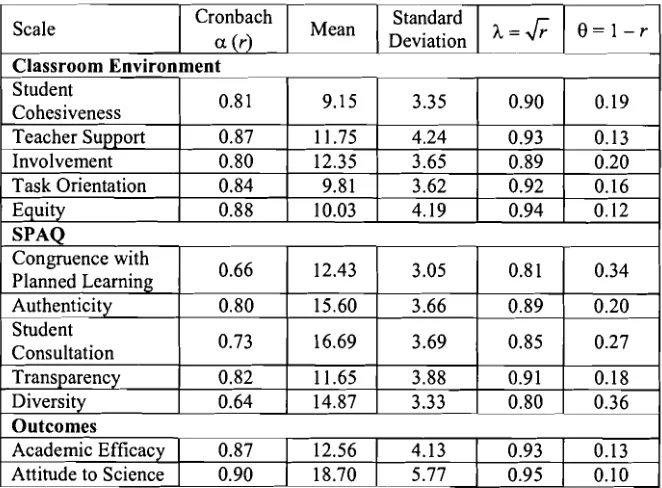
3.2 Scale statistics
Reliability coefficients (Cronbach alpha coefficient) were computed for each scale (see Table 1.4). These results show that all scales had at least satisfactory internal consistency. Indices ranged from 0.66 for Congruence with Planned Learning to 0.90 for Attitude to Science.
Table 1.4 also shows means, standard deviations and values for A. and 9
for each scale according to the theory introduced in the previous section of this chapter.
3.3 Multiple regression analyses
, /
14 1. P. Dorman, D. L. Fisher & B. G. Waldrip predicting academic efficacy and attitude to science were conducted. Separate analyses were performed with the five classroom environment scales and then with the set of five SPAQ scales as predictors of the two outcome variables. Results for the final step of these analyses are shown in Tables 1.5 and 1.6, respectively. The results in Table 1.5 show that Task Orientation was the strongest predictor of both Academic Efficacy
and Attitude to Science (J3 = 0.53 and 0.38, respectively). Student
Cohesiveness, Teacher Support, Task Orientation, and Equity were significant predictors of Attitude to Science. As shown in Table 1.6, the most potent SP AQ predictor of Academic Efficacy and Attitude to
Science was Transparency (J3
=
0.35 and 0.28, respectively). A sizeableproportion of variance in these two outcome variables was accounted for
by the predictor variables with R2
=
0.32 for both models.Table 1.4. Internal Consistency Reliability, Scale Statistics, Fixed Path
Loadings and Error Variances for Five Classroom Environment, Five SP AQ, and Two Outcome Scales
Scale Cronbach Mean Standard
A=J;
9=I-ra (r) Deviation
Classroom Environment Student
0.81 9.15 3.35 0.90 0.19
Cohesiveness
Teacher Support 0.87 11.75 4.24 0.93 0.13
Involvement 0.80 12.35 3.65 0.89 0.20
Task Orientation 0.84 9.81 3.62 0.92 0.16
Egui!y 0.88 10.03 4.19 0.94 0.12
SPAQ
Congruence with
0.66 12.43 3.05 0.81 0.34 Planned Learning
Authenticity 0.80 15.60 3.66 0.89 0.20
Student
0.73 16.69 3.69 0.85 0.27 Consultation
Transparency_ 0.82 11.65 3.88 0.91 0.18
Diversity 0.64 14.87 3.33 0.80 0.36
Outcomes
Academic Efficacy 0.87 12.56 4.13 0.93 0.13 Attitude to Science 0.90 18.70 5.77 0.95 0.10
r
.'
Classroom Environments: A LISREL Analysis 15
Table 1.5. Results of Final Step Regression Analyses for Prediction of Two Outcome Scales by Five Classroom Environment Scales
Outcome R2
Predictor B SEB
fJ
Scale
Academic Teacher Support 0.10 0.04 0.11
Efficacy 0.45 Involvement 0.17 0.05 0.15 Task Orientation 0.61 0.05 0.53 Attitude to Student
-0.14 0.07
-0.08-Science Cohesiveness
0.49 Teacher Support 0.41 0.06 0.31 Task Orientation 0.60 0.07 0.38
Equity 0.27 0.07 0.20
*p<0.05
Table 1.6. Results of Final Step Regression Analyses for Prediction of Two Outcome Scales by Five SPAQ Scales
Outcome R2
Predictor B SEB
fJ
Scale
Academic 0.32 Congruence with
0.16 0.07 0.11-Efficacy Planned Learning
Authenticity 0.13 0.06 0.12 Transparency 0.38 0.06 0.35
Diversity 0.13 0.07 0.10
Attitude to 0.32 Congruence with
0.47 0.10 0.25-Science Planned Learning.
Authenticity 0.25 0.08 0.16 Transl'arency 0.41 0.07 0.28
*p<0.05
3.4 LISREL analyses
-Values for A and
e
for each scale were computed using Munck's (1979)theory described above (see Table 1.4). Apart from Student Consultation, all classroom environment and SP AQ scales were predictors of either Academic Efficacy or Attitude to Science. Correlations among the five classroom environment and five SPAQ scales revealed 14 statistically
significant relationships (p<0.05). One key issue in constructing a
[image:8.824.431.790.100.229.2] [image:8.824.44.375.294.538.2]16 J. P. Dorman, D. L. Fisher , / & B. G. Waldrip
primarily from the classroom environment created by the teacher and students, it was decided to model SP AQ scales as mediating the influence of classroom environment on the outcome variables. Apart from its incorporation of these results, this model hypothesised that academic efficacy would predict attitude to science. The results of the multiple regression analyses and the 14 significant simple correlations suggested the postulated model shown in Figure 1.1. For example, because task orientation was significantly correlated with student consultation, ad arrow links task orientation to student consultation.
A LISREL analysis of the postulated model shown in Figure 1.1 revealed only a mediocre fit to the data with an RMSEA of 0.10. The TLI of 0.96 and PNFI of 0.33 were very satisfactory (see Table 1.7). To improve model fit to the data through post-hoc adjustments, path coefficients were reviewed. Fourteen path coefficients were not statistically significant (p<0.05) and these paths were removed from the model. These paths and revised fit indices for the new model are listed under Model 2 in Table 1.7. This model achieved better fit with a sound RMSEA of 0.08 and an improved PNFI of 0.55.
Two final post-hoc adjustments resulted in the final model which is shown in Figure 1.2. As shown in Table 1.7, Model 3 is Model 2 with two additional paths added within the SP AQ latent variables. All path coefficients of this final model were significantly different from zero
(p<0.05). Model fit, model comparison and model parsimony indices for this final model were sound (RMSEA
=
0.06, TLI=
0.97, PNFI=
0.54). This model should be interpreted as having good fit to the data. The Total Coefficient of Determination for this final model was computed to be 0.96, indicating that the five classroom environment latent variables accounted for 96% of variance in the SPAQ and outcome latent variables. This indicates a very good overall model.In general, the strength and direction of the statistically significant path coefficients are plausible. As shown in Figure 1.2, Involvement did not feature in the final model. Three SPAQ variables (viz. Congruence with Planned Learning, Transparency and Diversity) had direct, positive relationships with Academic Efficacy. It is particularly noteworthy that all path coefficients in the model were positive, indicating that increased levels of the classroom environment variables were associated with increased levels of respective SPAQ and outcome variables. For example, Teacher Support was a moderate, positive predictor of Attitude to Science (j3
=
0.25). Increased levels of Task Orientation had a strong, ,
Classroom Environments: A LISREL Analysis 17
positive effect on Academic Efficacy (j3 = 1.88) which was itself related positively to Attitude to Science (j3 = 0.36).
,
Table 1.7. Summary of Specifications and Fit Statistics for Two Structural Models
Model Actions X2 df RMSEA TLi PNFI
1· 117.50 25 0.10 0.96 0.33
2 Path Task Orientation ~ 138.99 39 6.08 0.96 0.55 Attitude to Science
removed.
Path Authenticity ~
Attitude to Science removed.
Path Transparency ~
Attitude to Sciencc removed.
Path Authenticity ~
Academic Efficacy removed.
Path Involvement ~
Academic Efficacy removed.
Path Teachcr Support ~
Academic Efficacy removed.
Path Involvement ~
Congruence with Planned Learning rcmovcd. Path Involvement ~
Authenticity removed. Path Involvement ~
Student Consultation removed.
Path Teacher Support ~
Student Consultation removed"
Path Involvement ~
Transparency removed. Path Equity ~
Transparency removed. Path Equity ~ Divcrsity removed.
Path Student Cohesiveness ~
Divcrsity removcd.
3·· Path Student Consultation 109.00 37 0.06 0.97 0.54
~ Authenticity added. Path Authenticity ~
Congruence with Planned Learning added. • (Postulated) See Figure 1.1
[image:9.825.430.771.124.552.2]. /
18 1. P. Dorman, D. L. Fisher & B. G. Waldrip
Classroom Environment Scales SPAQ Scales Outcomes Scales
Figure 1.1. Postulated model.
*p<O.05
Note. Observed variables, fixed path loadings from observed variables to latent variables and error variances for observed
r
Classroom Environments: A LISREL Analysis
Classroom Environment Scales
*
p<O.05SPAQ Scales
Figure 1.2. Final model.
Outcomes Scales
19
[image:10.830.447.769.54.539.2] [image:10.830.59.367.79.460.2]-"
20 J. P. Dorman. D. L. Fisher & B. G. Waldrip
It is also useful to consider direct and indirect effects of the
classroom environment scales. For example, the direct effect of Teacher
Support on Attitude to Science (J3
=
0.25) is complemented by smallindirect effect via Congruence with Planned Learning (0.17 x 0.25 =
0.043), and via Congruence with Planned Learning and Academic
Efficacy (0.17 x 0.14 x 0.36 = 0.009 ) (see Figure l.2) . That is, the total
effect of Teacher Support on Attitude to Science is 0.30.
Task Orieptation was by far the most potent classroom environment predictor of Academic Efficacy and Attitude to Science. Task
Orientation had a direct effect on Academic Efficacy (J3
=
1.SS) andindirect effects via Congruence with Planned Learning (0.07), via Authenticity and Congruence with Planned Learning (0.02), via Student Consultation, Authenticity, and Congruence with Planned Learning (0.01), via Transparency (0.31) and via Diversity (0.43). Thus the total effect of Task Orientation on Academic Efficacy is 2.72. Although Task Orientation did not have a significant direct effect on Attitude to Science, the total effect of Task Orientation on Attitude to Science was still
sizeable (2.72 x .36
=
0.9S) due to the multiple pathways from TaskOrientation to Academic Efficacy.
With regard to students' perceptions of assessment, it is noteworthy that only one scale, Congruence with Planned Learning had a direct effect on Attitude to Science. The remaining four scales had only indirect effects via Academic Efficacy. Figure 1.2 also reveals that Student Consultation and Authenticity only had an effect on Academic Efficacy via Congruence with Planned Learning. That is, the effects of Student Consultation and Authenticity were mediated by Congruence with Planned Learning.
The squared multiple correlation coefficient for the prediction of Attitude to Science was computed to be 0.66 which indicates that 66% of variance in Attitude to Science could be explained by Student Cohesiveness, Teacher Support, Equity, Congruence with Planned Learning, and Academic Efficacy. Similarly, as the squared multiple correlation coefficient for the prediction of Academic Efficacy was computed to be O.SO, it can be asserted that over SO% of variance in Academic Efficacy was attributable to Task Orientation, Diversity, Congruence with Planned Learning and Transparency. Overall, Figure 1.2 provides a comprehensive structural model for these three outcome measures based on the data collected in the present study.
',I
Classroom Environments: A LISREL Analysis 21
4. Discussion
Each of the findings illustrated in Figure 1.2 can be discussed in its own
right. It is not surprising that all of the classroom environment scales and
SPAQ scales that feature in the final model related positively with both academic efficacy and attitude to science. Previous research reported in Donnan (2002) and Fraser (199Sb) has sl'lOwn similar positive associations between classroom environment dimensions and attitudinal outcomes, especially attitude to science. Science teachers should consider these results as confirming long held anecdotal views. Teachers who provide support, demonstrate equity in the classroom, ensure that students complete learning activities and engender student cohesion in science classrooms are more likely to enhance their students' academic efficacy at science and attitude to science.
The present study extended previous environment - outcomes
research by including perceptions of assessment as possible mediators. Findings relating specifically to perceptions of assessment indicated that all five SPAQ dimensions influence academic efficacy and attitude to science. Three scales, Congruence with Planned Learning, Transparency and Diversity have direct effects on academic efficacy. However, except for Congruence with Planned Learning, the effects of these scales on attitude to science are indirect.
These results provided evidence for science teachers who wish to enhance the outcomes of students. While classroom environment has been found to influence outcomes, the mediating effect of assessment tasks needs to be included in this discussion. Assessment is part of the fabric of classrooms and students are responsive to the characteristics of assessment. Students want assessment to be consistent with their learning. Assessment tasks that do not match with student learning have a detrimental effect on the confidence of students in successfully perfonning academic tasks. Similarly, authenticity and transparency are important assessment characteristics for students. They want tasks that are related to the real world and which are well-defined and clear. Little previous research has been conducted in this area and further research including replications of the current study is needed to substantiate these findings.
22 J. P. Dorman. D. L. Fisher ,-(' & B. G. Waldrip
found significant relationships between scales of the What Is Happening In this Class questionnaire (Aldridge & Fraser, 2000) and Academic Efficacy. He reported significant positive correlations between Academic Efficacy and Teacher Support, Involvement, Investigation, Task Orientation and Equity. The findings of the present study are consistent with Dorman's earlier findings.
5. Conclusion
~,
This chapter has reported research linking secondary school students' perceptions of classroom environment, assessment, academic efficacy and attitude to science. A relatively new instrument, the Students' Perceptions of Assessment Questionnaire (SP AQ) was used in conjunction with established classroom environment, academic efficacy and attitude to science scales.
The research reported here is important to the study of learning environments because it demonstrates that classroom environment scales can be employed in complex studies in which relationships among several variables are examined simultaneously through structural equation modelling. Furthermore, structural equation modelling allows mediating variables to be included in models. This approach extends traditional regression techniques which involve a set of predictors and a set of dependent variables. However, one cautionary note to the use of these data techniques is that they analyse correlational data collected in ex post facto research designs. Because they do not have a true experimental design no causation can be implied. Further research in a variety of settings will improve our confidence in the specific findings of this study.
With regard to scale validation, this research is one of the few reported attempts to use measurement models within covariance structure modelling to validate scale structure in learning environment research. Typically, exploratory factor analysis has been used with classroom environment instruments to validate their structure. The WIHIC is a well-established, high-inference classroom environment instrument and this study has demonstrated the good structural characteristics of five of its scales. The SPAQ has also been shown to have sound characteristics. While the results of this study confirm the view that the quality of the science classroom environment is important to attitudinal outcomes in
Classroom Environments: A LlSREL Analysis 23
.
science (see Fraser 1998a), they also show tHat the quality of assessment tasks is linked positively to attitudinal outcomes.
References
Adolphe, F. S. G., Fraser, B. J., & Aldridge, J. M. (2003, January). A cross-national study of classroom environment and attitudes among , junior secondary science students in Australia and Indonesia. In D. Fisher & T. Marsh (Eds.), Science. mathematics and technology education for all: Proceedings of the Third International Conference on Science, Mathematics and Technology Education (pp. 435-446). Perth, Australia: Curtin University of Technology.
Aldridge, J. M. & Fraser, B. J. (2000). A cross-cultural study of classroom learning environments in Australia and Taiwan. Learning Environments Research, 3, 101-134.
Allen, D. & Fraser, B. J. (2002). Parent and student perceptions of the classroom learning environment and its influence on student outcomes. Paper presented at the annual meeting of the American Educational Research Association, New Orleans, LA.
Bandura, A. (1997). Self-efficacy: The exercise of control. New York: Freeman.
Barksdale-Ladd, M. A. & Thomas, K. F. (2000). What's at stake in high-stakes testing: teachers and parents speak out. Journal of Teacher Education, 51, 384-397.
Berry, J. M. (1987). A self-efficacy model of memory performance. Paper presented at the annual meeting of the American Educational Research Association, New York.
Black, P. & Wiliam, D. (1998). Assessment and classroom learning. Assessment in Education, 5(1), 7-74.
Boy, A. V. & Pine, G. J. (1988). Fostering psychosocial development in the classroom. Springfield, IL: Charles C. Thomas.
Byrne, B. M. (1998). Structural equation modeling with LISREL, PRELIS. and S1MPLIS: Basic concepts, applications and programming. Mahwah, NJ: Erlbaum.
24 J. P. Dorman, D. L. Fish& & B. G. Waldrip
Crooks, T. 1. (1988). The impact of classroom evaluation practices on students. Review of Educational Research, 58, 438-481.
Dorman, J. P. (2001). Associations between classroom environment and academic efficacy. Learning Environments Research, 4,243-257.
Dorman, J. P. (2002). Classroom environment research: Progress and possibilities. Queensland Journal of Educational Research, 18,
112-140.
Dorman, J. P. (2003). Cross national validation of the What Is Happening In this Class questionnaire using confirmatory factor analysis. Learning Environments Research., 6, 231-245.
Dorman, J. P., Adams, 1. E., & Ferguson, J. M. (2002). Psychosocial environment and student self-handicapping in secondary school mathematics classes: A cross-national study. Educational Psychology, 22, 499-511.
Dorman,1. P. & Knightley, W. M. (2005, September). Development and validation of an instrument to assess students' perceptions of their assessment tasks. Paper presented at the European Conference on
Educational Research, Dublin.
Fisher, D. L. & Waldrip, B. G. (1999). Cultural factors of science classroom learning environments, teacher-student interactions and student outcomes, Journal of Science Education and Technology, 17(1), 83-96.
Fisher, D. L., Waldrip, B. G., & Dorman, J. P. (2005, April). Student perceptions of assessment: Development and validation of a questionnaire. Paper presented at the annual meeting of the
American Educational Research Association, Montreal.
Fraser, B. 1. (1981). Test of Science-Related Attitudes handbook (TOSRA). Melbourne, Australia: Australian Council for Educational
Research.
Fraser, B. J. (1994). Research on classroom and school climate. In D. Gabel (Ed.), Handbook of research on science teaching and learning
(pp. 493-541). New York: Macmillan.
Fraser, B. J. (1998a). Science learning environments: Assessments, Effects and determinants. In B. J. Fraser & K. G. Tobin (Eds.),
International handbook of science education (pp. 527-564).
Dordrecht, The Netherlands: Kluwer.
Fraser, B. J. (1998b). Classroom environment instruments: Development, validity, and applications. Learning Environments Research, 1, 7-33.
Fraser, B. J. & Chionh, Y. H. (2000, April). Classroom environment, self-esteem, achievement, and attitudes in geography and
r
Classroom Environments: A LISREL Analysis 25
mathematics in Singapore. Paper presented at the annual meeting of
the American Educational Research Association, New Orleans, LA. Goh, S. C. & Fraser, B. J. (1998). Teacher intel1lersonal behaviour,
Classroom environment and student outcomes in primary mathematics in Singapore. Learning Environments Research, 1,
199-229.
Goh, S. C. & Khine, M. S. (Eds.). (2002). Studies in educational learning environments: An international pkrspective. Singapore:
World Scientific.
Goodrum, D., Hackling, M., & Rennie, L. (2001). The status and quality of teaching and learning in Australian schools. Department of Education,
Training and Youth Affairs: Canberra.
Harlen, W. (1998). Teaching for understanding in pre-secondary science, In B. J. Fraser & K. G. Tobin (Eds.), International handbook of science education (pp. 183-198). Dordrecht, The Netherlands: Kluwer.
Henderson, D., Fisher, D. L., & Fraser, B. 1. (2000). Interpersonal behaviour, laboratory learning environments and student outcomes in senior biology classes. Journal of Research in Science Teaching, 37,
26-43.
Hobden, P. (1998). The role of routine problems in science teaching. In B. 1. Fraser & K. G. Tobin (Eds.), International handbook of science education (pp. 219-232). Dordrecht, The Netherlands: Kluwer.
Holmes-Smith, P. & Rowe, K. 1. (1994, January). The development and use of congeneric measurement models in school effectiveness research: Improving the reliability and validity of composite and latent variables for fitting multilevel and structural equation models.
Paper presented at the International Congress for School Effectiveness and Improvement, Melbourne.
Joreskog, K. G. & Sorbom, D. (1993). LISREL 8: User's reference guide.
Chicago, IL: Scientific Software International.
Kelloway, E. K. (1998). Using LISREL for structural equation modeling: A researcher's guide. Thousand Oaks, CA: Sage.
Khine, M. S. & Fisher, D. L. (2001, December). Classroom environment and teachers' cultural background in secondary science classes in an Asian context. Paper presented at the annual meeting of the
Australian Association for Research in Education, Perth, Australia. Khine, M. S. & Fisher, D. L. (Eds.). (2003). Technology-rich learning
/
26 J. P. Dorman, D. L. Fisher & B. G. Waldrip
Kim, H., Fisher, D. L, & Fraser, B. J. (2000). Classroom environment and teacher interpersonal behaviour in secondary science classes in Korea. Evaluation and Research in Education, 14, 3-22.
Klopfer, L. E. (Ed.) (1992). A summary of research in science education-1990. Science Education, 76(3),239-338.
Lyman, R. D., Prentice-Dunn, S. Wilson, D. R., & Bonfilio, S. A. (1984). The effect of success or failure on self-efficacy and task persistence of conduct-disordered children. Psychology in the Schools,il,516-519.
Margianti, E. S., Fraser, B. J., & Aldridge, J. M. (2001, April). Classroom environment and students' outcomes among university computing students in Indonesia. Paper presented at the annual meeting of the American Educational Research Association, Seattle, WA.
Marjoribanks, K. (2004). Learning environments, family contexts, educational aspirations and attainment: A moderation-mediation model extended. Learning Environments Research, 6,247-265. Midgley,
c.,
Maehr, M., Hicks, L., Roeser, R., Urdan, T., Anderman, E.M., & Kaplan, A. (1997). Manual for the patterns of adaptive learning survey. Ann Arbor, MI: University of Michigan.
Midgley, C. & Urdan, T. (1995). Predictors of middle school students' use of self-handicapping strategies. Journal of Early Adolescence, 15,389-411.
Multon, K. D., Brown, S. D., & Lent, R. W. (1991). Relation of self-efficacy beliefs to academic outcomes: A meta-analytic investigation. Journal of Counselling Psychology, 18, 30-38.
Munck, I. M. E. (1979). Model building in comparative education: Applications of the LISREL method to cross-national survey data. Stockholm: Almqvist & Wiksell.
Pajares, F. (1996). Self-efficacy beliefs and mathematical problem solving of gifted students. Contemporary Educational Psychology, 21, 325-344.
Plake, B. S. (1993). Teacher assessment literacy: Teachers' compe-tencies in the educational assessment of students. Mid-Western Educational Researcher, 6,21-27.
Popham, W. J. (1997). Consequential validity: Right concern-wrong concept. Educational Measurement: Issues and Practice, 16(2), 9-13.
Classroom Environments: A LlSREL Analysis 27
Radnor, H. (1996). Evaluation of key stage3 assessment in 1995 and 1996.
Exeter: University of Exeter.
Riah, H. & Fraser, B. J. (1998, April). The learning environment of high school chemistry classes. Paper presented at the annual meeting of the American Educational Research Association, San Diego, CA. Reynolds, D. S., Doran, R. L., Allers, R. H., & Agruso, S. A. (1995).
Alternative assessment in science: A teacher is guide. Buffalo, NY: University of Buffalo. .
Roeser, R. W., Midgley, C., & Urdan, T. (1996). Perceptions of the school psychological environment and early adolescents' self-appraisals and academic engagement: The mediating role of goals and belonging. Journal of Educational Psychology, 88, 408-422. Rogoff, B. (2001, September 14). Student assessment for the information
age. The Chronicle of Higher Education, 48(3), p. B 17.
Schaffuer, M., Burry-Stock, lA., Cho, G., Boney, T., & Hamilton, G. (2000, April). What do kids think when their teachers grade? Paper presented at the annual meeting of the American Educational Research Association, New Orleans, LA.
Schumacker, R. E. & Lomax, R. G. (1996). A beginner's guide to structural equation modeling. Mahwah, NJ: Erlbaum.
Schunk, D. H. (1989). Self-efficacy and cognitive skill learning. In C. Ames & R. Ames (Eds.), Research on motivation in education. Vol. 3, Goals and cognitions (pp. 13-44). San Diego, CA: Academic. Schunk, D. H. (1995). Self-efficacy and education and instruction. In J.
E. Maddux (Ed.), Self-efficacy, adaptation, and adjustment: Theory, research, and application (pp. 281-303). New York: Plenum.
Schunk, D. H. (1996, April). Self efficacy for learning and performance. Paper presented at the annual meeting of the American Educational Research Association, New York.
Schunk, D. H. & Hanson, A. R. (1985). Peer models: Influence on children's self-efficacy and achievement. Journal of Educational Psychology, 77,313-322.
Schunk, D. H. & Rice, J. M. (1993). Strategy fading and progress feedback: Effects on self-efficacy and comprehension among students receiving remedial reading services. Journal of Special Education, 27, 257-276.
/ '
28 J. P. Donnan, D. L. Fisher & B. G. Waldrip
Stiggins, R. (1994). Student-centered classroom assessment. Ontario: Macmillan College Publishing Co.
Temons, M. J. (2005, April). Efficacy of using technology in secondary science in terms of learning environments and student attitudes. Paper presented at the annual meeting of the American Educational Research Association, Montreal, Canada.
Waldrip, B. G. & Fisher, D. L. (2002). Student-teacher interactions and better s.cience teachers. Queensland Journal of Educational Research, 18, 141-163.
Webster, B. J. & Fisher, D. L. (2004). School-level environment and student outcomes in mathematics. Learning Environments Research, 6,309-326.
Wong, A. F. L. & Fraser, B. J. (1996). Environment-attitude associations in the chemistry laboratory classroom. Research in Science and Technological Education, 14, 91-102.
Zandvliet, D. B. & Fraser, B. J. (in press). Learning environments in IT classrooms. Technology, Pedagogy and Education.
Zeldin, A. L. & Pajares, F. (2000). Against the odds: Self-efficacy beliefs of women in mathematical, scientific and technological careers. American Educational Research Journal, 37, 215-246.