IMPLANTS FOLLOWING PLACEMENT- AN EX-VIVO STUDY
Dissertation submitted to
THE TAMILNADU Dr. M.G.R. MEDICAL UNIVERSITY
In partial fulfilment for the degree of
MASTER OF DENTAL SURGERY
BRANCH V
DEPARTMENT OF ORTHODONTICS
APRIL 2015
IMPLANTS FOLLOWING PLACEMENT- AN EX-VIVO STUDY
Dissertation submitted to
THE TAMILNADU Dr. M.G.R. MEDICAL UNIVERSITY
In partial fulfilment for the degree of
MASTER OF DENTAL SURGERY
BRANCH V
DEPARTMENT OF ORTHODONTICS
APRIL 2015
IMPLANTS FOLLOWING PLACEMENT- AN EX-VIVO STUDY
Dissertation submitted to
THE TAMILNADU Dr. M.G.R. MEDICAL UNIVERSITY
In partial fulfilment for the degree of
MASTER OF DENTAL SURGERY
BRANCH V
DEPARTMENT OF ORTHODONTICS
This is to certify that this dissertation titled “EVALUATION OF DEFLECTION CHARACTERISTICS OF MINI IMPLANTS FOLLWING PLACEMENT- AN
EX-VIVO STUDY”is a bonafide work done by Dr. ANISHA N. PRASAD under my guidance during her post graduate study period between 2012-2015.
This dissertation is submitted to THE TAMIL NADU Dr. M.G.R. MEDICAL UNIVERSITY in partial fulfilment for the degree of Masters in Dental Surgery, in Branch V- Orthodontics and Dentofacial Orthopaedics.
It has not been submitted either partially or fully for the award of any other degree or diploma.
Dr. R. K. VIJAYAKUMAR, MDS. Dr. V. PRABHAKAR, MDS.
Guide, Professor and Head Principal
Department of Orthodontics, Sri Ramakrishna Dental College
Sri Ramakrishna Dental College Coimbatore
Coimbatore
Date:
First and foremost I offer my humble gratitude to the ALMIGHTY GOD above for His inspiration and blessings which enabled me to begin and complete my dissertation.
With exaltation, I express my gratefulness to my HOD and Guide, Dr. R. K. VIJAYAKUMAR, MDS,Department of Orthodontics and Dentofacial Orthopedics, for his able and constant guidance, patience and constant support throughout my study. I shall forever remain indebted to him for his help.
My thesis would not have taken shape but for the helpful suggestions and timely advice offered by Dr. JAGADEEP RAJU, MDS and Dr. D. PRADEEP KUMAR, MDS,Readers of the Department.
I am extremely grateful to Dr. S. FAYYAZ AHAMED, MDS, Dr. APROS KHANNA MDS, Senior Lecturers and Dr. SAM THOMAS, MDS former Senior Lecturer for bearing with me in making corrections during my work.
I wholeheartedly thank the managing trustee Mr. Sounder Rajan, Dean Dr. Sukumaran P, and Principal Dr. V. Prabhakar, for providing the opportunity to utilize the radiographic facilities available in Sri Ramakrishna hospital for my work. I also thank the staff at the Department of radiology for taking the time and effort to help me with my thesis.
Dr. Yamuna P, Dr. Pradeep K, Dr. M. Yaseen , Dr. Khaniya B, Dr. Sangeeth S andDr. M. Bava who have helped me throughout my course.
I acknowledge and salute MY PARENTS and family who are largely responsible for what I am today and for their love and guidance. My heartfelt gratitude for my grandfather who I am sure will continue to shower his blessings from his recent abode above. Special mention for the love, encouragement and sacrifice of my husband Mr. G. R. DHARANIDHARAN and his family for their support in helping me achieve my dream.
1. INTRODUCTION 1
2. REVIEW OF LITERATURE 5
3. MATERIALS AND METHODS 32
4. RESULTS 47
5. DISCUSSION 66
6. SUMMARY AND CONCLUSION 74
The movement of teeth during orthodontic therapy occurs primarily through the application of forces. In order for these forces to cause changes in tooth position, adequate support must be available from which these forces can be applied. Hence, ever since its origin, the field of orthodontics and dentofacial orthopaedics has focussed on the importance of anchorage and the consequences of its loss. This anchorage can be derived from other teeth, extraoral sources or from skeletal structures. But these forces also act reciprocally on the anchoring structures thereby causing undesirable movement of such structures.
Hence, the concept of skeletal anchorage was introduced to offer capabilities for treatment unavailable previously. Various methods for obtaining skeletal anchorage like endosseous implants, bone screws used for fixation in surgery were tried initially and now mini implants especially manufactured for orthodontic anchorage are readily available. This helps forces to be applied to produce tooth movement in any direction without detrimental reciprocal forces.
The possibility of skeletal anchorage was explored by Creekmore and Eklund (1983) 1 by using a Vitallium (Cobalt-Chromium) screw for intruding
anterior teeth in the maxilla. Kanomi (1997)2 clinically demonstrated the first successful use of orthodontic mini implants with a diameter of 1.2mm and 6mm in length for mandibular incisor intrusion with no root resorption or periodontal pathologies.
Most present mini implants are fabricated from either commercially pure titanium [cpTi / Ti grade 4] or titanium alloy [Ti-6Al-4V / Ti grade 5]. They have excellent corrosion resistance and are highly biocompatible. A protective surface oxide layer develops when it comes into contact with oxygen or tissue fluids and even if it is lost, it is regenerated within milliseconds due to its affinity towards oxygen and nitrogen. Titanium grade 4 has tensile strength of 550 MPa whereas Titanium grade 5 has a tensile strength of 910 MPa.
Both have a similar Young’s modulus of 100-110 GPa .Titanium alloy offers greater strength, more favourable surface condition, stress-strain behaviour and wear resistance.
Depending on the method of insertion two types of mini implants are available: self-drilling and self-tapping. Self drilling mini implants have a cutting tip and can be inserted directly into the bone. Self-tapping implants need implant site preparation with the use of a drill to make a pilot hole following which the implant is then inserted.Self drilling implants offer numerous advantages like easy insertion technique, increased tactile sensation and no additional armamentarium is necessary.
The thickness of the cortical bone in the maxilla is generally lesser than in the mandible.
Insertion torque is the result of frictional resistance between screw threads and bone and is reported to determine primary stability. Insertion and removal should be done at a slow steady rate with a continuous force so that the load on both the screw and bone will be low. All mini screws are susceptible to breakage upon reaching a certain torque level. However there is a range of safety between recommended insertion torque and maximum insertion torque. McManus et al4 reported that the mean maximum placement torque in the maxilla was 4.6 Newton centimetres [Ncm] and in the mandible it was 8.64 Ncm. Friberg et al5 described a positive correlation between mini-implant insertion torque and bone density values, and concluded that methods used to measure torque during mini-implant placement should be used routinely.
When an implant is inserted into bone, due to the resistance offered by the bone, the implant is liable to undergo deviation from its original path. This interaction between the implant and bone is dependent on both the length and diameter of the implant. Due to its size, despite the use of titanium, the flexural strength of the mini implant is decreased. Consequently, the maximum force required to cause permanent deformation also decreases. This deflection or deformation can ultimately lead to fracture or failure of the mini implant.
that majority of the mini implants for orthodontic usage are placed in inter-dental areas, a slight deflection from the intended path can thus affect their success.
Creekmore TD and Eklund MK1 (1983) attempted to determine if a
metal implant could withstand a constant force over a long period of time of adequate magnitude to depress an entire anterior maxillary dentition without becoming loose, infected, painful, or pathologic. A surgical Vitallium bone screw was inserted just below anterior nasal spine and they achieved 6mm intrusion over a one year period.
Park HS7 (1999) treated a case with skeletal cortical anchorage using
titanium microscrew implants. During six months of orthodontic force application from skeletal cortical anchorage, the author could get 4mm bodily retraction and intrusion of upper anterior teeth. The titanium microscrew implants and remained firm and stable throughout treatment. These results indicated that skeletal cortical anchorage might be a very good option.
Favero et al8 (2002) reviewed implant related studies published between the years 1970-2002 and found that the maximum load that can be applied is influenced by the amount of implant-bone contact which is in turn affected by the screw length, diameter and shape. An inverse relationship existed between diameter and length. Finally the selection of screw is also dependent on the availability of bone in that particular region.
Fanuscu9 (2003) quantified the elastic properties of maxillary and
were analyzed. The mean overall elastic moduli were 14. 76 GPa for cortical bone and 15.37 Gpa for cancellous bone. They concluded that the overall values for modulus of elasticity and hardness varied mildly with the possibility of site-specific differences.
Miyawaki et al10 (2003) examined the success rates and factors associated with the stability of titanium screws placed into the buccal alveolar bone of the posterior region. Three kinds of titanium screws 1.0x6mm, 1.5x11mm and 2.3x14mm were evaluated. The screws were placed into the buccal alveolar bone through attached gingiva in the second premolar to second molar region of the maxilla or the mandible. They concluded that the diameter of a screw of 1.0 mm or less, inflammation of the peri-implant tissue, and a high mandibular plane angle (i.e., thin cortical bone), were associated with failure of the titanium screw.
Kanie et al11 (2004) compared the mechanical properties of two
prosthetic mini implants of sizes 1.8mm x 21mm and 1.8mm x 22mm. They determined flexural strength, elemental composition, surface characteristics. They found that maximum strength and proportional limit varied significantly.
Liou et al12 (2004) inserted miniscrews on the maxillary zygomatic
Schnelle et al13 (2004) did a panoramic radiographic evaluation of the
availability of bone for mini implant placement in 30 patients. 14 inter-radicular sites were measured using a digital caliper and the existence of 3-4mm interradicular bone was considered as the minimum requirement. They found that this minimum requirement was present only in posterior regions mesial and distal to maxillary and mandibular first molar. They concluded that the clinician needs to be aware that it may not be possible to place mini screws always in attached gingival due to lack of sufficient inter-radicular bone.
Costa et al14(2005) evaluated hard and soft tissue thickness for implant
placement. The bone depth was quantified by volumetric computed tomography (VCT). The mucosal depth was quantified by a needle with a rubber stop. The results indicate that bone thickness will allow mini screws 10 mm in length only in the symphysis, retromolar, and palatal premaxillary regions. Screws 6 to 8 mm in length can be placed in the incisive fossa, in the upper and lower canine fossae. When placing temporary anchorage devices in mobile alveolar mucosa, the results suggest that a transmucosal attachment may be required to traverse the thickness of the soft tissue.
Melsen15 (2005) in an overview article on mini implants gave a brief
Deguchi et al16(2006)used computed tomgraphic scans from 10 adults to
measure the cortical bone thickness of various potential mini screw placement sites in the maxilla and mandible. They took measurements at at the occlusal level (3-4 mm apical to the gingival margin) and at the apical level (6-7 mm apical to the gingival margin). Significantly less cortical bone was seen in the maxillary buccal region at the occlusal level distal to the second molar when compared with other areas in the maxilla.
Additionally, maxillary cortical bone was significantly thicker on the lingual side of the
second molar site when compared to the buccal side. In the mandible, there was significantly
more cortical bone mesial and distal to the second molar when compared with the maxilla.
Morais et al17 (2006) analysed immediately loaded commercially pure titanium and titanium alloy implants fixation and gauged the vanadium ion release during the healing process in the tibiae of rabbits. A stress analysis was done to predict the torque at which both types deform plastically and the shear strength at the interface. It was found that removal torque of commercially pure titanium was close to its yield stress and that the concentration of vanadium from the titanium alloy mini implants did not reach toxic levels in the animals.
Park et al18 (2006)evaluated the factors affecting the clinical success of
Poggio et al3 (2006) did a study to determine the safe zones for mini
implant placement using computed tomography. In the maxilla, the greatest amount of bone was seen on the palatal side between second premolar and first molar and least was seen in the tuberosity region. In the mandible, the greatest thickness of bone was noted between first and second premolars and the least bone was observed between first premolar and canine.
Cornelis et al19(2007)did a systemic review of the experimental usage of
temporary skeletal anchorage devices from electronic databases. Diameters and lengths of screws used varied between 1-2.2mm and 4-10mm respectively. The healing times reported ranged from 0-12weeks, amount of force applied varied from 25-500g. Direct bone-screw contact was reported to be 10-58%. They concluded that long term bone-implant adaptation has not yet been well categorized and future research needs to target specific issues with well controlled experimental models.
Kuroda et al6 (2007)evaluated root proximity as a risk factor for failure
of mini screws in 116 patients with a total of 216 titanium screws. Each screw was classified according to its proximity to the adjacent root into three categories. They found that the average success rate for the screws was 80% and maxillary screws had greater success than mandibular screws. The concluded that proximity of screw to the root was indeed a major risk factor and also that this tendency was more obvious in the mandible.
tomography examination, mini implants 1.6x8mm were inserted and orthodontic force was applied for 6 months. They found the success rate higher in implants with insertion torque 8-10Ncm and also when the bone had a minimal cortical bone thickness of 1mm.
Song et al21(2007) evaluated the effect of cortical bone thickness on the
maximum insertion and removal torque of different types of self-drilling mini-screws and determined if torque depends on the screw design. Titanium alloy cylindrical and tapered screws of dimensions 1.5x6mm, 1.6x6mm and 1.6x7mm were inserted into artificial bone blocks. The mini-screw tip was placed perpendicular to the artificial bone sample, and was inserted to the end of the screw thread by rotating the torque tester and insertion torque was noted. Removal torque was similarly noted by rotating the driver in the opposite direction. They found that a tapered form, with the outer diameter increasing, is the design that increases the torque the most.
Elias et al22(2008)enumerated some of the materials used for biomedical
applications with emphasis on the importance of titanium and its alloys and their use in the field of implant dentistry. They stated that orthodontic implants are mainly composed of titanium alloy instead of pure titanium due to the former’s superior strength. However its corrosion resistance is lower allowing for metal ion release. They proposed the use of ultrafine grain titanium due to its superior biocompatibility and higher mechanical properties than commercially pure titanium.
The cemento-enamel junction interproximally of each tooth was determined as the reference point for measurements. In the maxilla the mean cortical bone thickness was below 1 mm at the 6 mm location while at 9 mm and 12 mm locations the mean cortical bone thickness varied from 0.78 mm to 1.31 mm. There was a wide range of measurements in the mandible from 0.62 mm to 3.65 mm with the majority of the means over 1mm. The mandible overall had more thickness of the cortical bone than the maxilla.
Lim et al24 (2008) determined the variation in the insertion torque of cylindrical and tapered orthodontic mini screws according to the screw length, diameter. Cylindrical and tapered screws of various diameters and length were inserted into artificial bone blocks and the torque was measured. In both types of screws, the maximum insertion torque increased with increasing diameter and length of the orthodontic miniscrews as well as increasing cortical bone thickness. A significant increase in insertion torque was seen mainly in the taper type miniscrew. They concluded that, increase in screw diameter can efficiently reinforce the initial stability of miniscrews, but the proximity of the root at the implant site should be considered.
Park et al25 (2008) quantitatively evaluated density of the alveolar and
1560 HU at the basal bone. Cortical bone of the mandible was denser than that of the maxilla, whereas cancellous bone had similar densities between the mandible and the maxilla. Basal bone generally showed higher density that alveolar bone. They stated that these data could provide valuable information when selecting sites and choosing placement methods for miniscrews.
Prates de Nova et al26 (2008)evaluated mini-implants of different sizes
for insertion, removal, fracture torque, shear tension, and type of fracture. Twenty commercial self-drilling mini-implants of 1.6mm diameter and 7mm and 8mm lengths with and without necks were inserted into bovine tibias. To ensure mini-implant insertion into cortical bone alone, a hole was drilled in the center of the bone specimen. The mini-implant was inserted following perforation with the insertion key attached to the handpiece with a torquimeter. The mini-implants were removed with the same hand piece using the reverse rotation option microscopy. Mini implants with neck showed the greatest insertion torque. All mini implants showed removal torques lesser than insertion torques and experienced ductile fracture.
Pithon et al27 (2008) designed a study to assess the deformation and
strength afforded by these devices when perpendicular forces were applied along their axes.
Pithon et al28 (2008) assessed the maximum torsional strength of orthodontic implants of different diameters. Eighteen titanium alloy
mini-implants measuring 10 mm in length and diameters of 1.2mm, 1.4mm, and 1.6 mm
were used. Mini-implants with greater diameter had the highest mean torsional values,
whereas those with smaller diameter had the lowest ones. The torsional strength
analysis for mini-implants has showed that fracture torque is relatively high compared
to that used for mini-implants inserted in osseous substrates. Furthermore, the use of
greater-diameter mini-implants provides safer conditions regarding fracture.
Salmoria et al29 (2008) did a study to evaluate insertion torque of
mini-implants for orthodontic anchorage, to compare their axial pull-out strength, to determine initial and peri-implant cortical bone thickness, and to analyze the correlations among these variables. Sixty self tapping titanium alloy screws 1.6 mm diameter and 6.0 mm length were placed in the mandibles of 10 dogs. Peak insertion torque values were recorded. Cortical bone thickness was measured after removal of the mini implants.
Wilmes et al30 (2008) analyzed the impact of implant design of six
commercially available mini implants on primary stability using porcine rib. They observed that conical implants had higher primary stability than cylindrical ones. They concluded that the diameter and design of mini implant thread have an impact on primary stability. Depending on the region of insertion and local bone quality, the choice of mini implant is crucial.
Baumgaertel et al31 (2009) investigated the buccal cortical bone
thickness of every interdental area as an aid in planning mini-implant placement using cone-beam computed tomography scans of 30 dry skulls. They found that buccal cortical bone thickness was greater in the mandible than in the maxilla. The thickness increased with increasing distance from the alveolar crest in the mandible and in the maxillary anterior sextant, it behaved differently in the maxillary buccal sextants; it was thinnest at the 4-mm level. They proposed that future studies are needed to determine the exact relationship between cortical bone thickness, the method of implant site preparation, and success rates.
Chen et al32 (2009) published a review article on the factors critical to
between the canine and the first premolar. Mini implants with a diameter less than 1.5 mm were intended for tooth-bearing areas, particularly in the inter-radicular area.
Hu et al33 (2009)elucidated the relationship between dental roots and the surrounding tissues to prevent complications after mini screw placement.200 cross sections of human maxillae and mandibles from 20 individual bones were obtained. The inter-root distance, total bucco-lingual bone width, cortical bone thickness and mucosal thickness was measured. It was seen that for all the above mentioned parameters the values increased from anterior to the posterior region and also from the cervical region to the tooth apex.
Luzi et al34 (2009) provided an overview regarding the guidelines for
success in mini implant placement. 137 patients were treated using self-drilling mini implants of lengths either 9.6mm or 11.6mm and diameters either 1.5mm or 2mm. All mini screws were immediately loaded to achieve various dental movements. They recorded a 9% failure rate and divided the possible causes into factors related to clinician, the patient and the screw itself. They concluded that large multicenter studies are needed to gain information on skeletal anchorage and reduce failure rates.
Mayer et al35 (2009) evaluated the implant angulations and alignments
Results revealed that maxillary implants were more divergent than mandibular implants. Implants placed away from the clinician’s side had smaller guage-implant discrepancies than those on the ipsilateral side. Implants placed in the anterior region diverging more than those in the premolar and molar regions and those placed adjacent to teeth had greater divergence than implants in the edentulous region. They proposed that placement of implants without the use of a guide can result in adequate dental implant angular relationships. However, an implant’s location and the presence of adjacent teeth can affect the angular relationships.
Reyenders et al36 (2009) reviewed the literature to quantify success and
complications with the use of mini-implants for orthodontic anchorage, and to analyze factors associated with success or failure. Adverse effects of miniscrews included biologic damage, inflammation, and pain and discomfort. Only a few articles reported negative outcomes. They concluded that interpretation of findings was conditioned by lack of clarity and poor methodology of most studies.
Cha et al37(2010)determined the effect of bone mineral density, cortical
The authors concluded that bone mineral density of cortical bone, screw type, and screw position significantly influence the primary stability of mini screws.
Crismani et al38 (2010) did a systematic review of effects related to patient, screw, surgery, and loading on the stability of miniscrews. The mean overall success rate was 83.8%-67.4%. Patient sex showed no significant difference. Screw diameters of 1 to 1.1mm yielded significantly lower success rates than those of 1.5 to 2.3 mm. Screw placement with or without a surgical flap showed contradictory results between studies. Three studies showed significantly higher success rates for maxillary than for mandibular screws. Loading and healing period were not significant in the miniscrews’ success rates. Authors proposed that screws under 8 mm in length and 1.2 mm in diameter should be avoided. Immediate or early loading up to 200 cN was adequate and showed no significant influence on screw stability.
Laurito et al39(2010)determined the feasibility of temperature recording
during implant site preparation using bovine bone using a fluoroptic thermometer. They found the method to be appropriate for real time temperature data recording and concluded that further studies are needed to define standardized procedures.
Lee et al40 (2010) investigated the effects of the diameter and shape of
measured by using micro computed tomography, and histomorphometric analyses of the cracks were performed.
There was a significant increase in maximum insertion torque correlated to increased diameter and taper. Similarly, there was a significant increase in the number of cracks with increased diameter and tapering. They concluded that further studies about the effect of micro damage on bone remodelling and stability of the mini screws are needed.
Motoyoshi et al41(2010)measured the placement and removal torques of mini-implants placed in buccal posterior alveolar bone of fifty seven patients and assessed the relationships among placement and removal torques, placement period, age, sex, and cortical bone thickness. Computerized tomography was used to measure the cortical bone thickness. A torque screwdriver was used to measure the peak torque values. The mean placement and removal torques were 8 and 4 N cm, respectively. A torque of 4 N cm suggested sufficient anchorage capability for mini-implants. No significant correlation between placement and removal torques was found. Placement torque was significantly related to age and cortical bone thickness in the maxilla, whereas removal torque was not significantly related to placement period, age, sex, or cortical bone thickness.
Qamaruddin et al42 (2010) published a literature review regarding the
inadvertent injury to root, or perforation of sinus. With regards to operator related causes, implants needed to be inserted without wiggling or overheating of the bone and a self drilling mini implant was preferable for a flapless procedure.
Barros et al43 (2011) evaluated the effect of mini implant diameter on
fracture risk and self drilling efficiency. 405 titanium alloy mini-implants with 9 diameters from 1.2 to 2.0 mm of length 8mm were used. Ten mini-implants of each diameter were placed in artificial bone, and twenty five were placed in pig iliac bone to evaluate placement torque and axial placement load. Increases in diameters significantly affected the placement and fracture torque and reduced the fracture risk for each 0.1-mm change in diameter. The diameter had more influence on fracture risk than on drill-free placement efficacy. Placement torque and placement load showed antagonistic behaviour during drill-free placement characterized by progressive torque increases and gradual axial load reductions.
Chatzigianni et al44(2011)investigated the influence of implant diameter
At low force levels, no significant difference in displacement was noted between the various implants. At higher force levels (2.5N), the 9mm long and 2mm wide mini implants were displaced less than the 7mm long and 1.5mm wide ones. The results showed that implant length and diameter were significant influencing factors on stability when force level exceeded 1N.
Chatzigianni et al45 (2011) compared numerical simulation data derived
from finite element analysis to experimental data on mini implant loading. The purpose was to investigate the effect of implant length, diameter and method of insertion on the primary stability of Aarhus and LOMAS mini implants, each of 1.5mm diameter and lengths 7mm and 9mm. The implants were inserted in bone either perpendicular or at 45° to the surface. A force of 0.5N was applied to the neck of the mini implant, parallel to the bone surface using closed nickel-titanium springs and a similar condition was simulated in the finite element method. Both the results showed that at low force levels, there was no statistical significance in implant displacement according to length, diameter and insertion angle. Rotation of implant was influenced by implant type- LOMAS mini implants rotated more than the Aarhus ones.
Farnsworth et al46 (2011) did a CBCT evaluation of cortical bone
patient. Adult cortical bone showed increased thickness compared to adolescent bone in all areas except infrazygomatic crest, mandibular buccal and posterior palate. In both groups, cortical bone appeared thicker in the posterior than anterior region. Anterior paramedian palatal bone was significantly thicker than bone located more posteriorly. They concluded that the mandibular buccal and infrazygomatic crest regions had the thickest cortical bone and the differences between the other areas were small. Also adults had thicker cortical bone when compared to adolescents.
Lemieux et al47 (2011) used computed tomography imaging to measure placement pattern, bone density, and thickness surrounding sixty mini implants. 1.8mm diameter implants of lengths 6, 8, and 10mm were placed in the maxilla and mandible of 5 human cadavers. Results showed that shorter mini implants tended to have lesser penetration into buccal cortical bone compared to longer implants but they also posed lesser chances of damages to surrounding structures and bicortical perforations. The most important factors in determining maximum mechanical anchorage were found to be bone density placement depth, and mini implant length.
McManus et al4 (2011) explored the relationship between maximum
Mean buccal cortical bone thickness and mean maximum screw placement torque were significantly greater in the mandible than in the maxilla. Mean mandibular screw resistance to movement was significantly greater than in the maxilla. The principal finding of this ex-vivo study was that mini screws with higher placement torque values provided greater mean resistance to movement than did screws with placement torque values lesser than 5 Ncm.
Suzuki et al48 (2011) analyzed the placement and removal torque values
of 280 orthodontic minscrew implants in the maxilla and mandible of patients. Both self drilling and pre-drilling screws of 1.5mm in diameter and 6 or 8mm length were used. Maximum insertion torque and maximum removal torque were assessed with a torque wrench. For both the pre-drilling and self-drilling miniscrews, the maximum removal torque was higher than the maximum insertion torque. Though, maximum placement torque values were found to be greater for self- drilling implants, the maximum removal torque values were found to be higher for the pre-drilling screws. They concluded that placement torque was a valid parameter to assess the quality of recipient bone.
mini implant. The fracture torque ranged from 108.9Nmm (for 1.3 x 11mm screws) to 640.9Nmm (for 2.0 x 11mm screws). They concluded that the risk of mini implant fracture should be considered if implants of smaller diameters are used. In case of high bone density, pre-drilling should be done to avoid implant breakage.
Whang et al50 (2011) compared the peak insertion torque values of six commercially available self-drilling mini-implants.. Twenty implants each were drilled into acrylic rods and the insertion torque values were recorded. The mini-implant was lowered until it was in contact with the substrate material and then held to maintain the pressure.Significant differences were found for peak torque values between the different implant manufacturers. This study failed to demonstrate an inverse correlation between the diameter of the mini-implants and their peak torque values. It hence appears that factors such as material composition, production technique, and the ratio between core and thread play an important role in determining the torque resistance of mini-implants.
Woodall et al51(2011)did an experimental study on cadavers and a three
Chang et al52(2012)evaluated the effect of thread depth, taper shape and
taper length on the mechanical properties of mini implants using both finite element method and mechanical testing using artificial bone blocks. Titanium alloy mini implants of size 2mm x 9.82mm and pitch 0.75mm were used. The thread depths were varied as 0.16, 0.24, 0.32, 0.40 and 0.48mm and the taper was varied as 0°, 3°, 5°, 7°, 11°. Mini implants with greater thread depths, smaller tapers and shorter taper length generated higher maximum stresses on the bone and threads elements and also had larger relative displacements.
Jasmine et al53 (2012) generated finite element models of maxilla,
mandible and mini implant to simulate orthodontic loading for en-masse retraction and to simulate the stress patterns in the bone and microimplant immediately after loading with different insertion angulations. AbsoAnchor mini implants of diameter 1.5mm and lengths 7mm and 8mm were considered. The authors found that the stress levels both in microimplant and cortical bone decreased as insertion angle increased from 30° to 90°. Also as the insertion angle increased, little stress was transmitted to the cancellous bone. Hence they concluded that mini implants should be placed as perpendicular to the bone as possible for better stability.
Kim et al54 (2012) measured the cortical bone thickness in 15 men and
bone thickness increased from canines to molars. The lingual cortical bone thickness was greatest between 1stand 2ndpremolars.
Liu et al55 (2012) investigated the role of bone quality, loading conditions, screw effects using finite element analysis. A three dimensional bone block with cortical and cancellous bone in varying degrees was modelled. Pure titanium screws of diameters 1.2, 1.5 and 2mm and lengths 7, 9, 11, 13 and 15mm were modelled. Force magnitudes of 2, 4 and 6N and directions of 60°, 90° and 120° were loaded. Maximum stress around screw and bone occurred under 2N and 90° force near the entrance of screw to cortical bone. Stress in cancellous bone was much lesser than cortical bone and both stress and displacement increased with increasing cortical bone thickness.
Migliorati et al57 (2012) evaluated the correlations between bone
characteristics, orthodontic mini screw designs, and primary stability. Four different miniscrews of sizes 1.7x10mm, 1.65 x9mm, 1.6x10mm and 1.8x10mm were placed in pig ribs. The miniscrews were first scanned with a scanning electron microscope to obtain measurable images of their threads and then inserted to a depth of 7mm. Maximum insertion torque and pull out force was measured for each screw. A positive correlation between the pitch of the mini screw and maximum insertion torque values was found. A strong correlation between maximum insertion torque and pullout force was noted. A direct correlation among cortical thickness, marrow bone density, and pullout force was observed. Differences in cortical bone thickness were more relevant for initial stability of the miniscrews than cortical bone quality.
Papageorgiou et al58 (2012) summarized the knowledge from published clinical trials regarding the failure rates of miniscrew implants used for orthodontic anchorage purposes and attempted to the factors that possibly affect them. An overall failure rate of 13.5% was seen. Higher overall failure rates were observed when the miniscrews were inserted in the mandible than in the maxilla. No significant difference was found between the failure rates of self-drilling and not self-drilling miniscrews. Lastly, no significant differences of the failure rates of implants were observed concerning the time of orthodontic force application: ie, immediate and delayed loading.
stability was mainly determined by bone quality and quantity and a positive correlation was found between primary stability and cortical bone thickness. The literature regarding primary stability and implant design was filled with contradictory conclusions. Cylindrical and surface roughened implants were seen to have lower failure rates. Also it was confirmed by many studies that implant diameter mainly and not implant length influences primary stability. However other studies showed that shorter implants fail more often than longer ones.
Reyenders et al60 (2012) published a systematic review article about the insertion torque and success of mini implants and analysed whether the recommended maximum insertion torque values of 5 to 10Ncm were associated with higher success rates compared to mini implants inserted at torque values beyond this range. They concluded that an association between maximum insertion torque values and success was analysed only in nonrandomized studies of low quality and that success is a subjective recording and should not be considered as a reliable factor for testing associations with maximum insertion torques. Subsequent studies should be done with a digital torque sensor and the review should be considered as a negative study as no evidence based conclusions could be drawn.
Shah et al61 (2012)did a study to determine the effect of altering implant
significantly increased the primary stability. Decreasing the cortical thickness and density also resulted in lower insertion torque and pull out strength.
Singh et al62 (2012) analyzed the stress distribution and displacement patterns that develop in miniscrew implant made of stainless steel and titanium alloy and its surrounding bone. It was seen that stress distribution was not significantly different between the 2 types of implant material. Increased stress values were located at the necks of the implants and the surrounding cortical bone. Stainless steel screws had greater stress compared to titanium alloy screws. Bending of the titanium miniscrew was observed in the neck region under horizontal traction. Amount of stress transferred to cancellous bone was minimal.
Tachibana et al63 (2012) measured the placement torque value of
Lin et al64 (2013) did a finite element study and factorial analysis to
determine the effect of exposure length of mini implant, insertion angle and the direction of orthodontic force. Stainless steel implants of diameter 2mm and lengths 8, 10, 12mm were modelled. Computed tomographic images were obtained for the mandible. Insertion of mini implant was simulated between premolar and molar at 60°, 90° and 120° with thread depth of insertion at 3mm, 5mm and 7mm and orthodontic force of 2N was applied to the top surface of the mini implant and inclined in the proximal direction to imitate en masse retraction.
They found that maximum stress occurred when the exposure length of the mini implant was 7mm and as the length decreased, the stress also decreased. Stress in cancellous bone was greatest with insertion angle of 60°. Most stresses were concentrated around the region of insertion of mini implant.
Pithon et al65 (2013) evaluated the influence of length of mini implant and cortical bone thickness on insertion torque. Mini implants of 1.5mm diameter and lengths 6mm, 8mm and 10mm were tested in pig ribs of varying cortical bone thickness. They found that the insertion torque increased with increasing screw length and increasing cortical bone thickness and concluded that though increasing the length of the screw doesn’t increase its mechanical strength, it can efficiently reinforce the initial stability of mini implants.
Sana et al66 (2013) provided an overview on the current literature
ideal qualities required of a mini implant material and gave the mechanical properties of stainless steel, cobalt-chromium alloys, titanium and its alloys which are currently in use.
Serra et al67 (2013) compared the fracture surface characteristics
commercially pure titanium, Ti-6Al-4V alloy, and nano structured, plastically deformed titanium mini-implants by torque test. Torque test results showed significant increase in the maximum torque resistance of nano titanium mini-implants when compared to commercially pure titanium mini-implants, and no statistical difference between Ti-6Al-4V alloy and nano titanium mini-implants. Since nanostructured titanium mini-implants have mechanical properties comparable to titanium alloy mini-implants, and biocompatibility comparable to commercially pure titanium mini-implants, it was suggestive that nano structured titanium could replace Ti-6Al-4V alloy as the material base for mini-implants.
Alrbata et al68 (2014) determined the appropriate range of cortical bone
Kalra et al69 (2014) compared the accuracy of two dimensional
MATERIALS USED IN THE STUDY:
1. Eighty Absoanchor Ti-6Al-4V alloy mini implants by Dentos®, Korea 2. Long handle implant driver with torque gauge, Dentos®, Korea
3. Bovine rib bone 4. Normal saline
5. Osteotome (Orthomax)
6. Auto-polymerizing resin (DPI) 7. Spirit level
8. Customized stand for implant placement
9. Discovery XR656 digital radiographic machine by G.E.® 10. G.E. Media Viewer software for image analysis
METHODOLOGY:
The present study was undertaken at the Department of Orthodontics and Dentofacial Orthopedics, Sri Ramakrishna Dental College and Hospital, Coimbatore and was approved by the Ethical Committee of the institution.
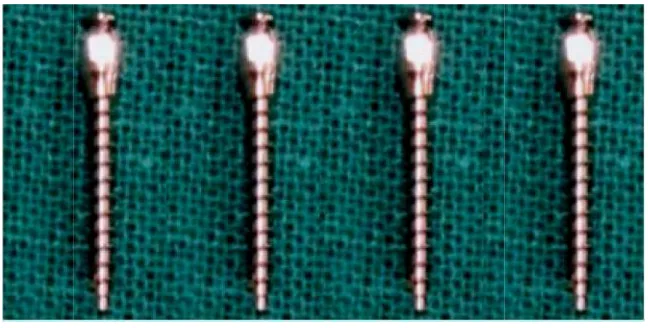
Eighty Absoanchor self-drilling, mini implants made of Titanium-6Aluminium-4Vanadium [Ti-6Al-4V] alloy implants from Dentos® Korea, of the following dimensions were used for the experiment [fig 1-4]:
Length 6mm with diameters: 1.3mm, 1.4mm, 1.5mm and 1.6mm
5 screws of each dimension Total 20 mini implants Length 7mm with diameters:
1.3mm, 1.4mm, 1.5mm and 1.6mm
5 screws of each dimension Total 20 mini implants Length 8mm with diameters:
1.3mm, 1.4mm, 1.5mm and 1.6mm
5 screws of each dimension Total 20 mini implants Length 10mm with diameters:
1.3mm, 1.4mm, 1.5mm and 1.6mm
5 screws of each dimension Total 20 mini implants
Mini implants were conical in shape and the head of the implant was hexagonal with a small hole for passing threads and ligature wires through it.
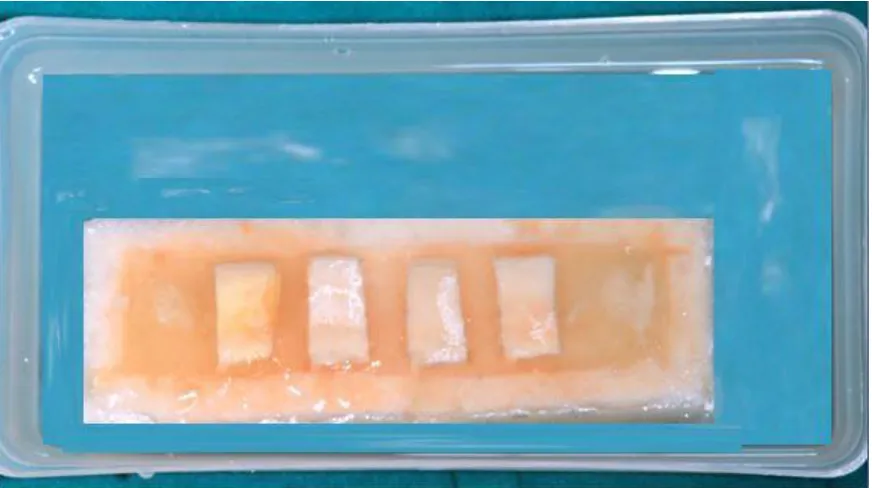
Preparation of bone segments:
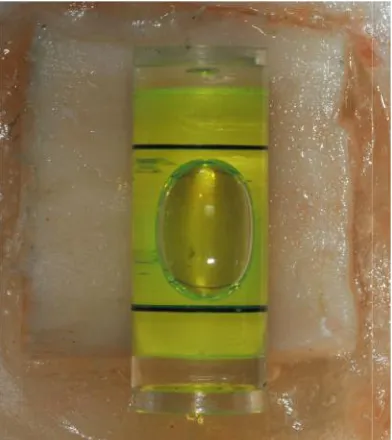
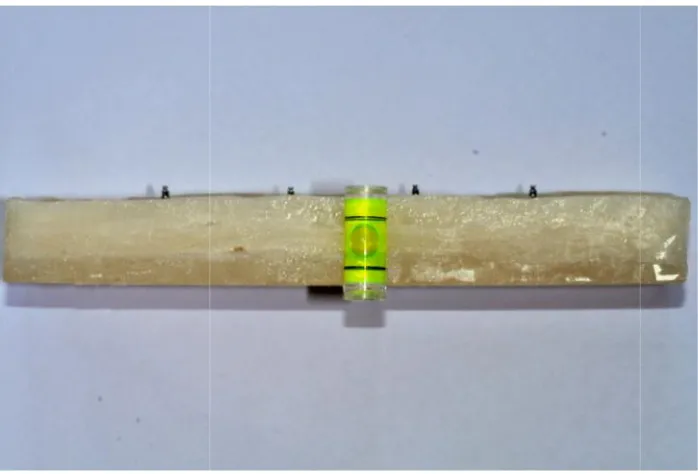
To ensure that the point of insertion of the implant was truly horizontal, a spirit level was placed on the surface of each of the rib segments during embedding [fig 6, 7]. Twenty bone segment blocks were thus prepared and were segregated for implant insertion such that one block had four mini screws of similar length and varying diameter. A pictorial representation of the resin block with rib bone segments is shown in Figure 8.
Bovine rib was used in this study as previous studies byLaurito et al39have
shown that bovine rib architecture is similar to the human mandibular architecture. Bovine rib is one of the preferred human bone substitutes in ex-vivo implantology studies. The bovine rib was stored in normal saline and kept moist till the time of insertion as done byChatzigianni et al44[fig 9]
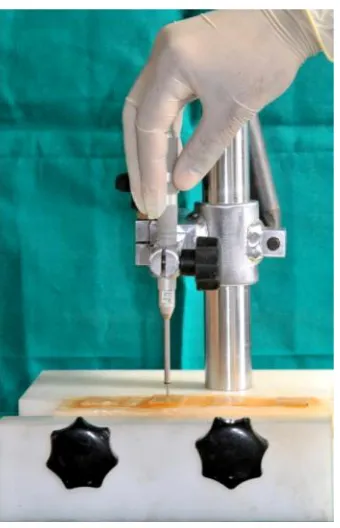
Insertion of mini implants:
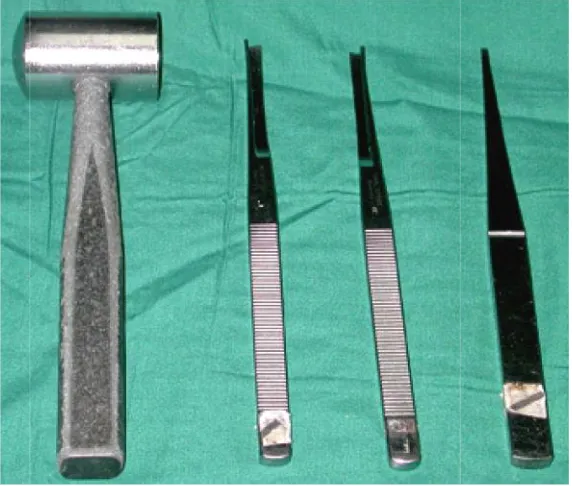
A long handle implant driver from Dentos®, Korea with torque gauge fixed at 1kg/cm [i.e.9.8N] was used for the study [fig 10, 11]. The torque force can be adjusted from 0.5Kg.cm to 2Kg.cm. The driver emitted a clicking noise when the torque level exceeded the set value.
Radiographic imaging of the bone block:
Once the mini implants were inserted, a digital radiograph was taken of each of the blocks individually. A G.E Discovery XR656 digital radiographic machine with the X-ray source 100cm from the object set at 80kV and 292mAs was used with radiographic exposure time of 1milli second [fig 16, 17]. The bone blocks were placed at the centre of the X-ray beam path. A spirit level was used to ensure that the blocks were not inclined [fig 18, 19].
Image analysis for deflection measurement:
The radiographic image obtained was adjusted for optimum contrast and magnification prior to obtaining the mini implant deflection values [fig 20].A pictorial representation of the image analysis is shown in Figure 21.In the image, the black line AB represents the true horizontal line passing through the centre of point of insertion of the implant. The red line XY represents the long axis of the mini implant passing through its apex and tip. Ø is the angle between the two lines AB and XY and represents the degree of deflection of the mini implant.
Figure 1- Length 6mm- diameters from left to right-1.3mm, 1.4mm, 1.5mm, 1.6mm
Figure 2-Length 7mm- diameters from left to right-1.3mm, 1.4mm, 1.5mm, 1.6mm
[image:44.595.178.502.556.720.2]Figure 3-Length 8mm- diameters from left to right-1.3mm, 1.4mm, 1.5mm, 1.6mm Figure 1- Length 6mm- diameters from left to right-1.3mm, 1.4mm, 1.5mm, 1.6mm
Figure 2-Length 7mm- diameters from left to right-1.3mm, 1.4mm, 1.5mm, 1.6mm
Figure 3-Length 8mm- diameters from left to right-1.3mm, 1.4mm, 1.5mm, 1.6mm Figure 1- Length 6mm- diameters from left to right-1.3mm, 1.4mm, 1.5mm, 1.6mm
Figure 2-Length 7mm- diameters from left to right-1.3mm, 1.4mm, 1.5mm, 1.6mm
Figure 4-Length 10mm- diameters from left to right-1.3mm, 1.4mm, 1.5mm, 1.6mm
[image:45.595.200.486.393.636.2]Figure 5- Osteotome for cutting bovine rib bone bovine rib embedded in resin Figure 4-Length 10mm- diameters from left to right-1.3mm, 1.4mm, 1.5mm, 1.6mm
Figure 5- Osteotome for cutting bovine rib bone bovine rib embedded in resin Figure 4-Length 10mm- diameters from left to right-1.3mm, 1.4mm, 1.5mm, 1.6mm
Figure 6-Spirit level used to ensure bone segment is horizontal
[image:46.595.145.542.436.677.2]Figure 7- Bone block prepared with four segments in each block Figure 6-Spirit level used to ensure bone segment is horizontal
Figure 7- Bone block prepared with four segments in each block Figure 6-Spirit level used to ensure bone segment is horizontal
Figure 8- Pictorial representation of acrylic block with bovine rib bone segments
[image:47.595.112.548.435.679.2]Figure10- Long handle implant driver with adjustable torque gauge
Figure 11- Torque set at 1kg.cm
Figure10- Long handle implant driver with adjustable torque gauge
Figure 11- Torque set at 1kg.cm
Figure10- Long handle implant driver with adjustable torque gauge
Figure 12- Customized stand lateral view
[image:49.595.221.430.448.721.2]Figure 13- Customized stand frontal view Figure 12- Customized stand lateral view
Figure 13- Customized stand frontal view Figure 12- Customized stand lateral view
Figure 14- Stand with bone, mini implant and driver
[image:50.595.253.430.441.732.2]Figure 15- Torque level kept at 1kg.cm during insertion Figure 14- Stand with bone, mini implant and driver
Figure 15- Torque level kept at 1kg.cm during insertion Figure 14- Stand with bone, mini implant and driver
Figure 16- G.E. Discovery XR656 radiographic machine
[image:51.595.194.501.491.691.2]Figure 17- Settings used for the radiographic imaging of the block Figure 16- G.E. Discovery XR656 radiographic machine
Figure 17- Settings used for the radiographic imaging of the block Figure 16- G.E. Discovery XR656 radiographic machine
Figure 18- Block surface checked with spirit level
[image:52.595.110.459.472.709.2]Figure 19- Block surface checked with spirit level Figure 18- Block surface checked with spirit level
Figure 19- Block surface checked with spirit level Figure 18- Block surface checked with spirit level
Figure 20- Radiographic image obtained of a bone block
[image:53.595.177.502.475.723.2]Figure 21- Pictorial representation of the image analysis Figure 20- Radiographic image obtained of a bone block
Figure 21- Pictorial representation of the image analysis Figure 20- Radiographic image obtained of a bone block
Figure 22- Points marked to draw line through long axis of mini implant
[image:54.595.109.565.468.714.2]Figure 23- Analysis of image using G.E. Media Viewer software Figure 22- Points marked to draw line through long axis of mini implant
Figure 23- Analysis of image using G.E. Media Viewer software Figure 22- Points marked to draw line through long axis of mini implant
A total of 80 mini implants were tested of which 2 mini implants of size 1.6mm x 8mm fractured and hence were not included in the study. The results of this in-vitro study using titanium alloy mini implants in comparing the deflection produced by implants of various diameters and length is presented as follows:
Descriptive statistics for the measurements were computed with SPSS statistical software package and the assumption of normality of the variables was investigated by the Kolmogorov-Smirnov test. The mean deflections of the various dimensions of implants used in the study are shown in table 1. All mini implants underwent deflection upon insertion with a maximum mean deflection 2.9 degrees and a minimum of 0.6 degrees. A test of between subjects’ effects was done to assess the influence of length and diameter and also the combined effects of length and diameter on deflection. The influence of all three parameters was found to be statistically significant (Table 2).
The individual effect of constant diameter with varying length and also constant length and varying diameter was assessed using one way Analysis of Variance and Post Hoc comparisons at 95% confidence interval.
Parameters assessed:
I. Comparison of the deflection in various diameters of varying length II. Comparison of the deflection in various lengths of varying diameters
(a) Comparison of 1.3mm diameter mini implants of lengths 10mm, 8mm, 7mm and 6mm:
The 10mm mini screws showed maximum deflection followed by 8mm then 7mm and the least deflection was seen in the 6mm long screws. This difference was seen to be statistically significant (p <0.05).The maximum difference of 1 degree was seen between the 10mm and 6mm screws and a minimum difference of 0.28 degrees was seen between the 8mm and 7mm long screws. The above result is depicted in table 3 and graph 1.
(b) Comparison of 1.4mm diameter mini implants of lengths 10mm, 8mm, 7mm and 6mm:
The 10mm mini screws showed maximum deflection followed by 8mm then 7mm and the least deflection was seen in the 6mm long screws. The maximum difference of 1.08 degrees was seen between the 10mm and 6mm screws and a minimum difference of 0.30 degrees was seen between the 10mm and 8mm screws and 8mm and 7mm long screws. The difference in the mean deflection observed was statistically significant (p <0.05). The above result is depicted in table 4 and graph 2.
(c) Comparison of 1.5mm diameter mini implants of lengths 10mm, 8mm, 7mm and 6mm:
This difference was seen to be statistically significant (p <0.05). The above result is depicted in table 5 and graph 3.
(d) Comparison of 1.6mm diameter mini implants of lengths 10mm, 8mm, 7mm and 6mm:
The 10mm mini screws showed maximum deflection followed by 8mm then 7mm and the least deflection was seen in the 6mm long screws. On comparison of mean difference of deflection, it was seen to be statistically significant (p <0.05). The maximum difference of 1.30 degrees was seen between the 10mm and 6mm screws and a minimum difference of 0.20 degrees was seen between the 10mm and 8mm screws. The above result is depicted in table 6 and graph 4.
II. Comparison of various lengths of varying diameter:
There was an inverse relation seen with respect to the effect of varying the diameter of the mini implant.
(a) Comparison of 10mm long implants of diameters 1.3mm, 1.4mm, 1.5mm and 1.6mm
(b) Comparison of 8mm long implants of diameters 1.3mm, 1.4mm, 1.5mm and 1.6mm
The smallest diameter i.e. 1.3mm implants showed the greatest deflection followed by 1.4mm, 1.5mm and the least deflection was observed for the 1.6mm wide mini implants.
The maximum difference of 0.9 degrees was seen between the 1.3mm and 1.6mm diameter screws and a minimum difference of 0.20 degrees was seen between the 1.5mm and 1.6mm screws. The difference in values was found to be statistically significant (p < 0.05). This is represented in table 8 and graph 6.
(c) Comparison of 7mm long implants of diameters 1.3mm, 1.4mm, 1.5mm and 1.6mm:
The smallest diameter i.e. 1.3mm implants showed the greatest deflection followed by 1.4mm, 1.5mm and the least deflection was observed for the 1.6mm wide mini implants. The maximum difference of 1.24 degrees was seen between the 1.3mm and 1.6mm diameter screws and a minimum difference of 0.40 degrees was seen between the 1.4mm and 1.5mm screws. These discrete values were found to be statistically significant (p < 0.05). This is represented in table 9 and graph 7.
(d) Comparison of 6mm long implants of diameters 1.3mm, 1.4mm, 1.5mm and 1.6mm:
1.4mm and 1.5mm screws. These discrete values were found to be statistically significant (p < 0.05). This is represented in table 10 and graph 8.
Table 1- descriptive statistics of data
Dependent Variable: Data
length of mini implant
diameter of mini implant
1.3mm 1.4mm 1.5mm 1.6mm
Data N 10mm 5 5 5 5
8mm 5 5 5 3
7mm 5 5 5 5
6mm 5 5 5 5
Mean 10mm 2.9 2.5 2.18 1.9
8mm 2.6 2.2 1.9 1.7
7mm 2.32 1.9 1.5 1.08
6mm 1.9 1.42 0.88 0.6
Table 2- test of between subjects effect
Source
Type III Sum of
Squares df MeanSquare F Sig.
Corrected Model 29.834(a) 15 1.989 3082.83
1 .000
Intercept 260.721 1 260.721 404117.
736 .000
LENGTH 15.357 3 5.119 7934.46
9 .000
DIAMETER 13.118 3 4.373 6777.42
3 .000
LENGTH *
DIAMETER .359 9 .040 61.849 .000
Error .040 62 .001
Total 295.720 78
[image:61.595.108.512.449.677.2]Table 3- ANOVA test 1.3mm diameter implants
Sum of
Squares df Mean Square F Sig.
Between Groups
2.714 3 .905 1809.333 .000
Within Groups
.008 16 .000
Total 2.722 19
Post Hoc comparison
The mean difference is significant at the .05 level (I) length of mini
implant (J) length of miniimplant Mean Difference
(I-J) Std. Error Sig.
95% Confidence Interval Lower
Bound UpperBound
10mm 8mm .3000(*) .01414 .000 .2595 .3405
7mm .5800(*) .01414 .000 .5395 .6205
6mm 1.0000(*) .01414 .000 .9595 1.0405
8mm 10mm -.3000(*) .01414 .000 -.3405 -.2595
7mm .2800(*) .01414 .000 .2395 .3205
6mm .7000(*) .01414 .000 .6595 .7405
7mm 10mm -.5800(*) .01414 .000 -.6205 -.5395
8mm -.2800(*) .01414 .000 -.3205 -.2395
6mm .4200(*) .01414 .000 .3795 .4605
6mm 10mm -1.0000(*) .01414 .000 -1.0405 -.9595
Table 4- ANOVA test for 1.4mm diameter mini implants
Sum of
Squares df Mean Square F Sig.
Between Groups 3.182 3 1.061 2121.000 .000
Within Groups .008 16 .001
Total 3.190 19
Post Hoc Comparisons
The mean difference is significant at the .05 level. (I) length of mini implant (J) length of mini implant
Mean Difference
(I-J) Std. Error Sig.
95% Confidence Interval
Lower Bound Upper Bound
10mm 8mm .3000(*) .01414 .000 .2595 .3405
7mm .6000(*) .01414 .000 .5595 .6405
6mm 1.0800(*) .01414 .000 1.0395 1.1205
8mm 10mm -.3000(*) .01414 .000 -.3405 -.2595
7mm .3000(*) .01414 .000 .2595 .3405
6mm .7800(*) .01414 .000 .7395 .8205
7mm 10mm -.6000(*) .01414 .000 -.6405 -.5595
8mm -.3000(*) .01414 .000 -.3405 -.2595
6mm .4800(*) .01414 .000 .4395 .5205
6mm 10mm -1.0800(*) .01414 .000 -1.1205 -1.0395
Table 5- ANOVA for 1.5mm mini implants
Sum of
Squares df Mean Square F Sig.
Between Groups 4.770 3 1.590 1589.833 .000
Within Groups .016 16 .001
Total 4.786 19
Post Hoc Comparisons
The mean difference is significant at the .05 level. (I) length of mini implant (J) length of miniimplant
Mean Difference
(I-J) Std. Error Sig.
95% Confidence Interval
Lower Bound Upper Bound
10mm 8mm .2800(*) .02000 .000 .2228 .3372
7mm .6800(*) .02000 .000 .6228 .7372
6mm 1.3000(*) .02000 .000 1.2428 1.3572
8mm 10mm -.2800(*) .02000 .000 -.3372 -.2228
7mm .4000(*) .02000 .000 .3428 .4572
6mm 1.0200(*) .02000 .000 .9628 1.0772
7mm 10mm -.6800(*) .02000 .000 -.7372 -.6228
8mm -.4000(*) .02000 .000 -.4572 -.3428
6mm .6200(*) .02000 .000 .5628 .6772
6mm 10mm -1.3000(*) .02000 .000 -1.3572 -1.2428
Table 6- ANOVA test for 1.6mm diameter mini implants
Sum of
Squares df Mean Square F Sig.
Between Groups 4.963 3 1.654 2895.148 .000
Within Groups .008 14 .001
Total 4.971 17
Post Hoc comparisons
(I) length of mini
implant (J) length of miniimplant Mean Difference
(I-J) Std.Error Sig.
95% Confidence Interval Lower
Bound UpperBound
10mm 8mm .2000(*) .01746 .000 .1493 .2507
7mm .8200(*) .01512 .000 .7761 .8639 6mm 1.3000(*) .01512 .000 1.2561 1.3439
8mm 10mm -.2000(*) .01746 .000 -.2507 -.1493
7mm .6200(*) .01746 .000 .5693 .6707 6mm 1.1000(*) .01746 .000 1.0493 1.1507
7mm 10mm -.8200(*) .01512 .000 -.8639 -.7761
8mm -.6200(*) .01746 .000 -.6707 -.5693 6mm .4800(*) .01512 .000 .4361 .5239
6mm 10mm -1.3000(*) .01512 .000 -1.3439 -1.2561
8mm -1.1000(*) .01746 .000 -1.1507 -1.0493 7mm -.4800(*) .01512 .000 -.5239 -.4361
Table 7- ANOVA test for length 10mm mini implants
Sum of
Squares df Mean Square F Sig.
Between Groups 2.774 3 .925 1849.333 .000
Within Groups .008 16 .000
Total 2.782 19
Post Hoc Comparisons
(I) diameter of
mini implant (J) diameter ofmini implant Mean Difference
(I-J) Std. Error Sig.
95% Confidence Interval
Lower Bound Upper Bound
1.3mm 1.4mm .4000(*) .01414 .000 .3595 .4405
1.5mm .7200(*) .01414 .000 .6795 .7605 1.6mm 1.0000(*) .01414 .000 .9595 1.0405 1.4mm 1.3mm -.4000(*) .01414 .000 -.4405 -.3595
1.5mm .3200(*) .01414 .000 .2795 .3605 1.6mm .6000(*) .01414 .000 .5595 .6405 1.5mm 1.3mm -.7200(*) .01414 .000 -.7605 -.6795
1.4mm -.3200(*) .01414 .000 -.3605 -.2795 1.6mm .2800(*) .01414 .000 .2395 .3205 1.6mm 1.3mm -1.0000(*) .01414 .000 -1.0405 -.9595
1.4mm -.6000(*) .01414 .000 -.6405 -.5595 1.5mm -.2800(*) .01414 .000 -.3205 -.2395
Table 8- ANOVA test for length 8mm mini implants
Sum of
Squares df Mean Square F Sig.
Between Groups
1.944 3 .648
27599870709 25090000000 00000000000 .000
.000
Within Groups .000 14 .000
Total 1.944 17
Post Hoc Comparisons
(I) diameter of
mini implant (J) diameter ofmini implant Mean Difference
(I-J) Std. Error Sig.
95% Confidence Interval
Lower Bound Upper Bound
1.3mm 1.4mm .4000(*) .00000 .000 .4000 .4000
1.5mm .7000(*) .00000 .000 .7000 .7000 1.6mm .9000(*) .00000 .000 .9000 .9000 1.4mm 1.3mm -.4000(*) .00000 .000 -.4000 -.4000
1.5mm .3000(*) .00000 .000 .3000 .3000 1.6mm .5000(*) .00000 .000 .5000 .5000 1.5mm 1.3mm -.7000(*) .00000 .000 -.7000 -.7000
1.4mm -.3000(*) .00000 .000 -.3000 -.3000 1.6mm .2000(*) .00000 .000 .2000 .2000 1.6mm 1.3mm -.9000(*) .00000 .000 -.9000 -.9000
1.4mm -.5000(*) .00000 .000 -.5000 -.5000 1.5mm -.2000(*) .00000 .000 -.2000 -.2000
Table 9- ANOVA test for length 7mm mini implants
Sum of
Squares df Mean Square F Sig.
Between Groups 4.244 3 1.415 1414.667 .000
Within Groups .016 16 .001
Total 4.260 19
Post Hoc Comparisons
(I) diameter of
mini implant (J) diameter ofmini implant Mean Difference
(I-J) Std. Error Sig.
95% Confidence Interval
Lower Bound Upper Bound
1.3mm 1.4mm .4200(*) .02000 .000 .3628 .4772
1.5mm .8200(*) .02000 .000 .7628 .8772 1.6mm 1.2400(*) .02000 .000 1.1828 1.2972 1.4mm 1.3mm -.4200(*) .02000 .000 -.4772 -.3628
1.5mm .4000(*) .02000 .000 .3428 .4572 1.6mm .8200(*) .02000 .000 .7628 .8772 1.5mm 1.3mm -.8200(*) .02000 .000 -.8772 -.7628
1.4mm -.4000(*) .02000 .000 -.4572 -.3428 1.6mm .4200(*) .02000 .000 .3628 .4772 1.6mm 1.3mm -1.2400(*) .02000 .000 -1.2972 -1.1828
1.4mm -.8200(*) .02000 .000 -.8772 -.7628 1.5mm -.4200(*) .02000 .000 -.4772 -.3628
Table 10- ANOVA test for length 6mm mini implants
Sum of
Squares df Mean Square F Sig.
Between Groups 5.004 3 1.668 1668.000 .000
Within Groups .016 16 .001
Total 5.020 19
Post Hoc Comparison
(I) diameter of
mini implant (J) diameter ofmini implant Mean Difference
(I-J) Std. Error Sig.
95% Confidence Interval
Lower Bound Upper Bound
1.3mm 1.4mm .4800(*) .02000 .000 .4228 .5372
1.5mm 1.0200(*) .02000 .000 .9628 1.0772 1.6mm 1.3000(*) .02000 .000 1.2428 1.3572 1.4mm 1.3mm -.4800(*) .02000 .000 -.5372 -.4228
1.5mm .5400(*) .02000 .000 .4828 .5972 1.6mm .8200(*) .02000 .000 .7628 .8772 1.5mm 1.3mm -1.0200(*) .02000 .000 -1.0772 -.9628
1.4mm -.5400(*) .02000 .000 -.5972 -.4828 1.6mm .2800(*) .02000 .000 .2228 .3372 1.6mm 1.3mm -1.3000(*) .02000 .000 -1.3572 -1.2428
1.4mm -.8200(*) .02000 .000 -.8772 -.7628 1.5mm -.2800(*) .02000 .000 -.3372 -.2228
Graph 1- deflection for 1.3mm diameter mini implants
Graph 2- deflection for 1.4mm diameter mini implants
DIAMETER: 1.00 1.3mm
length of mini implant
6mm 7mm
8mm 10mm
Mean of Data
3.0 2.8 2.6 2.4 2.2 2.0 1.8
DIAMETER: 2.00 1.4mm
length of mini implant
6mm 7mm
8mm 10mm
Mean of Data