Assessing for Competence Need Not
Devalue Grades
Glen Van Der Vyver, University of Southern Queensland,
Toowoomba, Australia
[email protected]
Abstract
Norm-based assessment is under fire from some quarters because it is often unfair and is out of touch with the demands of the job market. Criterion-referenced assessment is touted as the an-swer by others but problems remain, in particular with regards to the maintenance of standards. This study examines the use of competency-based assessment in an undergraduate database course. The findings suggest that it is possible to create an assessment instrument that is relevant to particular skills required in the job market but does not inflate grades across the board. A re-markable idiosyncrasy emerges in that the distribution of scores assumes a bi-polar shape with a significant number of high grades and a significant number of grades at the lowest passing level or failing grades.
Keywords: grade inflation, criterion-based assessment, academic standards, competence, norm-based assessment.
Introduction
Unlike professions like medicine, entry into the IT profession is relatively open. In the early days, most people working in the industry were graduate engineers and computer scientists but, as the industry mushroomed, a variety of entry paths emerged. The ‘university route’ was the preferred option for most, especially those who hoped to progress into the management ranks, although a significant number of people without formal tertiary qualifications did very well in the industry. In recent years, universities have witnessed a significant decline in IT student numbers and an assault by various interest groups on their capability to produce high quality graduates capable of meeting the needs of industry. Examples of this assault include training organizations that offer industry certification which they tout as preferable to a university degree and national computer societies who set up their own qualification and training frameworks in direct competition with universities.
Since the end of the dot-com boom, employment opportunities for Information Technology graduates have declined (Malykhina, 2004). Smith (2004) argues that people face much more competition in the job market and employers who are increas-ingly demanding. Employers can afford to be much more selective and conse-quently unemployment is an issue of concern for established professionals while new graduates find it difficult to establish themselves in the field (Chen, 2003; Chabrow, 2003). Recent
opments in outsourcing and off-shoring combined with the ceaseless demands on corporations to improve cost efficiencies, suggest that the difficult times are not over (Fang, Lee, Lee and Huang, 2004).
A number of influential sources in Australia have in recent years been critical of the quality of graduates produced by Australian universities (Weber, 2004; The Australian, June 14, 2005, p. 31). Some commentators argue that the wrong type of graduate is being produced while others argue that graduates are not of sufficient quality. Both groups seem to agree that there is a skills crisis. Even as academics have observed their students struggling to find suitable positions in the last couple of years, various groups have been touting a skills crisis.
A recent editorial in an influential international business publication highlights the complexity of the labour market, the inadequacy of much public policy in the area and the credibility of many groups whose clarion call is ‘skills crisis’ (The Economist, Jan 8, 2005, p. 31). The editorial points out that government and business people regularly bemoan the shortage of scientists, while industry leaders demand more technically trained graduates. But, says the Economist (2005, p. 31), ‘the market demurs . . . According to a report from UK GRAD, a government-funded group, science and engineering graduates have the highest levels of unemployment, at every level, from first degree to PhD”. Furthermore, when these graduates do find work, they earn only slightly more than the average graduate and enter jobs whose salaries are growing at below average rates. At the same time, there are large documented shortfalls in people entering the trades. The
Economist (2005) argues that the government pushes large numbers of sometimes unsuitable people into university courses. Universities, which must fill seats in order to survive, drop stan-dards in order to maintain reasonable pass rates. They also introduce less rigorous qualifications. The result is a large number of overqualified but mediocre students, many of whom would have been better suited to a technical or vocational career. The Economist (2005) concludes that a real problem is not a shortage of scientists and engineers but too few good quality graduates and too many poorly-trained ones.
How then can we produce good quality graduates who are able to negotiate the difficult and sometimes traumatic transition to industry? One way of addressing the problem would be to ex-amine closely the skills required in industry and to produce courses that teach those skills and assess the mastery of those skills. Many academics are uneasy with this idea because they fear that the curriculum will become too vocational. Also, traditional norm-referenced grading is not suitable when the goal of assessment is to determine where skills have been mastered. The re-quirements of employers have not changed greatly over a number of decades (Richardson, 2006) and the key skills are basic programming skills, the ability to solve problems, communication skills and the ability to work in teams (Baillie, 2001).
Richardson (2006) examines erosion of measures of graduate aptitude and ability in New Zealand and the situation he describes is not far removed from that prevailing in Australia. Richardson (2006) argues that universities continue to serve as the primary source of people destined for the ICT industry and employers rely on grades to make selection decisions. He argues that norm-referenced assessment is out of touch with the realities of the marketplace and the stated policy of government. This policy encourages universities to provide courses that build competencies that will allow graduates to compete in the knowledge marketplace.
Norm and Criterion-referenced Assessment
Linn and Gronlund (2000, p. 42) define norm-referenced assessment as a test or other type of as-sessment designed to provide a measure of performance that is interpretable in terms of an indi-vidual's relative standing in some known group.
Norm-referenced assessment is by definition closely aligned with the normal distribution and has been the dominant force in the academy for a long time.
Linn and Gronlund (2000, p. 42) define criterion-referenced assessment as a test or other type of assessment designed to provide a measure of performance that is interpretable in terms of a clearly defined and delimited domain of learning tasks.
A criterion-referenced test is not intended to discriminate between students. Rather, it attempts to determine whether learning outcomes have been achieved (Linn & Gronlund, 2000, p. 43). Stu-dents are given an opportunity to demonstrate the knowledge and skills they have acquired and are measured against specific criteria that are made public before the test is administered (Dunn, Parry & Morgan, 2002; Linn & Gronlund, 2000). Evaluation is transparent and students are able to determine why a particular grade was achieved. This in turn allows them to learn from their mistakes and build skills.
Another ostensible advantage of criterion-referenced assessment is that it is more equitable than norm-referenced assessment. Atherton (2002, p. 1) delineates the position of those who argue that norm-referenced assessment is unfair by way of an example:
A former colleague of mine, previously a head-teacher, told of one of his brightest pupils, who scored 99% in her mathematics A-level, but only got a "B". When he queried this with the exam board, he was told it was unfortunate but it was an exceptional year, and all the quota of "A"s had been allocated to those who got 100%.
Atherton (2002) argues that the situation described above a by-product of the competitive spirit which is required to maintain standards. He argues that anomalies of the type described above occur rarely and we should accept them because, in the long term, all cohorts tend to-wards the mean. Variants of Atherton’s position are not uncommon in the academic world. One reason for this is that the normal distribution dominates the assessment worldview and there people are uneasy about significant deviations from that distribution. Substantive prob-lems do exist, however. Perhaps the most serious of these is the difficulty in finding appropri-ate criteria (Dunn, Parry, & Morgan, 2002) and then measuring the extent to which a criterion has been met (Linn & Gronlund, 2000).
Many critics justifiably point to the often low levels of performance required to be certified com-petent and argue that criterion-referenced assessment is nothing more than a futile attempt to translate complex professional practice into a series of lower-order tasks that can easily be ob-served (Morgan & O’Reilly, 1999; Dunn, Parry, & Morgan, 2002). It is also very difficult to es-tablish criteria that are widely accepted (Dunn, Parry, & Morgan, 2002). This is particularly true for an ICT industry where diverse players such as industry leaders, professional organizations, employee groups and academics often have divergent agendas.
credibility of the university and ultimately higher education. Dunn, Parry and Morgan (2002) re-spond that confusing standards with criteria is part of the problem. They point out a criterion is something that can be evaluated while a standard implies an assessment of quality.
Credible criterion-referenced assessment can be achieved but it depends upon criteria that are clear and appropriate (Sadler, 1987; Dunn, Parry, & Morgan, 2002). This is difficult to achieve when academics are often uneasy about the practice and don’t fully grasp its fundamental con-cepts (Dunn, Parry, & Morgan, 2002). A good point of departure towards improved practice would be to focus on the semantics of criterion specification. Specifications need to tread the fine line between over-generalization and too great a degree of precision (Dunn, Parry, & Morgan, 2002). Criteria such as ‘highly creative’ or ‘sophisticated’ are as unsatisfying as criteria that are so precisely defined that they allow no room for individuality and become little more than a be-havioural checklist.
It is important that teachers and students are as closely aligned as possible in terms of the mean-ing attached to criteria. A teacher could easily have a different understandmean-ing of the criteria and standards from the student who needs to interpret them. Shared meanings can be built via ex-panded examples, models and definitions that give clear messages to students about the range of acceptable performance (Dunn, Parry, & Morgan, 2002). This study focuses on the provision of behavioural signposts that allow students to build understanding assessment criteria.
Methodology
This paper reports on a pilot study that seeks to examine the influence of behavioural signposts upon criterion-referenced assessment. The study was conducted during an offering of a one se-mester course focusing on database applications development. The course is highly focused on problem-solving and entails two hours of lecture and two hours of practical per week. The key objectives of the course are to build skills in the following areas:
• Creation and implementation of databases using ERD’s and / or specifications. • Identification and correction of design problems.
• Identification of data problems.
• Writing client-side and server-side code to solve problems of varying degrees of diffi-culty.
• Using the data dictionary to formulate appropriate access paths to data.
The course is assessed via assignments, a closed-book written examination and a practical test. The practical test is taken during the final week of semester and is the focus of this study. The practical test at the time of the study comprised ten percent of the total course grade. Given that the practical test was experimental, it was determined that final grades should be examined care-fully and corrections made where the test had an obvious negative impact on the overall grade. As it happened, no such correction was required.
At the beginning of the semester, students are provided with comprehensive details about assess-ment, including the practical test. Students are advised that the exercises conducted during the weekly laboratory classes are closely aligned with the practical test.
the final hour, students watch the instructor develop a solution step-by-step. The instructor dem-onstrates common problems and pitfalls, the optimal approach to the problem and the solution. Students are thereby provided with a model for achieving the best possible result in the practical test the following week and the relevance of the final laboratory to the practical test is once again emphasized.
The practical test presents students with a problem that requires them to identify appropriate data sources using the data dictionary and write a program using those sources. Students are permitted to reference the course textbooks but nothing else. The problem is relatively complex and the number of lines of code required to solve the problem is in the range of eighty, although this fluc-tuates according to the approach adopted. The program involves a series of steps culminating in the production of a report. Explicit criteria are specified and marks are allocated for demonstrated mastery, for example:
• Identify correct tables (15 marks).
• Demonstrate knowledge of fundamental structure of program. (5 marks). • Demonstrate (via output to screen) that tables have been accessed (5 marks).
• Demonstrate (via output to screen) that various milestones required for problem resolu-tion have been reached (5 marks per milestone).
• Produce final output as per specification (15 marks).
Sixty to seventy percent of marks are allocated in this way. Theoretically, a very simple practical test or a very talented group could result in everybody achieving full marks and gaining a distinc-tion. An attempt was therefore made to find a criterion which would act as a differentiator and time was used. It was postulated that this criterion would also reward students who did not find it necessary to constantly refer to the textbook. Using the performance of students on the major task during the penultimate week of the semester as a point of departure, a number of time bands were created and marks allocated to them:
• 75 minutes or less (20 marks) • 76 – 90 minutes (15 marks) • 91 – 105 minutes (10 marks) • 106 – 120 minutes (5 marks)
Although 120 minutes was the maximum time allowed, incentive marks were allocated. Twenty-three students were eligible for participation. Approximately eighty percent of the stu-dents were in the eighteen to twenty-one age range and had little, if any, job experience. Ap-proximately seventy percent were male. Two students were dropped from the study because they did not attend regularly. Twenty-one students met the criteria for inclusion and attended the prac-tical test.
Results
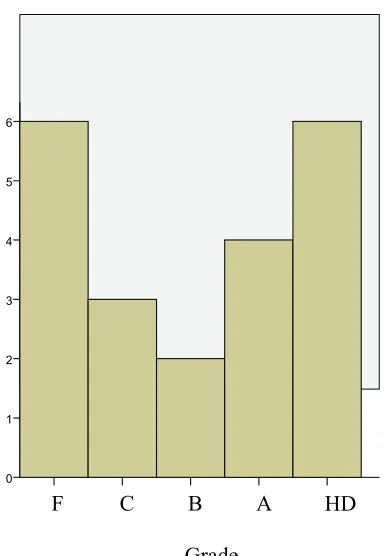
Figure 1: Distribution of marks
The distribution is clearly non-normal and exhibits an interesting bi-polar tendency. Approxi-mately twenty-eight percent of students achieved the highest grade and this is a mirror image of the number of outright failures. The two highest grades also almost mirror the two lowest grades. Less than ten percent of students achieved the middle grade, which would be likely to have the largest number of cases in a normal distribution.
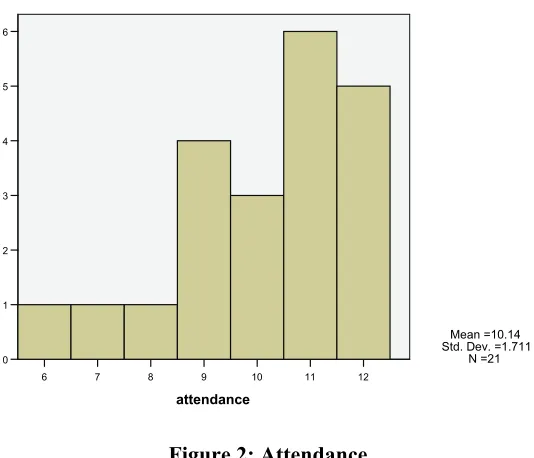
There is evidence of the grade inflation that causes so much concern but only amongst the best students. Indeed, at the opposite end of the spectrum, the distribution suggests grade deflation. Figure 2 shows the attendance pattern for the semester. The horizontal axis shows the number of practicals attended.
Attendance at practicals was generally above eighty percent and only three students attended fewer than seventy-five percent of practicals. Given that the content of the practical sessions was so closely aligned with the practical test, it was postulated that there would be a correlation be-tween attendance and mark achieved in the practical test. The results of any statistical test where such a small sample is involved and where the work is exploratory need to be interpreted with caution. These tests are nevertheless of interest in that they indicate possible directions for future research.
HD A
B C F
Grade
6
5
4
3
2
1
Figure 2: Attendance
Figure 3 shows the correlation between attendance at practical sessions and the actual mark achieved on the practical test.
Attendance mark
Pearson Correlation 1 .688(**)
Sig. (2-tailed) .001
attendance
N 21 21
** Correlation is significant at the 0.01 level (2-tailed).
Figure 3: Correlation between attendance and mark
The correlation is significant at the 1% level, and suggests that regular attendance at practicals does influence performance in the practical test. It should be noted that attendance at the critical penultimate practical was very high and the correlation between attendance at this practical and performance is substantially lower than the overall correlation between attendance and perform-ance. Given that this practical was virtually a trial run for the practical test and students were pro-vided with an in-depth solution developed in situ, the fact that the failure rate was nevertheless high suggests that regular attendance was a key determinant of performance. Perhaps attendance at the penultimate practical was simply not enough to offset regular absence during the remainder of the semester and, consequently, under-developed skill levels.
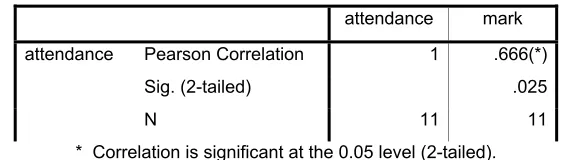
It could be argued that the correlation between attendance and mark is compromised because good students are more likely to attend classes. Figure 4 shows the correlation between atten-dance and mark after the two top grades have been removed.
12 11 10 9 8 7 6
attendance 6
5
4
3
2
1
0
Mean =10.14 Std. Dev. =1.711
Correlations
attendance mark
attendance Pearson Correlation 1 .666(*)
Sig. (2-tailed) .025
N 11 11
[image:8.612.145.426.86.166.2]* Correlation is significant at the 0.05 level (2-tailed).
Figure 4: Correlation between attendance and grade with two top grades removed
Although the correlation has dropped slightly, it is very close to the original correlation. There-fore, even for students who find the course challenging, attendance at practicals does seem to im-prove performance on the practical test.
Conclusions
This exploratory study suggests that using criterion-referenced assessment in a database pro-gramming course could be a viable alternative to norm-based assessment, even though the distri-bution of results is somewhat idiosyncratic. The study is based on a small cohort and a technique that requires refinement and the findings should be evaluated with appropriate caution.
Although there is evidence for grade inflation amongst students who are highly competent any-way, there is also evidence which suggests that there is grade deflation amongst less competent students, and consequently a high failure rate. Given that the assessments were designed with the requirements of industry firmly in mind, it would appear that the assessment shows some promise as a discriminator of talent in a specific skills domain. The assessment method seems to identify those with the current potential to succeed without discriminating amongst members of this group on highly marginal criteria, for example a one percent difference in a norm-referenced distribu-tion. There is a very clear distinction between people with the potential to perform and people who are currently struggling.
There is also evidence to suggest that a regimen of exposure to the criteria, appropriate practical examples and model-based solutions does improve performance. It should be noted that this was measured indirectly via attendance figures and it could be that the best student attended regularly. More sophisticated measurements are required to assess the impact of exercises completed during the semester and this will be done during the next phase of the study.
The assessment method used for this study is more brutal at the lower end than norm-based as-sessment and this is a cause for concern. Even a small increase in level of difficulty could have a significant multiplier effect on the failure rate. This would raise issues pertaining to fairness and might not be popular in the current environment of higher education. As it happened, the practical test was worth only ten percent and did not cause any student to receive a lower overall grade than would have been the case if the practical test had not been taken. Three students received higher grades than they would have if the practical test had not been taken and this does provide additional evidence of some inflationary pressure on grades.
References
Atherton, J. S. (2002). Heterodoxy: Against criterion referenced assessment. Retrieved 8 December, 2006, from http://www.doceo.co.uk/heterodoxy/styles.htm
Bond, L. (1996, December). Norm and criterion-referenced testing. ERIC/AE Digest.
Chabrow, E. (2004). Fewer IT workers standing in the unemployment line. Information Week, 943, 16. Chen, C. (2003). Grads aren’t seeing green. Fortune, 147(13), 29.
Dunn, L, Parry, S. & Morgan, C. (2002). Seeking quality in criterion referenced assessment. Proceedings of
the Learning Communities and Assessment Cultures Conference, University of Northumbria, 28-30
August.
Fang, X., Lee, S., Lee, T. & Huang, W. (2004). Critical factors affecting job offers for new MIS graduates.
Journal of Information Systems Education, 15(2), 189-204.
Linn, R. L., & Gronlund, N. E. (2000). Measurement and assessment in teaching (8th ed.). Upper Saddle River, NJ: Prentice Hall.
Malykhina, E. (2004, April 19). IT job market causes concern. InformationWeek, 98(5), 76. Morgan, C. & O'Reilly, M. (1999). Assessing open and distance learners. London: Kogan Page.
Richardson, T. (2006). Degraded grades – Do graduate grades provide a potential guide to ICT employers?
Issues in Informing Science and Information Technology, 2, 1-8. Available at
http://2005papers.iisit.org/I01f51Rich.pdf .
Smith, S. (2004). Career barriers among information technology undergraduate majors. Information
Tech-nology, Learning and Performance Journal, 22(1), 49-57.
Weber, R. (2004). Some implications of the year-2000 era, dot-com era and offshoring for information sys-tems pedagogy. MIS Quarterly, 28(2), iii-xi.