CYTOLOGICAL CHANGES AND SPECIFIC SALIVARY BACTERIAL ASSESSMENT IN ORAL SQUAMOUS CELL CARCINOMA PATIENTS
UNDERGOING RADIATION THERAPY
Dissertation submitted to
THE TAMIL NADU DR. M.G.R. MEDICAL UNIVERSITY
In partial fulfilment for the degree of
MASTER OF DENTAL SURGERY
BRANCH – VI
ORAL PATHOLOGY AND MICROBIOLOGY
I take immense pleasure in expressing my heartfelt thanks to Dr. G. S. Kumar, M.D.S., the Principal, Professor and Head of Department, Department of Oral Pathology and Microbiology, K.S.R. Institute of Dental Science and Research, for his support, expert guidance, valuable insights and patience during my years of post graduation. His attitude towards perfection and enthusiasm in every activity undertaken made me look up to this accomplished Oral Pathologist to be one of the best teachers I have known and an exemplary role model.
I sincerely owe my thanks and my deep sense of gratitude to the faculty, Department of
Oral Pathology and Microbiology, K.S.R. Institute of Dental Science and Research, Dr. M. Rajmohan, M.D.S., Professor, Dr. H. Prasad, M.D.S., Reader and Dr.K. Anuthama,
M.D.S., Reader, for their incessant support, constructive criticism, motivation, guidance and supervision throughout the course.
I thank my senior and now a senior lecturer in our department, Dr.Sruthi Ranganath for her love, support and motivation throughout my course.
I thank Mr. Jagadeesh M.Phil (Microbiology), Chromepark Laboratory, Namakkal, for his granting me permission for conducting my study by using his laboratory facilities throughout this study.
Dr. K.K. Sri Chinthu for their love, care, help and suggestions throughout my course.
I express my thanks to my fellow post graduates Dr. Mohanapriya and Dr. L. Mahalakshmi for their constant help throughout my study and during the course. They
having been a driving force for me throughout my post graduation.
I extend my heartfelt appreciation and gratitude to my beloved juniors Dr. P. Prema, Dr. Tomson Thomas and Dr. A. Faridha for their unyielding support and motivation during the period of my study.
I thank my subjuniors Dr. Nithya, Dr. Amutha and Dr. Kanimozhi for their support.
I owe my thanks to my fellow post graduates Dr.A.K. Shanmugaavel and Dr. G. Thiruvenkadam for their timely help not only during my study but also throughout our
course.
I owe my thanks to Mr. Ganesh, our laboratory technician and our attenders Mrs. Savitha and Mrs. Jeyalakshmi for their patience and support during my course.
I extend my thanks to my parents and my in-laws for their love, care and constant support.
“I dedicate this work to my beloved son A. Jaivanth Adithya, who bore my absence during very
important times and my better half Dr. R. Arun for relieving me of so many of my
responsibilities. Their immense love, tolerance to my temperaments and constant support made
me work consistently towards my goal.”
S. No. TITLE PAGE No.
1. INTRODUCTION 1
2. AIMS AND OBJECTIVES 5
3. REVIEW OF LITERATURE 6
4. MATERIALS AND METHODS 24
5. RESULTS 40
6. DISCUSSION 60
7. SUMMARY AND CONCLUSION 71
S.NO TITLE PAGE NO 1. Micropipette, Slides, Glass Marking Pencil, Test Tube
and Biofix Spray 31
2. Sterile Container Containing Sample 31
3. Placement of Test Tube Containing Sample into Centrifuge 32
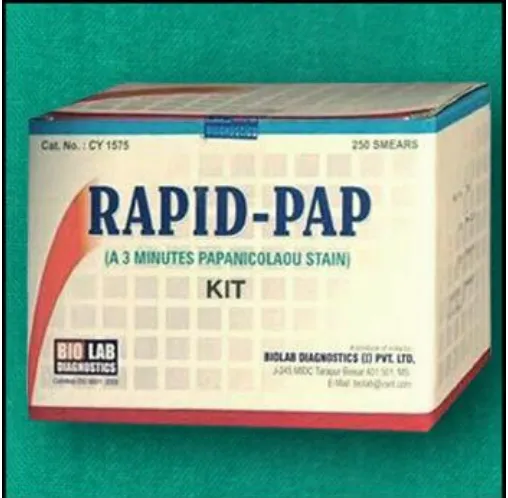
4. Rapid Papanicalaou Smear Kit (Biolab Diagnostics, India) 32
5. Research Microscope with ProgRes Capture Pro 2.8 Software
(Olympus Opto Systems India Pvt. Ltd,) 33
6. Thermocol Box with Sample 33
7. Agars used for Selective Media Preparation 34
8. Polymyxin B for selective medium of
Capnocytophaga gingivalis 34
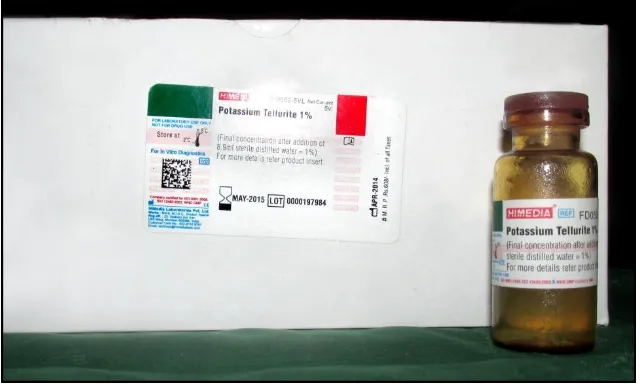
9. Potassium Tellurite for selective medium of
Streptococcus mitis 35
10. Jar used for Culture and Anaerobic Gas Pack 35
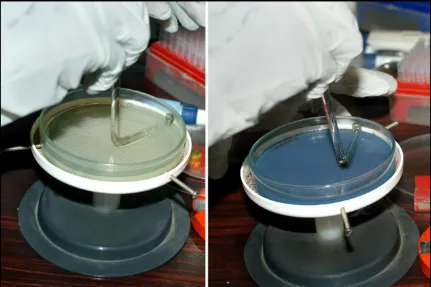
11. Pouring Selective Medium into the Plate 36
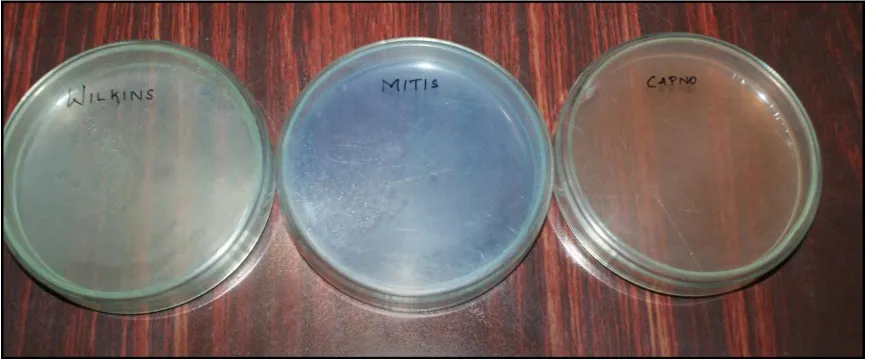
12. Petri Dishes with Poured Selective Media 36
13. Poured Plate Placed on Rotating Table 37
14. Serial Dilution of Saliva 37
15. Diluted Saliva into Petridish containing Selective Medium 38
16. Spreading Plate with L-Rod 38
17. Anaerobic Gas Jar with poured and spread Plates 39
19. Oxidase Dics for biochemical test 39
20. Photomicrographs (40X) Showing Exfoliated Cells in Control
Groups – PAP 56
21. Photomicrographs (40X) Showing Exfoliated Cells in Stage I
– PAP 56
22. Photomicrographs (40X) Showing Exfoliated Cells in Stage II
– PAP 56
23. Photomicrographs (40X) Showing Exfoliated Cells in Stage III
– PAP 57
24.
Photomicrographs (40X) Showing Exfoliated Cell Cytomorphometry in control and study groups – PAP (Nuclear
Area & Cytoplasmic Area)
57
25.
Photomicrographs (40X) Showing Exfoliated Cell Cytomorphometry in control and study groups – PAP (Nuclear
& Cell Diameter)
57
26. Colonies Of Streptococcus Mitis (Blue) 58
27. Colonies of Prevotella melaninogenica (Yellow) 58 28. Colonies of Capnocytophaga gingivalis(α-hemolytic) 58
29. Tests to confirm Streptococcus mitis 59
30. Tests to confirm Prevotella melaninogenica 59
LIST OF TABLES
S.NO TITLE PAGE NO
1. I a – Descriptive Statistics for Nuclear Area 40
2. I b – Comparison of Nuclear Area of Study Group at Three
Stages 40
3. I c – Comparison of Nuclear Area of Study Group at each
Stage with Control Group 41
4. II a – Descriptive Statistics for Cytoplasmic Area 41
5. II b – Comparison of Cytoplasmic Area of Study Group at
Three Stages 42
6. II c – Comparison of Cytoplasmic Area of Study Group at
each Stage with Control Group 42
7. III a – Descriptive Statistics for Nuclear Diameter 43
8. III b – Comparison of Nuclear Diameter of Study Group at
Three Stages 43
9. III c – Comparison of Nuclear Diameter of Study Group at
each Stage with Control Group 44
10. IV a – Descriptive Statistics for Cell Diameter 45
11. IV b – Comparison of Cell Diameter of Study Group at Three
Stages 45
12. IV c – Comparison of Cell Diameter of Study Group at each
Stage with Control Group 46
13. V a – Descriptive Statistics for Nuclear Cytoplasmic Ratio 46
14. V b – Comparison of Nuclear Cytoplasmic Ratio of Study
Group at Three Stages 47
15. V c – Comparison of Nuclear Cytoplasmic Ratio of Study
S.NO TITLE PAGE NO 16. VI a – Descriptive Statistics for Streptococcus mitis count in
study and control groups 48
17. VI b – Comparison of Streptococcus mitis in Study Group at
Three Stages 48
18. VI c – Comparison of Streptococcus mitis in Study Group at
each Stage with Control Group 49
19. VII a – Descriptive Statistics for Prevotella melaninogenica
count in study and control groups 50 20. VII b – Comparison of Prevotella melaninogenica in Study
Group at Three Stages 50
21. VII c – Comparison of Prevotella melaninogenica in Study
Group at each Stage with Control Group 51 22. VIII a – Descriptive Statistics for Capnocytopha gingivalis
count in study and control groups 51 23. VIII b – Comparison of Capnocytopha gingivalis in Study
Group at Three Stages 52
24. VIII c – Comparison of Capnocytopha gingivalis in Study
Group at each Stage with Control Group 52
CHARTS
S.NO TITLE PAGE NO
1. Charts showing Cytological parameters 54
1 INTRODUCTION
Oral cancer is one of the most common cancers in the world and a major cause of morbidity and mortality. The incidence of oral cancer is said to be greatest in the developing countries, with squamous cell carcinoma being the most common histological type.
Radiotherapy is frequently used as a standard treatment for carcinoma of the oral cavity either alone or in combination with surgery.( Zheng JW et al 2008) The reaction of tumor tissue, as well as the surrounding oral tissues, to radiotherapy depends on their growth rate and inherent susceptibility to radiation, which often shows a marked inter-individual variability( V Raj et 2011). Hence, assessing and predicting the outcome of treatment for individual patients becomes difficult. Estimation of radiosensitivity will be useful in planning the optimum radiation schedule for each patient.
Tests to predict the response of tumor to radiotherapy in an individual patient have been made in past and are still being pursued. Biopsies from the lesional site in order to predict response to radiotherapy were used initially. Later Graham found exfoliative cytology to be useful in assessing radiation related changes and to predict the response to treatment in cervical cancer patients ( Graham RM 1947). Graham’s ra-diation response (RR) test, though reproduced by some later studies, was not universally accepted as an indicator for treatment outcome.( Silverman S Jr, 1967)
2 Exfoliative cytology is a simple and noninvasive technique and the smear obtained can be analyzed quantitatively and qualitatively.Qualitative assessment of the exfoliated cells has lost its reputation as a result of a large number of false negative results arising due to the ill-defined diagnostic criteria.( Einstein TB, 2005 ) In the past exfoliative cytology has not gained wide acceptance due to problems such as inadequate samples, technical errors and the incorrect interpretation of findings. Presently with advanced imaging techniques, computerized systems and the use of quantitative techniques to verify the reliability of cytomorphometric analysis, this method is achieving credit once again.( Goregen M et al, 2011 ).
In exfoliative cytology, the quantitative parameters are objective and reproducible. One such quantitative parameter is morphometry.( Hande AH et al, 2010) Cytomorphological parameters such as cellular diameter (CD), nuclear diameter (ND), nuclear area (NA), cytoplasmic area, NA/CA ratio, nuclear shape, nuclear membrane continuity, optical density and nuclear texture have shown meaningful results in the diagnosis of oral lesions,especially NA and NA/CA ratio. ( Goregen M et al, 2011 ). The variations obtained in these parameters have been attributed to exposure to carcinogenic agents like tobacco through their end-products.( Hande AH, 2010 ) There is little mention in the literature about quantitative cytologic assessment of the effects of radiation therapy upon normal oral mucosa.
3 . The present study utilized exfoliative cytology and image analysis for scrutinizing the exfoliated keratinocytes for the cellular changes induced by radiation therapy in oral squamous cell carcinoma patients to estimate the NA, CA, ND and CD and to quantify the changes in the above variables and to explore the possibility of utilizing them as an assay to predict tumor response to radiotherapy.
Several discoveries in microbiological literature since 19th century have led its way to suggest that bacteria were implicated in all studies, and hence, the theory of bacterial infection leading tooral cancer was born. Various epidemiological and laboratory based studies have shown number of bacterial species to be associated with different cancers. Few such propositions that gained widespread interest were the associations seen between Salmonella typhi and gall bladder cancer, Chlamydophila pneumoniae and lung cancer, Streptococcus bovis and colorectal cancer, E. coli, crohn's disease and colon cancer (Chocolatewala N et al, 2007).
The pathogenesis of carcinogenesis due to bacteria can be attributed to chronic inflammatory mechanisms and bacterial toxins.
There are various proposed mechanisms for bacterial role in carcinogenesis. Chronic infections by several bacteria or production of toxins disturb the cell cycle and lead to alteration in cell growth. ( Koyi H et al, 2001).
4 Host cell signaling pathways may be altered by intracellular organism thereby enhancing its survival inside the cell.( Lax AJ,2005 ).
Another possible mechanism is the metabolism of potentially carcinogenic substances by the bacteria. Conversion of ethanol to its carcinogenic derivative acetaldehyde can facilitate tumorigenesis by increased DNA damage ( Salaspuro MP, 2003). This is supported by increased levels of microbial acetaldehyde production in heavy drinkers and smokers. Nitroso compounds formed by bacteria can cause carcinoma of oesophagus and other mucosal areas like oral cavity.( Lijinsky W, 1982 )
Studies have shown that DNA counts of Capnocytophaga gingivalis, Prevotella melaninogenica, and Streptococcus mitis were significantly higher in the saliva of oral cancer patients compared to normal healthy individuals..
5 AIM AND OBJECTIVES
AIM OF THE STUDY
To assess the cytological changes and specific salivary bacteria in histopathologically proven oral squamous cell carcinoma patients undergoing radiation therapy.
OBJECTIVES OF STUDY
To assess if there are significant variations in the cytological measurements like
nuclear area (NA), cytoplasmic area(CA) , nuclear diameter(ND), cell
diameter(CD) and nuclear cytoplasmic ratio(N:C), in the exfoliated oral mucosal cells at various stages of radiotherapy in oral squamous cell carcinoma patients
To assess if there are significant variations at various stages of radiotherapy in
oral squamous cell carcinoma patients compared to cells from normal healthy individuals.
To compare specific bacterial species - Capnocytophaga gingivalis, Prevotella
melaninogenica, Streptococcus mitis in the saliva of oral squamous cell carcinoma patients before and during various stages of radiation therapy
To compare the counts of these organisms at various stages of radiotherapy with
6 REVIEW OF LITERATURE
EXFOLIATIVE CYTOLOGY
Exfoliative cytology is the study of superficial cells shed from mucous membranes and the continuous exfoliation is a part of physiological turnover. There are two types of exfoliation from which sampling of cells can be done. They are (i) Natural spontaneous exfoliation in which cells from sites containing naturally exfoliated cells like saliva, urine specimen and vaginal pool secretions can be studied for normal changes of aging and pathological changes and (ii) Artificial or abrasive cytology in which cells are forcibly removed from mucosal surfaces before their natural time of shedding. These cells are usually smaller and less mature than the naturally desquamated cells. (Naib Z.M & Willis D, 1985)
HISTORY OF EXFOLIATIVE CYTOLOGY
Lionel Beale in 1860 identified and described cancer cells in sputum and published an article on Cyotological Examination of Sputum in a Case of pharyngeal carcinoma.
George N. Papanicolaou a Greek anatomist and pioneer in cytopathology introduced PAP staining procedures in 1942 for cyotological smears and along with Hebert Traut in 1943, used cytological smears in diagnosis in a case of uterine cancer.
7 ORAL EXFOLIATIVE CYTOLOGY
Ziskin (1940) first used exfoliative cytology in the oral cavity.
In 1951, Paul W Montgomery used exfoliative cytology to study the normal features of the oral epithelial mucosa.
Raymond et al in 1961 studied exfoliated cells of the tongue in cases of severe iron deficiency anemia and concluded that markedly less cornified and keratinized population of epithelial cells in those cases.
Green Berg et al in 1981 obtained cells from the saliva and also smears from buccal mucosa in patients with pernicious anemia.
In 1986, Barret et al showed that exfoliative cytology was 95% reliable and can be used to confirm herpes simplex infections in immunocompromised patients and also graded the cytopathological features.
A review of oral exfoliative cytology done by Sugarman P et al in 1996 concluded that exfoliative cytology is a useful adjunct to conventional biopsy to assess dysplastic changes within the oral epithelium.
Ogden GR et al (1997) reviewed methods of assessment by oral cytology and indicated exfoliative cytology to be an important adjunct in assessing patients with potentially cancerous lesions.
8 Ravi Mehrothra et al in 2006 reviewed the recent advances in cytological techniques and stated that oral cancers can be diagnosed much earlier using diagnostic techniques such as cytomorphometry, DNA cytometry and molecular analysis.
CYTOMORPHOMETRY
The term computerized nuclear morphometry was introduced by Bjorn Stenkvist et al in 1978. He showed that the multivariate numerical score that correlate well with nuclear atypia and had greater reproducibility when compared to conventional histological preparation.
Cowpe JG et al in 1985 measured nuclear and cell size in normal smears taken from five different sites(soft palate, buccal mucosa, lower lip, tongue and gingival) in the oral cavity in an attempt to make a baseline which might help in comparison of similar measurements from pathological smears. They showed that significant variations in nuclear and cytoplasmic area were displayed between different sites.
Ogden GR et al in 1991 studied the effect of smoking on oral mucosa by quantitative cytomorphometric analysis of buccal smears. He measured nuclear and cytoplasmic areas of cells using a Vids V semi-automatic image analysis system and found that there was significant elevation in nuclear area in smokers compared to normal group.
9 They found that there was increase in nuclear diameter and decrease in cell diameter in cells from dysplastic lesions compared to normal. They concluded that tobacco influenced the cells and the changes in nuclear diameter was marked.
Anuradha et al in 2007 studied exfoliated gingival cells to evaluate nuclear diameter, cytoplasmic diameter and nuclear cytoplasmic ratio in normal healthy individuals of different age and sex. They showed that there were age related and sex related alterations in gingival smears.
CYTOMORPHOMETRY AND ORAL CANCER
Jonathan G Cowpe, in 1984 carried out DNA cytophotometry and cytomorphology of normal and abnormal oral mucosal squames. He indicated that the use of these techniques may improve the diagnostic reliability of exfoliative cytology in the management of oral malignancy.
10 T. Ramaesh et al in 1999 found that cytomorphometric analysis of smears from buccal lesions (leukoplakia and squamous cell carcinoma) was useful in differentiating dysplastic and malignant squamous cells from normal squames using discriminant analysis based on ND and CD values. A sensitivity of 89% and a specificity of 89.7% were reported by them.
Khandelwal et al in 2010 analysed the cytomorphological features of kerati- nocytes in smears obtained from the oral mucosa of tobacco users and from oral squamous cell carcinoma lesions. They found significant reduction in the cellular area of keratinocytes from oral squamous cell carcinoma lesions when compared with those from oral smears of tobacco users and concluded that cytomorphometric analysis of keratinocytes can serve as a useful adjunct in the early diagnosis of oral squamous cell carcinomas.
11 In 2011, Smitha T, Sharada P and Girish HC studied and compared the changes in nuclear and cellular size, shape and nuclear–cytoplasmic ratio of the cells in the basal layer of oral leukoplakia and well-differentiated oral squamous cell carcinoma (SCC) with normal buccal mucosa, using computer-aided image analysis in tissue sections. From the results obtained, they concluded that, of the morphometric parameters studied, size was useful to differentiate between normal, potentially malignant leukoplakia and SCC.
HG Ahmed et al in 2011 conducted a study to find a better way for predicting the cellular proliferative activity of apparently healthy oral epithelium exposed to certain
carcinogens. The nuclear area (NA) and nucleolar organizer regions (NORs) counts were
compared with that of cytological atypia in 100 cases of epithelia exposed to toombak
(carcinogen), 100 controls (nonexposed) and two cases of squamous cell carcinoma
(SCC), as internal controls. Significant differences in AgNOR mean count and NA mean
values were identified between cases and controls. Significant differences were also
noted in AgNOR mean count and NA mean values between cases and two cases of SCC
and hence it was concluded that AgNOR mean count and NA are useful markers for
prediction of cytologically nonevident proliferative activity of oral mucosa exposed to
carcinogens.
Joshi et al in 2013 carried out a study to analyze the cytomorphometric features
12 compared to normal healthy individuals. Hence they concluded that morphometry could be used to detect dysplasia and malignancy in their early stages.
K.Kuyama et al (2013) conducted a study to compare among dysplasia of oral, uterine cervix and bronchus. It was a retrospective review of smears of cases diagnosed with dysplasia of oral, bronchial and uterine cervix, from 2002 to 2010. The results displayed a significant variation in cytomorphometrical values among the 3 regions. N/C values for uterine cervix and bronchus were well distinguished in comparison with oral dysplasias.
A.Nadaf et al in 2013 conducted a phase contrast cytomorphometric study of wet and unstained smears containing squames from normal oral mucosa and oral leukoplakia. They found significant increase in mean nuclear diameter and decrease in mean cellular diameter between the two groups. They concluded that cytomorphometry using phase contrast microscopy can be a better diagnostic tool as it was quicker and cost-effective.
Shaila et al in 2014, published an original study in which they analyzed the cytomorphological features of keratinocytes in smears obtained from the oral mucosa of oral squamous cell carcinoma (OSCC) lesions and normal controls using oral rub and rinse technique. Quantitative assessment of nuclear diameter (ND), cytoplasmic diameter (CD), cellular area (CA), nuclear area (NA), and nuclear cytoplasmic ratio(N:C) were carried out.
13 Jagannathan et al in 2014 reviewed exfoliative cytology as a predictive diagnostic tool. Though conventional cytology had limited sensitivity and specificity, the authors noted that improved accuracy was obtained by combining cytology with computer -assisted morphometry. This method is also suggested as a regular chair monitoring tool in patients who need a routine follow up to diagnose any changes in the early stages of development of malignancy.
CYTOMORPHOLOGY AND RADIOTHERAPY
S Silverman Jr. et al in 1967 compared the cytologic radiation changes and clinical tumor responses in 84 patients with oral squamous carcinoma treated with ionizing radiation. These patients were observed during therapy and for 1 to 7 years following therapy. Cellular changes noted in response to radiation were cytoplasmic vacuolization, cell enlargement, multinucleation and nuclear alterations. The percentage of each specific cellular morphologic change was also calculated. It was concluded that cell enlargement and multinucleation, indicative of radiation response occurred within two to three weeks from the beginning of treatment. But the changes were found to be static after 3 weeks. The radiation response indices after radiotherapy were, however, found to be highly increased and also persistent for long periods.
14 They found that Nuclear area and cytoplasmic area increased and DNA values were abnormal in most cases as a result of radiotherapy, returning to within normal limits one month after treatment. This was said to contrast strongly with the changes seen in smears from previously irradiated uterine cervices, where changes in cytomorphology were seen to persist for several years.
In 1998, NV Bhattathiri et al tried to identify the relationship between the radiosensitivity of oral cancers and the induction of micronucleation, nuclear budding and multinucleation (polynucleation) by serial cytological evaluation during fractionated radiotherapy. Serial scrape smears were taken from the tumor site (44 patients with oral epidermoid carcinoma) before and during radiotherapy and stained by Giemsa and the frequency of micronucleated cells, nuclear budded cells and multinucleated cells were evaluated by light microscopy. After a minimum follow-up period of 30 months the patients were classified as having resistant or sensitive tumours, depending on whether the primary tumour had recurred or not within that time. It was concluded from their observations that serial cytological assay of nuclear changes (SCANCing) during radiotherapy is a potentially useful test to predict radiosensitivity. Also, as multinucleation showed the greatest relation with radiosensitivity, injury to the cytokinetic apparatus was considered important in determining tumour radiosensitivity.
15 This relationship was observed to diminish progressively with increasing radiation dose. Micronucleation and nuclear budding remained significantly different between histologic grades even after 24 Gy of irradiation this was considered clinically practicable alternatives to biopsy at this stage and useful in further studies on cytologic prognostication of irradiated oral cancer.
R Kumari et al in 2005 evaluate the dose-dependent relationship of nuclear abnormalities by serial cytology during fractionated radiotherapy in head and neck cancer patients. Serial scrape smears were taken from the tumor before and during radiotherapy (0 to 24 Gy), and stained with Giemsa and May Grunwald's stain. The frequency of micronucleated, binucleated and multinucleated cells was evaluated with the help of light microscope and the counts were expressed per 1000 uninucleated cells. Their study results revealed that micronucleus assay is a very useful tool in the assessment of biological damage that predicts tumor radiosensitivity.
16 BM Biswal et al in 2010 conducted a preliminary study on 26 head and neck squamous cell carcinoma patients to predict radiation response before completion of the radiation therapy schedule. Intra-radiotherapy nuclear morphometry combined with AgNOR were done on cells obtained by fine needle aspiration. From their observations the authors concluded that morphometry and AgNOR were simple and useful tools for the prediction of radiation response in head and neck cancers.
V Raj and H Mahajan in 2010, performed a study in order to establish the relationship between various nuclear changes and radiation dose and to explore the possibility of utilizing them as an assay to predict tumor response to radiotherapy. Acridine orange fluorescent dye and May-Grunwald Giemsa stain were used to assess nuclear abnormalities like micronucleation, nuclear budding, binucleation, and multinucleation and these were then correlated with tumor response. It was concluded that a direct dose-response relationship existed between the frequencies of various nuclear abnormalities and radiation in oral squamous cell carcinoma patients undergoing fractionated radiotherapy.
17 Less differentiated tumors were seen to be less radiosensitive and exhibited increased rate of persistence of dysplastic cells and a higher rate of recurrence (33%) after completion of radiotherapy as compared to well differentiated tumors. The authors also recommended regular use of serial cytological assay as it was shown to provide valuable evidence of radiosensitivity and persistence of tumor/dysplastic cells at 8 weeks post-radiotherapy.
MICROORGANISMS AND MALIGNANCIES
The hypothesis that certain bacteria are capable of causing cancer is supported by studies of animal-specific pathogens that promote tumor formation like Helicobacter hepaticus which was discovered in 1992 as a cause of chronic active hepatitis that progressed to hepatocellular carcinoma in mice( Ward, et al., 1994).
D’Costa J et al in 1998 and later Tran N et al in 2007 showed with well documented evidences that viruses like Human Papilloma Virus(HPV) and Epstein Barr virus play a role in carcinogenesis by abrogation of p53 and pRb tumor suppressor genes and other cellular proteins with subsequent alteration in host genome function.
Dutta U et al and Shukla VK in 2000, showed that typhoid carriers were at an increased risk of developing carcinoma of gall bladder thus suggesting Salmonella typhi in its etiology.
18 Chlamydia pneumoniae infection has been shown to be associated with increased risk lung cancer as shown in studies done by et Littman AJ et al and Koyi H et al in 2004 and 2001 respectively.
According to Crowe SE(2005) and Montalban C et al(2001), Helicobacter pylori infection, known to cause stomach ulcers, has been proven to subsequently lead to gastric carcinomas and Mucosa Associated Lymphoid Tissue (MALT) Lymphoma.
Biarc J et al and Gold JS et al in 2004 proved that Streptococcus bovis mediated bacteremia linked with colonic and extracolonic malignancies.
Dehio in 2005 also observed a link between infection with Bartonella species and vascular tumor formation.
Also, Rao, et al in2006 and 2007 showed H. hepaticusto promote cancer formation in the mammary gland of mice by innate immune inflammatory response.
Wagenlehner et al in 2007 showed a link between infection of the prostate and prostatic carcinoma as PCR analysis of prostate tissue of prostate carcinoma patients showed sequences of the organisms Mycoplasma geniculatum and Chlamydia trachomatis.
Microbes induce an estimated 20% of all the fatal cancers in human beings, as suggested by Blaser in 2008.
19 Rosa DD et al in 2008 have presented cases where chronic mucocutaneous Candida infection was associated with esophageal cancer.
BACTERIA AND ORAL SQUAMOUS CELL CARCINOMA
Nagy KN et al.(1998), conducted a study on biofilms present on the surface of the oral SCC in patients suggested an increase of the Veillonella, Fusobacterium, Prevotella, Porphyromonas, Actinomyces and Clostridium, Hemophilus, Enterobacteriaceae and Streptococcus spp. compared to healthy mucosal surface of the same individuals.
Lara- Tejero et al (2000) showed that several infections cause intracellular accumulation of pathogens, Campylobacter jejuni in case of their study, thus leading to suppression of apoptosis primarily through modulation of the expression of Bcl-2 family proteins or by inactivation of retinoblastoma protein, pRb.
Several bacteria can cause chronic infections or produce toxins that disturb the cell cycle thus leading to altered cell growth( Koyi H et al., 2001,Anttila T et al., 2003Littman AJ et al., 2004).
20 According to Salaspuro MP (2003), another possible mechanism is the metabolism of potentially carcinogenic substances by the bacteria. In the oral cavity, where the pre-existing local microflora facilitate tumourogenesis by converting ethanol into its carcinogenic derivative, acetaldehyde to levels capable of inducing DNA damage, mutagenesis and secondary hyperproliferation of the epithelium. This is evidentially proven by increased levels of microbial acetaldehyde production in heavy drinkers and smokers.
Sheu BC in 2008 showed that cytokine reactions to play a role in the immune-related mechanisms of cancer development. Up-regulation of cytokines and other inflammatory mediators are shown to affect complex metabolic pathways thus creating a link between chronic infections and sugar metabolism, the products of which are shown to induce carcinogenesis.
RAGE ( receptor for advanced glycation end products), a member of immunoglobin protein family, expressed as a multi-ligand receptor expressed on various cell membranes, has also been suggested to play a role in carcinogenesis by Katz J et al in 2010. The protein has been shown to trigger multiple intracellular signaling molecules in several inflammation associated clinical diseases like diabetes and cancer.
21 EFFECT OF RADIOTHERAPY ON ORAL MICROFLORA
K.A.Abu Shara et al in 1992 studied the radiotherapeutic effect on oropharyngeal flora in 80 head and neck cancer patients so that it will help in controlling post-operative infections in patients who were already irradiated. Swabs were taken before and at the end of radiation therapy. They found significant increase in Staphylococcus aureus, beta hemolytic streptococci, Candida, Proteus and Pseudomonas aeruginosa. It was concluded from this study that irradiation has a significant effect on oropharyngeal flora.
M.Panduranga Kamath et al in 2002 studied the radiotherapeutic effect on oropharyngeal flora in head and neck cancer by culturing swabs from the tonsillar fossae, prior to commencement of radiotherapy and soon after completion of the full course, for aerobic, anaerobic bacteria and fungi. Commonest organisms isolated in the preirradiation group and controls were Streptococcus pneumoniae and Klebsiella species. Commonest organisms isolated from post irradiation group were Streptococcus viridans, Klebsiella speciesand Bacteroides species. Streptococcus pneumonia was found to be significantly decreased with irradiation compared to pre irradiation period. Moraxella species and Klebsiella also decreased with irradiation but organisms like Staphylococcus aureus, Pseudomonas species, Bacteroides species and Candida species showed marginal increase with irradiation.
22 They found that after radiotherapy, the colonies of Streptococci, Candida albicans, Staphylococcus aureus were found significantly increased while Neisseria were significantly decreased.
Mager et al (2005) conducted a study on 40 common salivary microbiota of oral squamous cell carcinoma patients and showed that six common bacteria - P. melaninogenica, Capnocytophaga gingivalis, Capnocytophaga ochracea, Eubacterium saburreum, Leptotrichia buccalis and Streptococcus mitis were found at significantly higher salivary levels in OSCC patients compared with the controls. Also, three of the 40 species tested namely, Capnocytophaga gingivalis, Prevotella melaninogenica and Streptococcus mitis were found to be elevated in the saliva of oral squamous cell carcinoma patients. Hence these three organisms have been suggested as salivary diagnostic markers for oral squamous cell carcinoma with 80% sensitivity.
Elerson Gaetti et al(2011) evaluated the occurrence of yeasts, pseudomonas and enteric bacteria in the oral cavity of patients undergoing radiotherapy for treatment of head and neck cancer. Saliva, mucosa and biofilm samples were collected from fifty patients before receiving RT, during therapy and 30 days after RT and microorganisms were detected by culture and polymerase chain reaction. Pseudomonas aeruginosa, Proteus, Klebsiella were found to be more prevalent organisms before onset of radiotherapy. They found that modifications in the oral environment due to RT treatment seemed to facilitate the colonization of oral cavity by members of family Enterobacteriaceae, genera Enterococcus and Candida.
23 Prevalent bacterial pathogens isolated were Staphylococcus aureus, Escherichia coli, Staphylococcus epidermidis, Pseudomonas aeruginosa, Klebsiella pneumonia, Proteus mirabilis, Proteus vulgaris and the fungal pathogens were Candida albicans and Aspergillus fumigatus.
24 The present study was carried out in 30 oral cancer patients with histopathologically proven oral squamous cell carcinoma of alveolus, buccal mucosa or tongue who are planned to receive radiotherapy. 30 normal healthy individuals without any habits formed the control group. Informed consent (Annexure I) was obtained from all the patients before collection of samples.
The study was performed after obtaining approval from the institutional ethical committee.
The patients were categorized into the following groups. Study group:
30 oral cancer patients with histopathologically proven oral squamous cell carcinoma of alveolus, buccal mucosa or tongue and are planned to receive radiotherapy of dosage 60 gy in 30 fractionated doses, at 2 Gy/day. The salivary samples were collected before the onset of radiotherapy and at completion of 30 Gy and 60 Gy.
Control group:
25 Part I: Cytomorphometric analysis
i. Armamentarium required for smear preparation a. Container for collection of saliva b. Ethanol
c. Micropipette with tips d. Test tubes
e. Centrifuge f. Glass slides g. Spray fixative ii. Collection of specimen:
Unstimulated whole saliva was collected from the patient. The patient was asked to rinse mouth with isotonic saline and was asked to spit into a sterile container.
26 iii. Staining of smears
Rapid pap staining kit (Biolab diagnostics) was used to stain the smears. Technique:
The kit consists of one solution for nuclear staining and two solutions (A and B) to be mixed in equal proportions for cytoplasmic staining (cytoplasmic working stain).
The marked slide was first hydrated by dipping slide in tap water for 1-3 minutes. Nuclear staining:
Excess water was blotted out from the slide and the slide was dipped in nuclear stain for 60 seconds. Then the slide was dipped in tap water for 45 seconds.
Excess water was blotted out and the slide was dipped in dehydrant (100% ethyl alcohol) with 2 changes for 30 seconds each.
Cytoplasmic staining:
Then the slide was dipped in cytoplasm working stain for 45 seconds. Then the slide was dipped in tap water for 1 minute.
Excess water was blotted out, the slide was dipped in alcohol (2 changes), then in xylene and mounted.
Image analysis
27 The nuclear and cell diameters were obtained by drawing two perpendicular lines along two planes in the nucleus and cell respectively and then obtaining the mean value of the two measurements. The data obtained were copied to excel sheet and means generated.
The means of all parameters(Annexure II) were then statistically analysed using Wilcoxon signed rank test for comparison between three stages in study group and using Mann Whitney U test for comparison between study and control group.
Part II: Bacterial Culture
i. Armamentarium required for culture a. Agar bases
i. Streptococcus mitis selective medium(Hi media) – Streptococcus mitis
ii. Wilkins chalgren medium (Hi media) – Prevotella melaninogenica iii. Tryptone soy agar ( for TBBP medium ) – Capnocytophaga
gingivalis b. Distilled water c. Conical flasks d. Autoclave e. Petri plates f. L- rod g. Test tubes
28 ii. Collection of salivary sample
The patient was asked to rinse mouth with isotonic saline and then was asked not to swallow for 10 minutes. It was made sure that the patient had not eaten anything for 1 hour before collection of sample and not used any mouthwash for 24 hours prior to sample collection. After 10 minutes, the patient was asked to spit into a sterile container. It was repeated until 2 – 3 ml saliva was collected.
iii. Preparation of culture media a. Streptococcus mitis
90.07 grams of agar was suspended in 1000 ml distilled water. It was heated to boiling to dissolve the medium completely. The medium was then sterilized by autoclaving at 15 lbs pressure (121°C) for 15 minutes. It was then cooled to 50-55°C and 1 ml of sterile 1% Potassium Tellurite Solution was added. It was mixed well and poured into sterile Petri plates.
b. Prevotella melaninogenica
43 grams of Wilkins Chelgren agar was suspended in 1000 ml distilled water. It was heated to boiling to dissolve the medium completely. The medium was then sterilized by autoclaving at 15 lbs pressure (121°C) for 15 minutes. It was then cooled to 50°C mixed gently and poured into sterile Petri plates.
c. Capnocytophaga gingivalis
29 The medium was then sterilized by autoclaving at 15 lbs pressure (121°C) for 15 minutes. After cooling to 50°C, Bacitracin 50 μg, sheep’s blood 2 ml and Polymyxin 100μg were added. Then the medium was poured into sterile Petri plates.
Culture method:
The collected sample of saliva was serially diluted with distilled water. Serial dilution :
0.5 ml of the salivary sample was added to 9.5 ml distilled water and mixed well. 1 ml of this solution is added to 9 ml distilled water to obtain102 dilution. Similarly, upto 106 dilution was obtained.
Spread plate method of culture was done. 0.1ml of 106 diluted salivary samples was poured into the petriplates with the selective media. Then the petriplates were placed in airtight jar along with anaerobic gas pack and left for 48 hours. After 48 hours, the plates were taken out and the number of colonies were counted.
Bergey’s Microbiology manual and biochemical tests were used to
30 BIOCHEMICAL TESTS
Streptococcus mitis Prevotella melaninogenica Capnocytophage gingivalis VP – negative
Urease – negative Catalase – negative
Mannitol – negative Lactose – positive Esculin hydrolysis - positive
Indole – negative Oxidase – negative Catalase – negative
Mannitol – negative Maltose – positive
Nitrate reduction – positive Alpha heamolysis
Indole – negative
Glucose – positive Lactose – positive Sucrose – positive Esculin – negative
The appearance of the colonies was as follows: Streptococcus mitis – Blue colonies
Prevotella melaninogenica – Pale yellow colonies Capnocytophaga gingivalis – Yellow to brown colonies
The numbers of colony forming units were counted manually after dividing the plate into four quadrants.
31 Figure 1- Micropipette, Slides, Glass Marking Pencil, Test Tube and Biofix
Spray
[image:40.612.154.526.325.579.2]32 Figure 3- Placement of Test Tube Containing Sample into Centrifuge
[image:41.612.212.466.258.507.2]33 Figure 5- Research Microscope with ProgRes Capture Pro 2.8 Software (Olympus Opto Systems India Pvt. Ltd,)
[image:42.612.110.449.384.664.2]34 Figure 7- Agars used for Media Preparation
[image:43.612.109.366.354.563.2]35 Figure 9- Potassium Tellurite for selective medium of Streptococcus mitis
[image:44.612.109.519.333.570.2]36 Figure 11- Pouring Selective Medium into the Plate
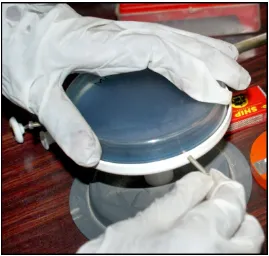
[image:45.612.109.547.405.585.2]37 Figure 13- Poured Plate Placed on Rotating Table
[image:46.612.109.543.380.543.2]38 Figure 15- Diluted Saliva into Petridish containing Selective Medium
[image:47.612.110.465.72.304.2] [image:47.612.110.541.360.647.2]39
[image:48.612.335.539.99.364.2]
Figure 17- Anaerobic Gas Jar with
Poured and Spread Plates Figure 18- Incubator
[image:48.612.110.391.445.676.2]40 RESULTS
NUCLEAR AREA Table I a
Descriptive Statistics for Nuclear Area
GROUPS
N MEAN
( μm2
)
STANDARD DEVIATION
MINIMUM ( μm2
)
MAXIMUM ( μm2
)
CONTROL 30 62.97 7.54 51.06 90.85
STAGE I 30 69.05 11.29 55.5 104.23
STAGE II 30 75.79 15.49 48.35 106.31
STAGE III 30 71.62 17.09 44.67 128.33
The mean value of nuclear area in normal group was 62.97 μm2, while it was 69.05 μm2, 75.79 μm2
and 71.62 μm2 in stage I, II and III of study group subjects respectively. Table I b
Comparison of Nuclear Area of study group at the three Stages
COMPARISON GROUPS Z VALUE P VALUE
STAGES I & II -1.800 0.072
STAGES II & III -1.594 0.111
STAGES I & III -0.422 0.673
Wilcoxon signed rank test
The study group data were assessed for significance using Wilcoxon signed ranks test and the p value was not found to be significant between various stages.
41 Table I c
Comparison of Nuclear Area of study group at each stage with control group
COMPARISON GROUPS Z VALUE P VALUE
CONTROL AND STAGE I -2.380 0.017*
CONTROL AND STAGE II -3.696 0.000***
CONTROL AND STAGE III -2.779 0.004***
Mann Whitney U test * Significant *** Highly significant Mann Whitney U test was used to compare the nuclear area of the controls with those of the study group at various stages. The results indicated that p value was found to be statistically significant between the groups.
Control vs Stage I – 0.017(significant) Control vs Stage II – 0.000(significant) Control vs Stage III – 0.004(significant)
CYTOPLASMIC AREA Table II a
Descriptive Statistics for Cytoplasmic Area
GROUPS
N MEAN
( μm2
)
STANDARD DEVIATION
MINIMUM ( μm2
)
MAXIMUM ( μm2
)
CONTROL 30 2233.48 238.42 1716.0489 2794.0286
STAGE I 30 2069.39 551.65 1413.84 3833.03
STAGE II 30 2137.99 830.55 1187.61 5621.64
42 The mean value of cytoplasmic area in control group was 2233.48 μm2, while it was 2069.39 μm2, 2137.99 μm2 and 1924.03 μm2
in stage I, II and III of study group subjects respectively.
Table II b
Comparison of Cytoplasmic Area of study group at the three Stages
COMPARISON GROUPS Z VALUE P VALUE
STAGES I & II -0.586 0.558
STAGES II & III -1.368 0.171
STAGES I & III -1.429 0.153
Wilcoxon signed rank test
The study group data were assessed for significance using Wilcoxon signed ranks test and the p value was not found to be significant between various stages.
Stage I and II – 0.558 Stages II and III – 0.171 Stages I and III – 0.153
Table II c
Comparison of Cytoplasmic Area of study group at each stage with control group
COMPARISON GROUPS Z VALUE P VALUE
CONTROL AND STAGE I -2.5558 0.011**
CONTROL AND STAGE II -1.922 0.05*
CONTROL AND STAGE III -2.691 0.007***
43 Mann Whitney U test was used to compare the cytoplasmic area of the controls with those of the study group at various stages. The results indicated that p value was found to be statistically significant between the groups.
Control vs Stage I – 0.011 Controll vs Stage II – 0.055 Control vs Stage III – 0.007
NUCLEAR DIAMETER Table III a
Descriptive Statistics for Nuclear Diameter
GROUPS N MEAN
( μm)
STANDARD DEVIATION
MINIMUM ( μm)
MAXIMUM ( μm)
CONTROL 30 9.101 0.53 8.23 10.8369
STAGE I 30 9.46 0.63 8.59 11.17
STAGE II 30 9.85 1.01 7.96 11.82
STAGE III 30 9.56 1.01 7.55 12.43
The mean value of nuclear diameter in normal group was 9.101 μm, while it was 9.46μm, 9.85μm and 9.56 μm in stage I, II and III of study group subjects respectively.
Table III b
Comparison of Nuclear Diameter of study group at the three Stages
COMPARISON GROUPS Z VALUE P VALUE
STAGES I & II -1.779 0.075
STAGES II & III -1.820 0.069
STAGES I & III -0.381 0.704
44 The study group data were assessed for significance using Wilcoxon signed ranks test and the p value was not found to be significant between various stages.
Stage I and II – 0.075 Stages II and III – 0.069 Stages I and III – 0.704
Table III c
Comparison of Nuclear Diameter of study group at each stage with control group
COMPARISON GROUPS Z VALUE P VALUE
CONTROL AND STAGE I -2.3006 0.021*
CONTROL AND STAGE II -3.460 0.001***
CONTROL AND STAGE III -2.646 0.008***
Mann Whitney U test * Significant *** Highly significant
Mann Whitney U test was used to compare the nuclear diameter of the controls with those of the study group at various stages. The results indicated that p value was found to be statistically significant between the groups.
45 CELL DIAMETER
Table IV a
Descriptive Statistics for Cell Diameter
GROUPS N MEAN
( μm)
STANDARD DEVIATION
MINIMUM ( μm)
MAXIMUM ( μm)
CONTROL 30 54.37 2.58 47.67 60.99
STAGE I 30 51.92 6.20 43.28 67.86
STAGE II 30 52.42 9.09 40.47 85.94
STAGE III 30 50.07 7.07 34.98 63.58
The mean value of cell diameter in control group was 54.37 μm, while it was 51.92 μm,52.42μm and 50.07 μm in stage I, II and III of study group subjects respectively.
Table IV b
Comparison of Cell Diameter of study group at the three Stages
COMPARISON GROUPS Z VALUE P VALUE
STAGES I & II -0.216 0.829
STAGES II & III -1.306 0.192
STAGES I & III -1.347 0.178
Wilcoxon signed rank test
The study group data were assessed for significance using Wilcoxon signed ranks test and the p value was not found to be significant between various stages.
46 Table IV c
Comparison of Cell Diameter of study group at each stage with control group
COMPARISON GROUPS Z VALUE P VALUE
CONTROL AND STAGE I -2.587 0.010**
CONTROL AND STAGE II -2.025 0.043*
CONTROL AND STAGE III -2.469 0.014**
Mann Whitney U test * Significant ** *** Highly significant
Mann Whitney U test was used to compare the cell diameter of the controls with those of the study group at various stages. The results indicated that p value was found to be statistically significant between the groups.
Control vs Stage I – 0.010 (Significant) Control vs Stage II – 0.043 (Significant) Control vs Stage III – 0.014 (Significant)
NUCLEAR CYTOPLASMIC RATIO Table V a
Descriptive Statistics for Nuclear Cytoplasmic Ratio
GROUPS N MEAN STANDARD
DEVIATION
MINIMUM MAXIMUM
CONTROL 30 0.03 0.002 0.026 0.035
STAGE I 30 0.036 0.006 0.026 0.05
STAGE II 30 0.039 0.007 0.016 0.054
47 The mean value of nuclear cytoplasmic ratio in normal group was 0.03, while it was 0.036, 0.039 and 0.04 in stage I, II and III of study group subjects respectively.
Table V b
Comparison of Nuclear Cytoplasmic Ratio of study group at the three Stages
COMPARISON GROUPS Z VALUE P VALUE
STAGES I & II -2.129 0.033*
STAGES II & III -0.977 0.329
STAGES I & III -2.335 0.020*
Wilcoxon signed rank test * Significant
The study group data were assessed for significance using Wilcoxon signed ranks test and the p value was found to be significant between Stage I & II and between stage I & III.
Stage I and II – 0.033 (Significant) Stages II and III – 0.329
[image:56.612.79.559.181.303.2]Stages I and III – 0.020 (Significant) Table V c
Comparison of Nuclear Cytoplasmic Ratio of study group at each stage with control group
COMPARISON GROUPS Z VALUE P VALUE
CONTROL AND STAGE I -4.317 0.000***
CONTROL AND STAGE II -5.441 0.000***
CONTROL AND STAGE III -5.544 0.000***
48 Mann Whitney U test was used to compare the nuclear cytoplasmic ratio of the
controls with those of the study group at various stages. The results indicated that p value was found to be statistically significant between the groups.
Control vs Stage I – 0.000 (Significant) Control vs Stage II – 0.000 (Significant) Control vs Stage III – 0.000 (Significant)
Streptococcus mitis Table VI a
Descriptive Statistics for Streptococcus mitis count in study and control groups
GROUPS N MEAN
( X 106 CFU/ml)
STANDARD DEVIATION
MINIMUM ( X 106 CFU/ml
MAXIMUM ( X 106 CFU/ml )
CONTROL 30 161.43 74.564 28 289
STAGE I 30 247.07 59.101 168 386
STAGE II 30 208.87 55.944 103 294
STAGE III 30 167.03 43.090 93 260
The mean value of Streptococcus mitis in control group was 161.43 x 10⁶ CFU/ml saliva, while it was 247.07 x 10⁶ CFU/ml , 208.87 x 10⁶ CFU/ml and 167.03 x 10⁶ CFU /ml in stage I, II and III of study group subjects respectively.
Table VI b
Comparison of Streptococcus mitis in study group at the three Stages
COMPARISON GROUPS Z VALUE P VALUE
STAGES I & II -4.721 0.000***
STAGES II & III -4.721 0.000***
STAGES I & III -4.782 0.000***
49 The study group data were assessed for significance using Wilcoxon signed ranks test and the p value was not found to be significant between various stages.
Stage I and II – 0.000 (Significant) Stages II and III – 0.000 (Significant) Stages I and III – 0.000 (Significant)
Table VI c
Comparison of Streptococcus mitis in study group at each stage with control group
COMPARISON GROUPS Z VALUE P VALUE
CONTROL AND STAGE I -3.940 0.000***
CONTROL AND STAGE II -2.388 0.017**
CONTROL AND STAGE III -0.251 0.802
Mann Whitney U test ** *** Highly significant
Mann Whitney U test was used to compare the Streptococcus mitis of the controls with those of the study group at various stages. The results indicated that p value was found to be statistically significant between Control & stage I and between control & stage II.
50 Prevotella melaninogenica
Table VII a
Descriptive Statistics for Prevotella melaninogenica count in study group and control group
GROUPS N MEAN
( X 106 CFU/ml )
STANDARD DEVIATION
MINIMUM ( X 106 CFU/ml )
MAXIMUM ( X 106 CFU/ml )
CONTROL 30 22.97 10.67 9 58
STAGE I 30 49.33 18.417 21 94
STAGE II 30 33.93 12.020 16 69
STAGE III 30 26.30 9.966 11 48
The mean value of Prevotella melaninogenica in control group was 22.97, while it was 49.33 x 10⁶ CFU/ml , 33.93 x 10⁶ CFU/ml and 26.30 x 10⁶ CFU/ml in stage I, II and III of study group subjects respectively.
Table VII b
Comparison of Prevotella melaninogenica in study group at the three Stages
COMPARISON GROUPS Z VALUE P VALUE
STAGES I & II -4.701 0.000***
STAGES II & III -3.408 0.001***
STAGES I & III -4.784 0.000***
Wilcoxon signed rank test *** Highly significant
The study group data were assessed for significance using Wilcoxon signed ranks test and the p value was found to be significant between various stages.
51 Table VII c
Comparison of Prevotella melaninogenica in study group at each stage with control group
COMPARISON GROUPS Z VALUE P VALUE
CONTROL AND STAGE I -5.398 0.000***
CONTROL AND STAGE II -3.536 0.000***
CONTROL AND STAGEIII -1.443 0.149
Mann Whitney U test *** Highly significant
Mann Whitney U test was used to compare the Prevotella melaninogenica of the controls with those of the study group at various stages. The results indicated that p value was found to be statistically significant between the groups.
Control vs Stage I – 0.000 (Significant) Control vs Stage II – 0.000 (Significant) Control vs Stage III – 0.149
Capnocytophaga gingivalis Table VIII a
Descriptive Statistics for Capnocytophaga gingivalis count in study group and control group
GROUPS N MEAN
( X 106 CFU/ml )
STANDARD DEVIATION
MINIMUM ( X 106 CFU/ml )
MAXIMUM ( X 106 CFU/ml )
NORMAL 30 4 1.03 1 5
STAGE I 30 7.90 2.975 4 17
STAGE II 30 5.90 2.734 3 16
52 The mean value of Capnocytophaga gingivalis in control group was 4x 10⁶ CFU/ml saliva while it was 7.90 x 10⁶ CFU/ml, 5.90 x 10⁶ CFU/ml and 4.40 x 10⁶ CFU/ml in stage I, II and III of study group subjects respectively.
Table VIII b
Comparison of Capnocytophaga gingivalis in study group at the three Stages
COMPARISON GROUPS Z VALUE P VALUE
STAGES I & II -4.136 0.000***
STAGES II & III -3.202 0.001***
STAGES I & III -4.623 0.000***
Wilcoxon signed ranks test *** Highly significant
The study group data were assessed for significance using Wilcoxon signed ranks test and the p value was found to be significant between various stages.
Stage I and II – 0.000 (Significant) Stages II and III – 0.001 (Significant) Stages I and III – 0.000 (Significant)
Table VIII c
Comparison of Capnocytophaga gingivalis in study group at each stage with control group
COMPARISON GROUPS Z VALUE P VALUE
CONTROL AND STAGE I -6.580 0.000***
CONTROL AND STAGE II -5.919 0.000***
CONTROL AND STAGE III -3.806 0.000***
53 Mann Whitney U test was used to compare the Capnocytophaga gingivalis of the controls with those of the study group at various stages. The results indicated that p value was found to be statistically significant between the groups.
54 CHARTS SHOWING CYTOLOGICAL PARAMETERS
55 CHARTS SHOWING BACTERIAL COUNTS
0
100 200 300
0 20 40 60
0 2 4 6 8
Control (
Stage I (
Stage II (
56 Figure 20: Photomicrographs (40X) Showing Exfoliated Cells in Control Groups – PAP
Figure 21: Photomicrographs (40X) Showing Exfoliated Cells in Stage I – PAP
[image:65.612.92.517.458.617.2]57 Figure 23: Photomicrographs (40X) Showing Exfoliated Cells in Stage III – PAP
[image:66.612.100.527.297.474.2]CYTOMORPHOMETRIC ANALYSIS Nuclear Area & Cytoplasmic Area
Figure 24: Photomicrographs (40X) Showing Exfoliated Cell Cytomorphometry in control and study groups – PAP
Nuclear & Cell Diameter
[image:66.612.88.521.512.679.2]58 BACTERIAL CULTURE
[image:67.612.92.263.290.458.2]Figure 26: Colonies Of Streptococcus Mitis (Blue)
Figure 27: Colonies of Prevotella melaninogenica (Yellow)
[image:67.612.91.262.490.658.2]59 BIOCHEMICAL TESTS
[image:68.612.326.512.100.358.2]
Figure 29: Tests to confirm Figure 30: Tests to confirm
Streptococcus mitis Prevotella melaninogenica
[image:68.612.91.464.395.675.2]60 DISCUSSION
Radiation Therapy (RT) is an important treatment modality in Oral Squamous Cell Carcinoma. It is used alone or combined with chemotherapy. The reaction of the tumor tissue to RT has been shown to vary between individuals hence making it difficult to assess and predict the treatment outcome for patients. (Vineet Raj et al., 2010)
Exfoliative cytology, a simple, non-invasive and economical tool for diagnosis had its use limited in oral squamous cell carcinoma because of the subjective nature of its interpretations and false negative results (Sivapathasundaram et al,2004). But image analysis technique enables quantification of nuclear and cellular changes from normal on an objective basis and this has been used in various studies to establish relationship between tumor response and morphological changes in the cells (Smitha T et al, 2011). An association between oral cancer and bacteria has been studied since many years as various discoveries suggested the role of bacteria in many cancers. Three bacterial species, namely, Streptococcus mitis, Prevotella melaninogenica and Capnocytophaga gingivalis have been shown to be increased in oral squamous cell carcinoma patients (DL Mager et al, 2005).
61 Most common causes of sepsis are pneumonia and septicemia caused by gram negative bacilli (Inagarki et al 1974).
The present study was carried out in 30 patients who were histopathologically diagnosed with oral squamous cell carcinoma and planned RT with 60Gy radiation in 30 fractionated doses at 2 Gy/day for 5 days a week and 30 normal healthy individuals. Saliva samples were collected from all subjects belonging to study group; before RT, at 2 weeks (30Gy) and 4 weeks (60Gy) and also from the control group.
The samples were also centrifuged, smeared, PAP stained and analyzed cytomorphometrically for the following parameters:
Nuclear Diameter
Nuclear Area
Cell diameter
Cytoplasmic area
Nuclear cytoplasmic ratio
The samples were cultured for the 3 organisms namely, Streptococcus mitis, Prevotella melaninogenica and Capnocytophaga gingivalis to analyse the effect of radiotherapy on these organisms.
Cytomorphometric analysis
This study showed an increased mean value of nuclear area in oral squamous cell carcinoma subjects compared to controls. The mean value of nuclear area in the control group was 62.97μm2 while it was 69.05μm2, 75.79 μm2
62 These differences between the control and study group (in all the 3 stages), were found to be statistically significant, the p values being 0.017, 0.000 and 0.004 respectively.
The mean value of nuclear areas in case of the study group subject was seen to be increased at stage II compared to stage I, with decrease in the value again at stage III. However, these values were not found to show any statistical significance. (Stage I and II: p value – 0.072; Stage II and II: p value – 0.111; Stage I and III: p value – 0.673)
The increase in nuclear area in cases of squamous cell carcinoma(stage I) compared to normal as shown in this study is due to increase in nuclear contents for replication. (Frost, 1997). A significantly increased nuclear area in malignant cells was also demonstrated by Cowpe in 1984, in his study of comparison of normal and abnormal (oral lesions like leukoplakia,lichen planus and oral cancer) oral mucosal squames. With radiation, the increase in nuclear area denotes good response to therapy as showed by BM Biswal et al in 2010. The increase in nuclear size is followed by nuclear fragmentation and then cell death. However, the differences in nuclear area between three stages of radiotherapy in study subjects was not found to be significant in our study. This may be due to marked inter-individual variability in radiation response (V.Raj et al, 2010) or the cellular changes may be significant only 8 weeks following radiotherapy (D.Agarwal et al).
63 The difference in values between stage I and II, stage II and III and stage I and III did not show any statistical significance, the p values being 0.075, 0.069 and 0.704 respectively. However, all three stages showed a statistically significant difference from the control group (p values – 0.021, 0.001 and 0.008).
The increased nuclear diameter in study group subjects at stage I compared to control group is in concordance with various studies showing increased nuclear parameters due to increased nuclear contents for replication. In the study subjects, mean nuclear diameter was found to be increased at stage II compared to stage I and very little drop in the value at stage III. These changes were not statistically significant. Similar findings in oral squamous cell carcinoma patients were observed by S.Silverman et al, who showed an increase in nuclear diameter at 2 to 3 weeks and then a decrease though statistically significant changes were observed 8 weeks after onset of radiotherapy.
The mean cytoplasmic area of the control group was 2233.48 μm2 and those of the study group at three stages were 2069.39, 2137.99 and 1924.03. There was a reduction in the mean cytoplasmic area in the study group when compared to the control group and this difference was found to be statistically significant with the difference between control and stage III being highly significant (p value – 0.007).
64 The decreased cytoplasmic area in oral squamous cell carcinoma patients at stage I compared to normal healthy individuals is due to decreased ability of the cytoplasm to mature as the malignant cells show increased activity (Frost et al, 1997). Also, the amount of cytoplasm made by the cell is less compared to the nucleoplasm and the decreased cytoplasmic area is a significant change occurring in an actively proliferating cell. (Cancado et al, 2004). There is an increase in cytoplasmic area observed in stage II which may be due to cell enlargement which is an acute radiation change as observed by HG Ahmed et al in oral squamous cell carcinoma patients.. The reduction in value at stage III may be due to variable radiation response of tumor cells as reported by BM Biswal et al in 2010 from his study in patients with squamous cell carcinoma of head and neck.
The mean value of the cell diameter observed in the present study in the control group was 54.37μm. There was a reduction in the mean values of cell diameter in all the
three stages in the study group, the mean values be