May 2008
Policy Analysis Unit
Bangladesh Bank
Should Bangladesh Monitor Core Inflation
for Conducting Monetary Policy?
Should Bangladesh Monitor Core Inflation for Conducting Monetary
Policy?
*
1. Introduction
One of the central objectives of traditional monetary policy is inflation control since the belief is that, among others, low inflation helps to improve resource allocation and fosters rapid and stable economic growth. The view also holds that inflation is primarily a monetary phenomenon so that low inflation is to be achieved mainly through aggregate demand control by pursuing contractionary monetary (and fiscal) policies. It is argued that these policies should also be supported by liberalization, privatization, and other macroeconomic reforms to create a more open and competitive economy driven by the private sector. In short, the argument is that there exists a trade off between inflation and growth (alternatively between inflation and unemployment) thatmakes inflation targeting as the dominant paradigm in monetary policy.
Over the years, the Bangladesh Bank (BB) has been using changes in consumer price index (CPI) inflation as the operational guide to measuring price stability in Bangladesh.1 In recent years, it has however been argued that as a short and/or medium term guide to the operation of monetary policy, CPI inflation has limitations especially due to the existence of some volatile and non-trend components within the CPI (Berkmen 2002, Bagliano and Morana 2003).2 Often, the sources of short term fluctuations in CPI inflation may lie in some components that are transitory and reversible; and these may be characterized by supply-side shocks or other non-monetary events. It is important, therefore, to exclude the impact of these transitory phenomena in measuring price level changes for the purpose of policy decisions of the monetary authority (see Bryan and Cecchetti 1993).3
Conceptually, core inflation separates out the persistent components from the transitory components in the CPI in order to provide information relevant for conducting monetary policy operations. Thus core inflation provides a measure of price changes resulting from underlying monetary inflation excluding the transitory impact on the cost of living. From the policy point of view, the information generated by core inflation is useful to take credible decisions avoiding the risk of introducing quick changes in the monetary policy framework due to short-term fluctuations in CPI resulting from transitory non-monetary phenomena.4
* This note has been prepared by Md. Shahiduzzaman and M. Golam Mortaza, Research Economists at the Policy Analysis Unit (PAU), Bangladesh Bank. Views expressed in this note are the authors' own and in no way represent those of the Bangladesh Bank. The authors are grateful to Mustafa K. Mujeri, Chief Economist, Bangladesh Bank for his comments and suggestions.
1
For monitoring price changes, BB uses both the 12-month average and point-to-point CPI inflation.
2
In the case of CPI inflation based on 12-month moving average, although volatility is somewhat reduced, the past influence dominates the series of average inflation reducing its relevance to current policy stance. On the other hand, point-to-point CPI inflation remains distorted by short term fluctuations.
3
In order to separate out such effects, the central banks in a number of countries, such as Canada, South Korea, Philippines, and US monitor core inflation as a short term operational guide to monetary policy formulation.
4
This note uses relevant statistical measures to provide estimates of core inflation in Bangladesh. The paper is organized in five sections. After this brief introduction, section 2 provides a brief review of the concept of core inflation and its estimation procedures, while section 3 examines the characteristics of price data and the current methodology of constructing CPI in Bangladesh. Section 4 provides statistical estimates of core inflation in Bangladesh. Finally, section 5 contains some concluding remarks.
2. The Concept of Core Inflation and Its Estimation
The concept of core inflation is related to the long run or the persistent component of measured price changes that is tied to money supply growth (Bryan and Cecchetti 1993). In practice, it is taken as the persistence part or the generalized component of measured inflation (Quah and Vahey 1995, Roger 1998, Berkmen 2002). The central objective of computing core inflation is to separate out the components of inflation that are caused by non-monetary events as these price changes do not reflect the impact of underlying monetary policy decisions. Such events may include natural disasters (such as floods and cyclones), volatility in international markets, and/or other macroeconomic and sector specific shocks.
Several alternative techniques are available for estimating core inflation that reflects the underlying trend in price developments. A common approach is the exclusion method that involves subjective decision of excluding prices of selected commodities from the aggregate price index (see, for instance, Clark 2001, Macklem 2001, Samanta 1999, Tahir 2003). The practice is to exclude some pre-specified components from the CPI basket that are considered highly volatile to supply shocks. For example, frequently excluded items from the CPI often include some food and energy prices.5
Another alternative method is to use limited influence estimators, such as trimmed mean and weighted median, by which temporary noise components are eliminated (Bryan and Cecchetti 1993). The limited influence estimators average out only the central part of the distribution after truncating the outliers. For example, the truncated mean removes large relative changes in each month using statistical criteria.
A third alternative is to use an economic or model based approach which is founded on the assumption of long term neutrality of money. According to this method, core inflation is taken as that part of measured inflation which has no medium or long term effects on real output. For the purpose, bivariate structural autoregression model or its extensions are generally used (Quah and Vahey 1995, Garner and Wehinger 1998).
Among the alternatives, obviously the exclusion method is somewhat transparent and is not difficult to comprehend; the use of which is also facilitated by the easy availability of data. However, a major disadvantage of this method is that since a fixed set of items is excluded at every period, this may lead to loss of relevant information for predicting the The reason is that the central bank measures and monitors core inflation which filters out the most volatile components of CPI taking into account the sectoral heterogeneity of price setting mechanisms in an economy. This helps in improved understanding of medium term inflationary pressures in the economy. This also explains as to why the central bank’s reaction to shocks is sometimes considered too cautious. See, Aoki 2001, Cristadoro et. al. 2005, Lenza 2007.
5
trend inflation as not all excluded components are likely to be equally volatile in every period. The trimmed mean approaches are more relevant when the distribution of sector specific shocks is skewed. On the other hand, the model based approach, though complex in terms of implementation, has clear economic interpretations with forward looking characteristics.
3. Current Approach to Constructing CPI and Characteristics of Price Data
[image:4.612.91.525.335.605.2]In Bangladesh, the Bangladesh Bureau of Statistics (BBS) as the country’s official statistical organization collects commodity-wise price data on a monthly basis from both rural and urban areas and constructs the CPI. The current practice of calculating national CPI is, first, to compute separate CPIs for rural and urban areas using monthly commodity-wise price data based on field-level surveys on a monthly basis and average commodity weights derived from the consumption baskets.6 In the second stage, the national CPI is calculated as the weighted (using the share of population as weights) average of the CPIs for rural and urban areas; giving 70.9 percent weight to the rural CPI and 29.1 percent to the urban CPI. At present, 215 commodities and services are included in the rural CPI while the number of items is 302 in the urban CPI.7
Table 1: Descriptive statistics of month-to-month price changes (annualized rate)
FY01 FY02 FY03 FY04 FY05 FY06 FY07 FY08*
National
Mean 1.65 3.53 4.92 5.50 7.15 7.32 8.90 7.06 Median 2.66 4.26 3.58 5.19 7.13 9.71 11.81 10.16 Std. dev. 4.03 3.52 3.35 2.82 9.59 9.49 13.90 12.00 Skewness -2.75 -1.29 0.65 0.10 0.73 -0.88 -0.65 0.09 Kurtosis 8.52 2.42 -1.22 -1.49 2.29 0.49 -0.80 0.01
Rural
Mean 1.51 3.35 5.22 5.55 7.33 7.45 8.85 7.28 Median 2.65 4.35 3.48 5.58 7.62 10.88 12.87 10.41 Std. dev. 4.85 3.50 3.77 2.92 9.99 9.88 14.37 13.34 Skewness -2.70 -1.33 0.65 -0.08 0.58 -1.14 -0.68 0.09 Kurtosis 8.27 2.89 -1.00 -1.42 2.10 1.09 -0.73 -0.06
Urban
Mean 1.98 3.96 4.19 5.38 6.71 7.01 9.04 6.51 Median 1.87 3.03 3.68 5.11 5.24 6.77 10.34 9.18 Std. dev. 3.22 4.36 4.68 3.04 9.28 8.96 13.21 8.71 Skewness -0.33 -0.19 0.00 0.42 0.97 -0.09 -0.74 0.08 Kurtosis 0.24 -0.20 1.34 -0.80 1.74 -0.75 -0.07 0.27
No. of observations 12 12 12 12 12 12 12 9
Note: * covers the period of July 2007 to March 2008. Source: Authors’ calculation
Some descriptive statistics of month-to-month changes in CPI inflation in Bangladesh are provided in Table 1. In terms of the distribution of price changes in a particular fiscal year (FY), the mean value of the inflation rate is lowest in FY01 at the rural, urban and
6
The weights currently used are taken from the Report of the Household Expenditure Survey (HES) 1995-96.
7
national levels. Excluding FY08 (since the data covers only nine months), the mean value is highest in FY07 at the national, rural and urban levels. Both the mean and the median show a rising tendency of inflation rates during FY01-FY08. The standard deviation has an increasing trend since FY01 reflecting excessive volatility in the monthly price indices in recent years. In terms of skewness, the coefficient varies considerably from negative to positive on year to year basis. The kurtosis of the distribution of the price changes is always lower than 3 during the sample period except in FY01 at the national and rural levels with considerable variation in the coefficients at national, rural and urban levels. Figure 1 presents monthly inflation rates i.e., point to point (p-t-p), moving average (MA) and month to month (m-t-m) inflation rates over the period of 2001:07-2008:03 at the national level. This shows that the deviations from the trend inflation (MA) are relatively large, and demonstrates quick reversals in all of the two cases. Such deviations and quick reversals indicate the presence of noise in the inflation data pointing out the importance of computing core inflation in Bangladesh.
Figure 1: Monthly inflation rates, 2001:07-2008:03
0.0 2.0 4.0 6.0 8.0 10.0 12.0 14.0 Ju l-0 1 N o v-01 M a r-0 2 Ju l-0 2 N o v-02 M a r-0 3 Ju l-0 3 N o v-03 M a r-0 4 Ju l-0 4 N o v-04 M a r-0 5 Ju l-0 5 N o v-05 M a r-0 6 Ju l-0 6 N o v-06 M a r-0 7 Ju l-0 7 N o v-07 M a r-0 8 (i n p e r c e n ta g e ) -2.0 -1.5 -1.0 -0.5 0.0 0.5 1.0 1.5 2.0 2.5 3.0
12 month Moving Average Inflation (point to point) month to month inflation
Source: BBS
4. Measuring Core Inflation in Bangladesh
Central banks around the world are increasingly monitoring core inflation for policy purposes, along with CPI and other measures of inflation. Many developed countries routinely publish and monitor core inflation along with general inflation. The Bank of Canada, for instance, uses changes in CPI inflation as the inflation control target, while core inflation is used as the short term operational guide to monetary policy formulation. In South and Southeast Asia, many countries such as Pakistan, Philippines, and Thailand regularly publish and monitor core inflation. Recently, Sri Lanka has started to monitor core inflation measured by non-food and non-energy items.
understanding of the nature of volatilities in the CPIs, three variants of core inflation have been provided using alternative exclusion principles: (i) coreXFE, denoting core inflation measured by excluding food and energy items; (ii) core XVI indicating core inflation measured by excluding all volatile items; and (iii) coreXVG giving core inflation measured by excluding volatile groups of commodities. The first two measures of core inflation (coreXFE and coreXVI) are computed by using all items included in CPIs in rural (215 items) and urban (302 items) areas; while coreXVG is derived using 27 broad categories of items in both rural and urban areas.
[image:6.612.109.506.300.522.2]As mentioned above, a typical example of exclusion method is to construct core inflation by using CPI excluding food and energy (Appendix 1). Figure 2 shows the movement of core inflation (coreXFE) measured by excluding food and energy (kerosene and petrol) items in recent months. It is evident that while the CPI inflation continues to show an upward trend in recent months, coreXFE shows a slight declining trend since June 2007. In addition, core inflation remains mostly flat during September-November 2007 while the CPI inflation (p-t-p) experiences a steep rise.
Figure 2: CPI inflation vis-à-vis core inflation (excluding food and energy)
2.0 4.0 6.0 8.0 10.0 12.0
Ja n-07
Fe b-07
Mar -07
Apr -07
May -07
Ju n-07
Jul-0 7
Aug -07
Se p-07
Oct -07
Nov -07
In
fl
a
ti
o
n
(p
-t
-p
,
%
)
General coreXFE
One potential problem of the above approach under which the core inflation is measured by excluding all food and energy items is that it results in substantial loss in commodity weights in the CPI. In Bangladesh, the core inflation as measured above through exclusion of all food and energy components, for instance, retained around 39 percent of the weights of the CPI.8
Another limitation of the exclusion of food and energy items is that all food and energy items may not show higher volatility relative to non-food and non-energy items included in the CPI. It is possible that some non-food items are more volatile as compared with food and energy items. In addition, energy prices are administered and highly subsidized in Bangladesh. Therefore, as the energy prices are periodically adjusted, market prices of energy products are relatively stable at least over the period of non-adjustment. In the
8
case of Bangladesh, it is important therefore to identify specific volatile items, rather than taking all food and energy items as most volatile, in order to measure core inflation. Some volatile items, as measured by standard deviations of month-to-month changes in prices for the period January 2006 to November 2007, are given in Appendix 2. While most food items appear to be volatile, there are some non-food items that show high volatility. Taking into account the differences in the volatility among different items, we can set a cut-off value of standard deviation in order to exclude some items for measuring core inflation. In the present exercise, the cut-off standard deviation value has been set at 2, using the trial and error method. Accordingly, items which have standard deviation value of less than 2 in both rural and urban areas have been included in measuring core inflation. Figure 3 shows the core inflation as measured by excluding volatile items (coreXVI) which have standard deviation value of higher than 2. Unlike the CPI inflation, the core inflation shows a relatively stable rate of inflation since April 2007. In this case, 42.3 percent of the total CPI weight is retained.
Figure 3: CPI inflation vis-à-vis core inflation (excluding all volatile items)
2.0 4.0 6.0 8.0 10.0 12.0
Ja n-07
Fe b-07
Ma r-07
Apr -07
May -07
Ju n-07
Jul-0 7
Aug -07
Se p-07
Oct -07
Nov -07
In
fl
a
tio
n
(p
-t-p
,
%
)
General coreXVI
Thus, excluding all volatile items from CPI to measure core inflation retains more weight (42.3 percent) as compared with the earlier method that excludes all food and energy items (39 percent). In addition, the approach is more transparent in terms of rule-based justification and intuitively clearer than the earlier method of exclusion of all food and energy items.9
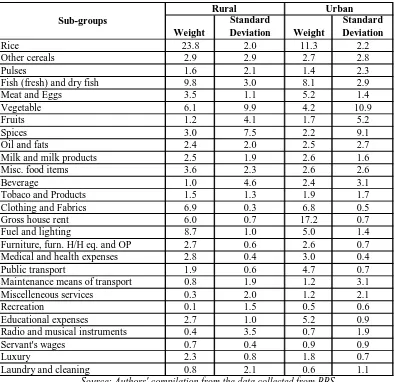
Finally, we have measured core inflation using 27 sub-groups of CPI, which covered data over a relatively longer period enabling the analysis of both short and long run
dynamics.10 Table 2 reports the weights and standard deviations of the monthly changes
for 27 commodity sub-groups of rural and urban CPIs for the period, January 2006 to January 2008. From the table, it can be seen that food items especially vegetables, spices, fish, and fruits show high volatility. There are also some components in the non-food
9
The degree of exclusion also does not differ much from the practices elsewhere. For example, the Australian Treasury excludes roughly half of the components of CPI.
10
group, such as maintenance means of transport in urban areas and radio and musical instrument in rural areas that have shown high volatility as compared with other non-food components and some components of food categories.
[image:8.612.110.505.186.568.2]
Table 2: Weights and standard deviations of monthly price changes of CPI commodity subgroups
(January 2004 to January 2008)
Weight
Standard
Deviation Weight
Standard Deviation
Rice 23.8 2.0 11.3 2.2
Other cereals 2.9 2.9 2.7 2.8
Pulses 1.6 2.1 1.4 2.3
Fish (fresh) and dry fish 9.8 3.0 8.1 2.9
Meat and Eggs 3.5 1.1 5.2 1.4
Vegetable 6.1 9.9 4.2 10.9
Fruits 1.2 4.1 1.7 5.2
Spices 3.0 7.5 2.2 9.1
Oil and fats 2.4 2.0 2.5 2.7
Milk and milk products 2.5 1.9 2.6 1.6
Misc. food items 3.6 2.3 2.6 2.6
Beverage 1.0 4.6 2.4 3.1
Tobaco and Products 1.5 1.3 1.9 1.7
Clothing and Fabrics 6.9 0.3 6.8 0.5
Gross house rent 6.0 0.7 17.2 0.7
Fuel and lighting 8.7 1.0 5.0 1.4
Furniture, furn. H/H eq. and OP 2.7 0.6 2.6 0.7
Medical and health expenses 2.8 0.4 3.0 0.4
Public transport 1.9 0.6 4.7 0.7
Maintenance means of transport 0.8 1.9 1.2 3.1
Miscelleneous services 0.3 2.0 1.2 2.1
Recreation 0.1 1.5 0.5 0.6
Educational expenses 2.7 1.0 5.2 0.9
Radio and musical instruments 0.4 3.5 0.7 1.9
Servant's wages 0.7 0.4 0.9 0.9
Luxury 2.3 0.8 1.8 0.7
Laundry and cleaning 0.8 2.1 0.6 1.1
Rural Urban Sub-groups
Source: Authors' compilation from the data collected from BBS
Figure 4: CPI inflation vis-à-vis core inflation (excluding volatile groups) 0.0 2.0 4.0 6.0 8.0 10.0 12.0 14.0 Jan -07 Fe b -0 7 M a r-0 7 Ap r-0 7 Ma y -0 7 Jun-0 7 Ju l-0 7 Au g -0 7 Se p -0 7 Oc t-0 7 N ov-0 7 De c -0 7 Jan -08 In fla tio n (p -t-p , % )
General coreXVG
Evaluation of alternative core inflation measures
Table 3 reports the CPI inflation as well as the three alternative measures of core inflation on a monthly basis for the period, January 2007 to January 2008. It is evident that all three measures of core inflation give lower and stable inflation rate in the country as compared with the CPI inflation. Core inflation as measured by excluding the volatile groups (coreXVG) has the advantage of containing more weight as compared to the other two measures, hence can be considered as the most representative one. In addition, the mean value of the coreXVG is closest to that of general CPI inflation (point-to-point) and the standard deviation is lowest (0.6) among the three measures for the period of January
2007 to January 2008 (Table 3).11 Therefore, coreXVG can be considered as the most
[image:9.612.90.516.452.695.2]suitable one among the three measures of core inflation estimated in this note.
Table 3: CPI and core inflation (point-to-point, %)
Core Inflation
General CPI Excl. Food and Energy (coreXFE)
Excl. Volatile Items (coreXVI)
Excl. Volatile Groups (coreXVG)
Jan-07 5.9 4.1 3.8 7.1
Feb-07 7.3 4.9 4.8 7.7
Mar-07 7.4 5.2 5.4 7.5
Apr-07 8.3 6.3 7.2 8.5
May-07 8.1 6.8 7.6 8.5
Jun-07 9.2 7.6 8.0 9.1
Jul-07 10.1 7.6 8.6 9.0
Aug-07 10.1 7.3 8.6 8.8
Sep-07 9.6 6.6 8.1 8.0
Oct-07 10.1 7.1 8.6 8.1
Nov-07 11.2 6.9 8.8 8.0
Dec-07 11.6 - - 8.0
Jan-08 11.43 - - 8.0
Mean 9.2 6.4 7.2 8.2
STD 1.7 1.2 1.8 0.6
11
Apart from the short-run analysis, to use in policy purposes it is important to evaluate the performance of the core measure on the basis of its ability to track the trend inflation. Such tracking can cover two aspects. First, over a long horizon, the average rate of core inflation should match the CPI inflation, and second, core inflation should move closely with the trend inflation. For the purpose, trend inflation is usually defined in terms of 12 to 36 months moving average, or using the well-known Hodrick-Prescott filter. In the present study, we have defined trend inflation as 36 month moving average of inflation rates. Figure 5 reports the movement of CPI, core inflation as measured by exclusion of volatile groups (coreXVG), and 36-month moving average inflation rates for the period, June 2005 to January 2008. It can be seen that the core inflation can track the trend inflation better than CPI inflation. The mean, standard deviation, and RMSE for monthly (point-to-point) inflation are presented in Table 4. It shows that while the CPI inflation rate remains very close to the average (trend) inflation for the period, standard deviation and RMSE are significantly lower for core inflation than for the CPI inflation. This shows that the core inflation provides a better measure of inflation and constitutes a more consistent short term policy guide to understand inflationary pressure in the Bangladesh economy.
Figure 5: Movement of CPI, core, and trend inflation rates
0.0 2.0 4.0 6.0 8.0 10.0 12.0 Ju n -0 5 Ju l-0 5 Au g -0 5 Se p-05 Oc t-0 5 No v -0 5 De c-0 5 Ja n -0 6 Fe b-06 M ar-0 6 Ap r-0 6 Ma y -0 6 Ju n -0 6 Ju l-0 6 Au g -0 6 Se p-06 Oc t-0 6 No v -0 6 De c-0 6 Ja n -0 7 Fe b-07 M ar-0 7 Ap r-0 7 Ma y -0 7 Ju n -0 7 Ju l-0 7 Au g -0 7 Se p-07 Oc t-0 7 No v -0 7 De c-0 7 Ja n -0 8 In fl a tio n (p -t -p , % )
General CoreXVG 36 month moving average
Table 4: Mean and standard deviation of inflation rates
(June 2005 to January 2008)
Mean Std. dev. RMSE
CPI 7.9 1.6 1.6
5. Concluding Remarks
In recent years, both the economic literature and the practice of policy making assign an increasing role to core inflation, since core inflation indices filter out high frequency fluctuations from prices in order to improve the understanding of the medium term inflationary pressures on an economy. In this note, simple core inflation indices have been derived for the Bangladesh economy by eliminating the most volatile components (covering food and energy, all volatile consumption items, and all volatile groups) from the aggregate price index.
Over the years, the practice of computing core inflation has brought some changes in the behavior of central banks in different countries, while the concept has assumed a greater role in designing monetary policy and in ensuring policy accountability. Central banks in an increasing number of countries now routinely publish and monitor core inflation. In Bangladesh, there does not as yet exist any standard measure of core inflation. As such it is important for the Bangladesh Bank to come up with an official measure of core inflation that would help in formulating credible monetary policy and assist in forecasting inflation.
All three alternative measures of core inflation in this note provide a consistent picture that the underlying inflationary pressures are moderating in recent months. The core inflation as measured by excluding volatile groups is 8.0 percent in January 2008 as compared with 11.4 percent for CPI inflation on point-to-point basis. The performance criteria adopted in the study shows that the core inflation can better track the trend inflation. As such core inflation can serve as a better tool of predicting the trend inflation despite the loss of commodity weights in the process of its computation.
At present, Bangladesh Bank monitors twelve-month moving average of CPI inflation in defining the underlying trend that averages out the short-term or transitory components in the CPI. While the moving average or other smoothing measures no doubt tend to reduce the volatility and may better reflect the persistent elements, it has serious limitations as a policy tool. For instance, the average inflation series is dominated by past rather than current inflation, and this significantly reduces its relevance as a guide to design appropriate policy stance of the monetary authority. The point-to-point inflation, on the other hand, reflects the current price developments better, but it is highly sensitive to distortions by term fluctuations that put a limit to its accuracy as a guide to short-term policy. In contrast, the core inflation as measured in this note has a clear advantage of capturing both current dynamics and underlying trend of price developments.
Appendix 1:
Examples of Measuring Core Inflation using Exclusion Method
Country Measure of core inflation
Canada Excludes eight most volatile components from total CPI and adjusts
the remaining components for the effects of indirect taxes.
Chile Excludes 20 percent with higher negative variations and 8 percent
with higher positive variations.
Colombia Excludes agricultural food, public services, and transport.
Germany Excludes indirect taxes.
Japan Excludes fresh food.
Korea Excludes energy and non-grain agriculture.
Malaysia Excluding food and energy
Pakistan Excludes food and energy
Peru Excludes 9 volatile items (food, fruits and vegetables, and urban
transport, about 21.2 percent)
Philippines Excludes selected food and energy items from headline CPI.
Singapore Excludes costs of private road transport and costs of
accommodation.
Spain Excludes energy and unprocessed food.
Sri Lanka Excludes food and energy.
Thailand CPI excluding fresh food and energy (23 percent).
Appendix 2:
List of Some Volatile Items of Rural and Urban CPIs during Jan. 2006 to Nov. 2007
Rural Weight in
CPI
Urban Weight in
CPI
Rice boiled, med. quality,
Aman/Balam/Biroi/Pajam (1.6)
Rice-boiled Jinga/Katari
equiv. (1.5)
Wheat (Atta)
(1.9) Rice boiled med.
Balam/Beroi/Pajam (3.7)
Ruhu-medium size (1.0) Wheat (Atta) (2.1)
Hilsha-medium size (1.5) Musur dal (1.1)
Chingri (1.2) Hilsa (2.1)
Puti (1.7) Ruhu (1.2)
Potato-medium size (1.4) Puti (1.0)
Brinjal-local best (0.6) Chingri (1.0)
Chillies (0.7) Beef (2.2)
Salt (0.6) Hen (1.3)
Onion (0.7) Potato (0.6)
Mustard oil (1.5) Onion (0.8)
Turmeric (0.6) Turmeric (0.5)
Soyabean oil (0.8) Soyabean oil (1.8)
Milk (cow) (1.8) Milk (cow) (1.8)
Betel leaf (0.9) Powder Milk (0.4)
Betal nut (0.8) Sugar (0.5)
Hair oil-cocoanut oil b/q (0.6) Biscuits (0.5)
Washing soap-local best (0.6) Cigarette (1.2)
Cigarrette and Biri (1.4) Exercise khata (0.7)
Tailoring charge (0.2) Panjabi best quality (0.12)
Panjabi best quality (0.15) Saree Mills (0.7)
Chowki Mango wood (0.35) Leather chappal women (0.3)
Chair (0.12) House rent (3.7)
Mosquito net (0.35) Katcha House (1.4)
Aliminium dekchi (0.08) Motor sprit Petrol (0.35)
Glass local (0.03) Toilet soap (0.3)
Enamel plate (0.1) Leather sandle men's (0.3)
Bi-cycle (0.41) Bed sheet (0.3)
Wooden pencil (0.23)
References
Aoki, K. (2001), ‘Optimal Monetary policy Responses to Relative Price Changes’, Journal of
Monetary Economics, 48, 55-80.
Bagliano, F. C. and C. Morana (2003), "Measuring US Core Inflation: A Common Trends Approach",
Journal of Macroeconomics 25, 197-212.
Berkmen, P. (2002), "Measuring Core Inflation for Turkey-Trimmed Means Approach", Central Bank
Review 2, The Central Bank of the Republic of Turkey, pp. 1-18.
Bryan, M. F., and S. G Cecchetti (1993), "Measuring Core Inflation", NBER Working Paper No. 4303, Cambridge.
Clark, T. E. (2001), “Comparing Measures of Core Inflation”, Federal Reserve Bank of Kansas City
Economic Review. Second Quarter, 2001.
Cristadoro, R., M. Forni, L. Reichlin, and G. Veronese (2005), ‘A Core Inflation Index for the
Euro-Area’, Journal of Monetary, Credit and Banking, 37, 539-560.
Gartner, C. and D. Wehinger (1998), “Core Inflation in Selected European Union Countries”, Oesterreichische National Bank.
Lenza, M. (2007), Monetary Policy and Core Inflation, Working Paper Series No. 837, European
Central Bank.
Macklem, T. (2001), "A New Measure of Core Inflation", Bank of Canada Review, Autumn 2001.
Quah, D and S Vahey (1995), “Measuring Core Inflation”, Economic Journal, vol. 105, pp. 1130-44.
Roger, S. (1998), “Core Inflation: Concepts, Uses and Measurement”, Reserve Bank of New Zealand Discussion Paper G98/9. July1998.
Samanta, G P (1999), “Core Inflation in India: Measurement and Policy Perspectives”, Reserve Bank of India Occasional Papers, 20(1).
Shahiduzzaman Md. (2006), “A Measure of Core Inflation in Bangladesh”, Working Paper Series: WP 0701, Policy Analysis Unit, Bangladesh Bank, Dhaka.