Rochester Institute of Technology
RIT Scholar Works
Theses
Thesis/Dissertation Collections
6-1-1997
Methods of digital classification accuracy
assessment
Jeffrey R. Allen
Follow this and additional works at:
http://scholarworks.rit.edu/theses
This Thesis is brought to you for free and open access by the Thesis/Dissertation Collections at RIT Scholar Works. It has been accepted for inclusion in Theses by an authorized administrator of RIT Scholar Works. For more information, please contactritscholarworks@rit.edu.
Recommended Citation
Methods
ofDigital Classification
Accuracy
Assessment
M.S. Thesis
by
Jeffrey
R. AllenB.S. Rochester Instituteof
Technology
(1996)
Rochester Institute of
Technology
Center for
Imaging
ScienceDigital
Imaging
andRemoteSensing Laboratory
Acknowledgments
Iwouldliketoacknowledgethe
following
peoplefortheircontributions.. .First,
theeffortsofallthreemembersofmythesiscommittee. Yourtimeand patiencearegreatly appreciated. IamparticularlythankfultoDr. Navalgund Rao for
kindling
myinterestindigitalimageprocessing,Mr. Rolando Raquefio foralways
taking
timefromhishecticscheduletodealwithmy insignificantproblems, andDr. John R. Schott for
exposingmeto thefieldof remotesensing, providingme withtheopportunitytoconduct this research, and
helping
shapemyfuture.Iam gratefulto theNational Reconnaissance Office
(NRO)
forprovidingfunding,
without whichthis thesis would nothave beenpossible.
Wordscannotbegintoexpressmyappreciationtowardsmymother,Lorna. Her
influence has beenpermanent,hersupport without
bounds,
andher loveunconditionaland absolute.
Allofmy
family
fortheirloveand supportincluding
mysistersKimandMaryann,
brothers Timand
Scott,
andthenewest membertojoinourranks, myadorable nieceRachel Allen. Inaddition,IwouldliketocongratulateScottandhis fiancee Rebeccaon
theirpendingnuptials.
My
girlfriend ofnearly sixyears,TracieBonacci,
for her loveandunderstandingthrough years ofschoolingandbeyond.Alloftheprofessors I have hadpleasure of
knowing
fromtheCenter forImaging
ScienceandtheCollegeofScienceatRTT. Youreffortsare appreciated.
My
friends fromtheDIRSlab,
theCenter,
andTrianglefraternity
forhelping
maintain my sanity (I dunk).Mr. Stephen L.
Schultz,
unixwizard, for his programmingassistance andMr. Scott D.Brown,
DIRSIGguru, for generatingtherequiredsyntheticimages.Allthesupport staff atthe
Center,
especially,Mrs. Sue Chan for heracademic planning.Dr. Paul Wilson forhis contributionstowardthe contentofthis thesisalongwithhis
recommendations and usefulcomments.
Lastly,
alltheunmentionedfriends,
colleagues,andstudypartnersI havecollectedoverthelast 6years atRIT.
Dedication
Thisthesisis dedicatedtomy
Father,
Edward Oliver Allen Jr. Itisdifficulttobe briefwhenIspeakofhim. Hiskindnature,endlesspatience,andlimitless curiosity hasshaped
mypersonalityandidentity. Iam wellserved
by
attemptingtoemulatehim in every respect.My
father'stechnicalknowledgeand mechanical expertise is inspirationaltoall whohaveknown himandhasmadehim mygreatestmentor. Iconsider myselfveryAPPROVAL OF M.S. THESIS
Methods of Digital Classification Accuracy Assessment
by
Jeffrey
R.
Allen
B.S. Rochester Institute of Technology
(1996)
A thesis submitted in partial fulfillment of the
requirements for the degree of Master of Science
in Imaging Science from the Center for Imaging
Science, Rochester Institute of Technology.
June 1997
Signature of Author:
~~Jeffrey
R.
Allen
Dr. Harvey Rhody, Coordinator, M.S. D
Center for Imaging Science
Rochester Institute of Technology
Rochester, New York
Certificate of Approval
Master of Science Degree Thesis
The Master of Science degree thesis of Jeffrey R. Allen
has been examined and approved by the thesis committee
as satisfactory for the thesis requirement for the Master
of Science Degree.
Dr. John R. Schott, Primary Thesis Advisor
.
Dr. Navalgund Rao, Committee Member
Rolando Raquefio, Committee Member
Center for Imaging Science
Rochester Institute of Technology
Rochester, New York
Thesis Release Permission Form
Thesis Title:
Methods of Digital Classification Accuracy Assessment
I, Jeffrey R. Allen, grant permission to the Wallace Memorial
Library of the Rochester Institute of Technology to reproduce
this thesis in whole or in part provided any reproduction will
not be of commercial use or for profit.
Jeffrey R. Allen
1.
Abstract
Landcover classification ofremotely sensed data has found many useful applications in
industries such as
forestry,
agriculture, and defense. With the push toward end users,class maps are often incorporated
directly
into geographical information systems for usein solving
large,
complex problems.However,
errors are inherent in the classificationprocess. Theimportanceofassessingthethematic accuracyof dataderived fromremote
sensing platforms is universally recognized and has motivated much research. Classification accuracy assessmentis often required to determine the "fitness of
use" or
suitabilityof a data set for a particular application. Failure to
identify
the magnitude of inaccuracies in classified datacan result inerrors cascading into subsequent exploitationandeventually resultin false conclusions or flawed products.
Many
different techniqueshave been developed and utilized
by
the remote sensing community for performingthematic accuracy assessment. To
date,
no one procedure has been adopted as anindustry-widestandard.
Thepurpose ofthisresearch was to evaluatetheeffectiveness and compare theresults of
several state-of-the-art assessment techniques.
Synthetically
generatedimagery,
alongwith real multispectral line scanner
data,
served as the baseline for the comparison.Synthetic
imagery
is uniquelysuitedforthis taskbecausetheexactclassificationaccuracyTable
ofContents
1. Abstract vii
2. Introduction 13
2.1
Collecting
Reference Data 142.2
Accuracy
Representation 162.3 Factors
Degrading
Classifier Performance 172.4
Correcting
for Reference Bias 182.5 Relative Classifier Performance 18
3. Objectives 19
3.1 Analysisof
Accuracy
Assessment 193.2 Application of
Accuracy
Assessment 194. Work Statement / Deliverables 21
5. Background 23
5.1
Utility
ofClassification 235.2 Motivations for
Accuracy
Assessment 245.3 Classification Algorithms 25
5.3.1 Gaussian Maximum Likelihood 27
5.3.2
Fuzzy
ARTMAP 315.3.3 Rule Based Genetic Algorithm 35
5.4 Image Data Sets 37
5.4.1 Tank Scene 38
5.4.2 Desert Scene 39
5.4.3 Forest Scene 41
6. Approach 43
6.1 Experimental Data Set Matrix 44
6.2
Importing Training
Data 456.3 UseofSynthetic ImageData 47
6.4 Simulationof
Stressing
Parameters 496.4.1 Modulation Transfer Function 49
6.4.2 Atmospheric Effects 49
7.
Theory
527.1 Factors
Effecting
ClassificationAccuracy
527.2
Assessing
ClassificationAccuracy
537.3 Confusion Matrices 55
7.3.1 User Selected Reference Data 58
7.3.1.1 Dependent Data Sets 58
7.3.1.2 Independent Data Sets 59
7.3.2 Random Point
Sampling
607.3.2.1 Simple Random
Sampling
617.3.2.2 Stratified Random
Sampling
617.3.2.4 Systematic Random
Sampling
637.3.3 Synthetic
Imagery
Verification 647.4
Accuracy
Metrics 667.4.1
Uncertainty
ofEstimates andConfidence Intervals 677.4.2 Image Wide
Accuracy
Metrics 687.4.2.1 Simple
Accuracy
687.4.2.2 Weighted
Accuracy
707.4.2.3 Kappa Coefficient 73
7.4.2.4 BrennanandPrediger's Kappa 75
7.4.2.5 Tau Coefficient 77
7.4.3 Single Class Metrics 79
7.4.3.1 Producer's
Accuracy
Metric 807.4.3.2 User's
Accuracy
Metric 818. Discussion 83
8.1 Optimistic Bias 83
8.2 Conservative Bias 83
8.3 Confusion Matrix Marginal Distribution
Scaling
858.3.1 ExampleofConfusion Matrix
Scaling
888.3.2 Kolmogorov-Smirnov
Testing
ofPost Priori Probabilities 919. Results 97
9.1 EffectofReference Data Source 101
9.2
Accuracy
MetricResults 1099.2.1 Simple
Accuracy
1129.2.2 Weighted
Accuracy
1129.2.3 Kappa Coefficient 113
9.2.4 BrennanandPrediger's Kappa 115
9.2.5 Tau Coefficient 116
9.3 Effectof
Stressing
Parameters 1169.3.1 Resolution 116
9.3.2 Atmosphere 120
9.4 ResultsofConfusion Matrix
Scaling
1239.4.1
Scaling
ofForest Scene Confusion Matrices 1239.4.2
Scaling
ofTank Scene Confusion Matrices 1299.4.3
Scaling
ofDesert Scene Confusion Matrices 1329.5MysticClassifier Performance
135
9.5.1 Classification Results 135
9.5.2 Suggestions for Improvement 138
10.
Summary
& Conclusion 14111. Recommendations for Future Work 145
12. References 146
List
ofFigures
Figure 5-1 GML Classificationof aTwo Band Image 29
Figure 5-2
Fuzzy
ARTMAP Architecture 32Figure 5-3 Weight Vector Operation 33
Figure 5-4 Inter-ARTField Operation 34
Figure 5-5 Southern Rainbow Tank Scene 39
Figure 5-6 Western Rainbow Desert Scene 40
Figure 5-7 BandpassesofDaedalus Sensor 40
Figure 5-8 SyntheticForest Scene 41
Figure 6-1 Experimental Matrices 45
Figure 7-1
Contingency
Diagram 54Figure 7-2 Sample ConfusionMatrix 56
Figure 7-3 ProbabilisticConfusion Matrix 57
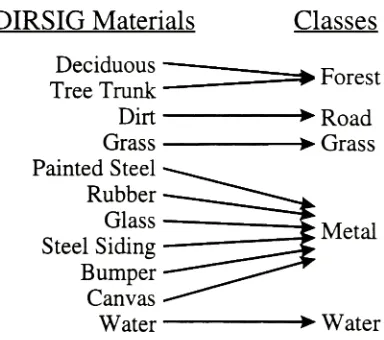
Figure 7-4 ClassificationandVerificationofSynthetic Scene 65 Figure 7-5
Mapping
ofDIRSIG MaterialstoClassMap
Categories 65Figure 7-6 Standard Normal
Density
67Figure 8-1 Confusion Matrix Marginal
Scaling
86Figure 8-2 Sample Class
Map
88Figure 8-3 Confusion Matrix forSample Class
Map
89Figure 8-4
Scaling
Sample Confusion Matrix 90Figure 8-5 Scaled ConfusionMatrix for Sample Class
Map
91Figure 8-6 Forest Class
Probability
Distributions 94Figure 8-7 Forest Class Cumulative
Probability
Distributions 94 Figure 9-1 Class Mapsfrom Forest 23kmVisibility
Scene Classification 97 Figure 9-2 SyntheticReferenceMap
andOriginal Forest Image 98 Figure 9-3 Class Maps from Tank 23kmVisibility
SceneClassification 98 Figure 9-4 Class Maps from Desert lm GIFOV Scene Classification 100Figure 9-5 Class Maps from Desert 2m& 4m GIFOV Scene GML Classification 101
Figure 9-6 Random
Sampling
of278 Points 102Figure 9-7 Multisource AssessmentofDesert Scene GML Class
Map
106Figure9-8 ErrorofRandom Forest Assessment 107
Figure9-9 Classifier PerformanceonForest 23km lm Image 109 Figure9-10 GML Classification
Accuracy
for Desert Scene 1 17 Figure9-11 ARTMAPClassificationAccuracy
for Desert Scene 1 18 Figure9-12 MysticClassificationAccuracy
for Desert Scene 1 19Figure9-13 EffectofTankSceneAtmospheric
Visibility
onClassifier Performance...121 Figure9-14 EffectofForest Scene AtmosphericVisibility
onClassifier Performance. 122 Figure9-15 Spatial Correlation ofClassifier ErrorFigure 9-16 Spatial CorrelationofClassifier Errorat5km
Visibility
123List
ofTables
Table 5-1 Southern Rainbow Bandpasses 38
Table5-2WesternRainbow Bandpasses 40
Table 5-3 DIRSIG Scene Bandpasses 42
Table 7-1 Confidence Interval Z-Scores 68
Table 8-1 DistributionofClass
Map
89Table 8-2 DistributionofReference 90
Table 8-3 Quantiles oftheSmirnov Two Sample Test Statisticof size n 93 Table 8-4 CalculationofSmirnov Test Statistic for Forest 23k GML Class
Map
95Table 8-5 Results ofKolmogorov-Smirnov Two-Sample Test 95
Table 9-1 EffectofForest Reference SourceonMeasuredPercent Correct 103 Table 9-2 EffectofTank Reference Source onKappa Coefficient 104 Table 9-3 EffectofDesert Reference SourceonTau Coefficient 105
Table 9-4 VerificationofDependent Reference Data 107
Table 9-5 VerificationofIndependent Reference Data 108
Table 9-6 Chance Agreement Coefficients Ill
Table 9-7
Probability
DistributionsofReference Data 124Table 9-8
Probability
DistributionsofForest Scene Class Maps 124 Table 9-9 RMS ErrorofMarginal Distribution Approximation for Forest Scene 125Table 9-10
Scaling
Coefficientsfor Forest Scene 127Table 9-11 Percent
Accuracy
Results ofMatrixScaling
Forest Scene 128 Table 9-12 Absolute Error ResultofMatrixSeating
Forest Scene 128Table 9-13 HistogramsofTank Scene Class Maps 130
Table 9-14 RMS ErrorofMarginal Distribution Approximation for Tank Scene 130 Table 9-15
Scaling
Coefficientsfor Tank Scene IndependentReference 131 Table 9-16 Kappa CoefficientAccuracy
ResultsofMatrixScaling
Tank Scene 131 Table 9-17 RMS ErrorofMarginal Distribution Approximation for Desert Scene 133Table9-18
Scaling
Coefficients for Desert Scene 1332.
Introduction
Digital imageclassificationisone ofthemostcommon operations performed on
remotely senseddata. Classificationreferstoaprocess where each pixelinanimage is assignedtoa certaincategory,knownas a class. In thecontextof remote sensing,these
classesusuallycorrespondtotypesof ground cover. Theresultof classificationis known
asaclass map.Theterm'map' shouldnotbeconfused withthecartographic meaning. A classmap is digitalrasterdatawheredigitalcounts
(DC)
correspondtoclass membershipand spatiallocationcorresponds to thesamelocationasintheoriginal image. Recent interest intheintegration of remotesensing data intogeographicalinformationsystems
(GIS)
has rekindledresearch andheightened interest inclassificationaccuracyassessment(JanssenandVan der
Wei,
1994). Thepushtowardsreal world applications andtheenduserhas further increased theneedforreliable methodsofaccuracy assessment. Errors
areintroduced intoclassification when a pixelismisclassified
by
assigning itto thewrongclass. Thetermpixel (pictureelement)isusedtoreferto the smallest element of
theoriginal and classifiedimages. Theoriginal and classifiedimagesconsistof atwo
dimensional arrayof pixelsbuttheoriginal image usually hasanadditional dimensionof spectraldataas well.
Ideally,
accuracyassessment wouldconsistofcomparingtheclass ofall pixels inaclassifiedimageto their trueclass. Inpractice, accuracyassessmentconsists ofcomparinga smallsamplingof classified pixelsto a set ofdata believedtobe
their trueclass. Overtheyears,manymethodsfor accuracyassessmenthave been presentedinremotesensing literature butno dominantstandardhasyetbeenadopted.
Inthisthesis,thecurrentstate-of-the-art.accuracyassessmenttechniquesare
presented andafewuniqueadaptations areproposed,aswell. These assessment
techniques arethenimplementedon aseries ofbaseline images. Threescenesareused
imageswere acquiredusingairbornemultispectrallinescannerswhilethelast imagewas
syntheticallygenerated. Detailsabouttheseimage setscanbefound in 5.4. Classifier performanceisaffected
by
manyreal worldimaging
parameters. Twosuch parametersareimageresolutionand atmosphericvisibility. Thethreescenesweredegraded using
thesetwoparameterstocreate nineimages. Thesenineimageswere useful
because,
after classification,they
provided a complete range ofclassification accuracywhich wasneededto
thoroughly
comparethevariousassessmenttechniques. Inaddition,they
were also usedtoquantitativelymeasuretheeffect ofthe stressingparametersonclassification accuracy. Three differenceclassifiers were usedtoproducetherequisite class maps: the Gaussian Maximum Likelihood(GML)
usingparametric multivariatestatistics, theFuzzy
ARTMAPneural networkutilizingafuzzy
logicset,andMystic a new classifierusing mathematicalrules,optimizedby
a genetic algorithm,tosegment classes. Thesethree classifiers-,described in5.3,
wereselectivelyused onthenineimagestogeneratetwenty
threeclass maps. Alloftheseclass mapsthenunderwentaccuracy assessmentbasedon a
varietyof referencedatasources. Theresult was onehundredandnineteenconfusion
matrices and severalcorresponding accuracymetrics foreach. Forthe exact combination
of
image,
classifier, and referencedatathereaderisreferredto theexperimentalmatrices in 6. 1. Theresearchofthe thesisis divided into fivemajorthrusts:obtaining reference
data,
accuracymetrics, parametersstressingclassifierperformance,correctionfor biased referencedata,
andtherelative performance oftherulebasedclassifier. Eachofthese topicsis discussed ingreaterdetail below.2.1
Collecting
Reference
Data
Theprocess of classificationaccuracy assessment canbegroupedinto twodistinct
steps. Inthefirststep,theclassmapis spotchecked against referencedata. Thesecond step involves calculatingameaningful metricfromthe datacollectedinthefirststep.
next. Classification accuracyassessmentispresented,in
detail,
in 7.2. Referencedataisagroupof pixels which
belong
toknownclassesthatare usedtoestimatetheaccuracyoftheentire map. Severalmethods ofobtainingreferencedataispresentedin 7.3. Whenassessingclassifierperformance,referencedata iscompared againsttheclass map tobuild aconfusionmatrix. Aconfusion matrixis acontingency table,oftenusedin
categoricaldataanalysis,usuallywith reference dataalongthecolumns andclassmap data alongtherows. Ineachelement, alongtherow and column oftheconfusionmatrix,
thecorrespondingnumber of pixelsthatfall into bothcategoriesisposted.
Any
discrepancy
betweenreferencedataand classifieddataisconsidered a classification error. Thedifficulty
lies in obtainingreferencedata,
sometimesknownasverified,identified,
known,
ortruthdata,
whichisrepresentative oftheentire scene.Determining
theexactaccuracyof aclassmap is impossible inalmost allcircumstances. Forcertain,it is impractical inall cases
involving
realimagery. There are,however,
severalwidelyaccepted methodsforformulating
areasonablyclose approximationtothe true accuracy. Aproper estimate will alsoincludethecorresponding confidenceinterval. When selectinga methodforaccuracyassessment, thereis atradeoffbetweencost and accuracy. Thecost ofaccuracyassessmentincludes
many factors such as
labor,
physicalresources, time, travel, andothers. Thelargestcost ofassessmentis incurred obtainingthereferencedata. Lessrobustmethods resultinless accurateapproximations ofaccuracywithlargeconfidenceintervalsbut at alowercost. High qualityassessmentprocedures are moreaccurate,butalsomore expensive andtimeconsuming. Eachproject mustfindthebalancepointbetweencost and acceptablefidelity.
Many
accuracyassessmenttechniquesintroducebias intotheirestimations. Bias isthesystematic errorresulting fromconsistentover orunder estimation ofthetrueclassmap accuracy. Optimistic andconservativebiaswillbediscussed in 8.1 and 8.2
Forthisthesis,real andsynthetic
imagery
willbeemployedforcomparingdifferent samplingtechniques. Inthecontext of classificationaccuracyassessment,
sampling referstoselectingcertainpixels,or groups ofpixels,and
determining
whichclass
they truly
belong
in. Syntheticimagery
isof particularinterest because sampling isnotnecessarysincetheexact classmembershipof each pixelisknown. Thisa priori
knowledgewill permit anunbiased,quantitative evaluation ofthepopularsampling
techniques. Theuse of synthetic
imagery
inthisresearchisexplainedin 6.3.Overtheyears,severalsamplingtechniqueshave beenemployed
by
theremotesensing community forthispurpose.
However,
eachsamplingtechniquehascorrespondingadvantages anddisadvantages. In9.1 theresults ofthe analysis ofthe
effect of reference datasourceonthereportedaccuracymetric willbe detailed.
2.2
Accuracy
Representation
Oncereference data isusedtocreate a confusion matrix,it isoftendesirableto
reducethe matrixintoasingle, meaningfulindexof accuracy. This singlemetric,usually expressedas a coefficientbetweenzero andone,estimates the trueaveragemap accuracy
or classifier performance.
Many
different accuracy metricshave beenintroducedto compensateforthefactthat theestimateisbeing
made onlessthancompleteinformation. Othermetrics,ideal for measuringclassifierperformanceratherthanclass
mapaccuracy,correctfortheproportionof pixelsproperlyclassifiedonly
by
chance. It is importanttokeep
inmindthemethod usedtogenerate theconfusionmatrix whenselectingthismetric. Themost often quotedmetrics aretheSimpleaccuracy,Weighted accuracy, Kappacoefficient,BrennanandPrediger's
Kappa,
andtheTaucoefficientwhichwillbeintroduced in 7.4. This lackof a standardhascreated
difficulties
in comparing differentclass maps. Aconversionfromone metrictoanother cannotbemadebecause
they
alsodependonthemarginaldistributionofthe confusionmatrixinnotingtheadvantages and disadvantagesof each. Theappropriate confidence
interval,
accounting for uncertaintyfromall sources,willbereportedalong withthismetric. This willbe accomplishedwithhighly
characterized realimagery
andcomputer generatedsyntheticimages.
Themetrics willbeevaluated onclassmaps generated withtheGMLclassifier,
the
Fuzzy
ARTMAPclassifier,andMystic,
a rulebasedclassifier. Supervisedclassification algorithms and uncorrectedimageswillbeemployedinthis study because
they
are mostcommonlyusedby
theremote sensingcommunity. Methods for accuracyassessmentandaccuracymetrics arenormally consideredcompletely independentofthe
classificationtechniqueutilized.
However,
because classifiersmayexhibitdifferentdegreesof spatial correlation oferrors, threedifferentclassifiers willbeusedtoensure
universalapplicabilityoftheresults. The baselineimageswill also contain avariety of
landcoverstoavoidcorrelationinthefinalresults. In
9.2,
theresults oftheanalysisandcomparisonsbetweentheaccuracymetrics are covered.
2.3
Factors
Degrading
Classifier
Performance
In additiontoimagecontent andthequalityof
training
data,
theaccuracyofimageclassificationisafunctionof several real world
imaging
parameters. A discussionofseveralfactors effectingclassificationaccuracy iscontainedin 7.1.
However,
onlytwosignificantfactorswere examined as part ofthisresearch. The
first,
imageresolution,was examinedusingthedesertscene. Thesecond
factor,
atmospheric visibility,was analyzedusing theforestandthe tankscenes.Bothstressingparameterswere simulatedusingtheprocedureoutlinedin 6.4. Todeterminetheextentoftheeffect on
2.4
Correcting
for Reference Bias
Quality
referencedatatobeusedforclassificationaccuracyassessmentisoftendifficult,
time consuming, andcostlytoobtain. Oftenanalysts utilized user selectedreference as aquick,low-costalternativetorigorousrandom verification.
However,
userselectedreferencedataalmost always suffers from overlyoptimisticbias. Userselected
reference alsohasanother problem. Ingeneral, itsmarginaldistribution intheresulting
confusion matrixdoesnotaccuratelyapproximatethe trueclassprobability distribution.
In
8.3,
a methodis proposedtocorrectforthisshortcoming. Thisprocessisclassedconfusion matrix marginaldistribution scaling
by
post priori probabilities. Itisusedinthisthesistoadjusttheconfusion matrices of allthreescenes constructedusing
independentreferencedata. Theaccuraciesresulting fromscaled matrices are then
comparedtotheunsealed andtrue accuracies. Theseresults are presentedin 9.4.
2.5
Relative Classifier Performance
Thelastarea of researchistheperformanceoftheMysticclassifier relativeto
theothertwo, moretraditional, classifiers. Mysticis anew,rulebasedclassifier. It
uses a genetic algorithmtooptimizetheparameters ofthe rulestoobtainthehighest
classificationaccuracypossible. TheMysticclassifier, alongwiththe
GML,
andFuzzy
ARTMAP aredeveloped in 5.3. Tothispointin time,the accuracy andproperties oftheMystic
classifier are relativelyuntested. It howeverappearstobea uniqueclassifier
withpromisingpotential. Whilea majorthrustofthis thesisis not a comparisonbetween
3.
Objectives
Theobjective ofthisthesisisseveralfold.
First,
thecurrenttechniques ofclassificationaccuracyassessment,alsoknownas classification validation,willbe presented. One objective willbeto
develop
acommonformalismandtaxonomy
ofaccuracyassessment.
Many
independentresearchershavepresented results onclassificationaccuracy assessment. Several contrastingapproacheshave beengiven, as
well.
Many
ofthesepapershaveuseddifferentterminology
evenwhenreferringto the samephenomenology becausenostandards yet exist.Ideally,
this thesiswillserve as a compendium of classification validationby
providing a common source of research results drawn fromyears of remotesensing literature.3.1
Analysis
of
Accuracy
Assessment
Inthisproject severaldifference samplingschemes willbeemployed. The
accuracyoftheseschemes willbe determined usingsynthetic referenceor more rigorous sampling. Corrections forreference datawhichpoorlyestimatesthe trueclassprobability distributionswill alsobemade.
Accuracy
metrics willbeevaluated and comparedinasimilar method. In addition,itwillbe determinedifeach metricis accurately estimating thequantity it issupposedtobemeasuring.
3.2 Application
of
Accuracy
Assessment
Aspart ofthisproject, adatabasewith asignificantnumber of confusion matrices
has beengenerated. Inthis thesis,thepurposeofthesematriceswastoanalyze accuracy
metrics,reference datasources, classifierperformance, andtheeffectofstressing
When analyzingtheeffectof a parameter on classificationaccuracy, itisoften
difficulttoseparatetheeffect ofthedesiredparametersfromtheeffect oftheassessment
procedure. Thequantitativeassessment ofstressingparameterswill
inevitably
includebias introduced
by
themethod of assessment. Differentassessment methods will resultindiffering
values. Thisis because it is difficulttoobtain an accurate or precise accuracyassessment. Forthis reason, theevaluationofstressingparametersand classifier
4.
Work
Statement
/ Deliverables
Statement
ofWorkDesignateand optimize acommon
training
settobeusedby
all classifiers.Classify
candidateimagery
withGML,
Fuzzy
ARTMAP,
and rulebasedgenetic algorithm(Mystic)
classifiersusingcommontraining
data.Obtainreferencedatafrom
dependent, independent,
random,andsynthetic sources.Generate confusionmatricesfromreferencedata and evaluateclassificationaccuracy
using
Simple, Weighted,
Kappa,
B&P'sKappa,
and singleclass accuracycoefficients.Generate andanalyze confusionmatricesmadefromuser selected reference which
have beenscaledtomatch post prioridistributions.
Utilizersynthetic
imagery
toidentify
most precise andefficient methodofclassificationaccuracyassessment.
Analyzeeffectofstressingparameters on classification accuracy and relative effectiveness ofMysticclassifier.
List ofDeliverables
Programfor convertingENVFM
training
datatoMysticandAVSformat.
A Mathematica
library
for generatingconfusion matricesfromdependent,
independent,
random point and syntheticdatasources.A Mathematica
library
for evaluatingSimple,
Weighted, Kappa,
B&P'sKappa,
and single classaccuracycoefficients with confidenceintervals.Awrittendatabase containingconfusion matricesforallclassifiedimages basedon userselected, random,and synthetic reference.
Awrittendocument containingsuggestionsfor minimizing bias and
increasing
precision of classification accuracyassessment.5.
Background
5.1
Utility
of
Classification
Asmentionedpreviously,digital imageclassificationis one ofthemostimportant
processeswhenpreparing remotelysenseddata foruseinapplications or research.
Differentusers sometimesreferto imageclassificationas classsegmentation,
categorization, orlandcover determination. A varietyof users havefoundclassification
of satellite and aerialimages a cost effective solutionto challenging largescale problems.
However,
thesynoptic view,highavailability,andfrequentoverflightshasmade satelliteimagery
the preferred,low-cost datasource ofmanyusers. Classifiedimagesareknownby
several namesincluding
classmaps, thematicmaps,productmaps, land-use maps, andlandcovermaps. Classificationcanbeusedtodeterminethelandcover,constituent
materialtype,orobject class of each pixelinanimageacquiredat greatdistances.
Theenvironmentalcommunity hasmadewide use of classification as atoolwhen
studying large areas ofisolatedenvironments. Datais often collected overtime to monitor environmental change such asdeforestationand changes in wetlands.
Classification has proventobeaninvaluableaidinthemappingof wildlands andin
drafting
inventoriesofisolated locations(Fitzpatrick-Lins,
1980;
Senseman etal,1995;
Rutchey
andVilcheck,
1994).National governmentshave beenthelargestuser of classification on remote
sensing data. It is often usedfor surveyingandmonitoring vast natural resources(Bauer
etal, 1994). Forexample,classificationhas helpedoptimize water usagein
developing
countries (NageswaraRao and
Mohankumar,
1994). Governmentshavealsobeensuccessfulin predicting crop failureandavoiding famine in
developing
nationsby
Thecommercial sectorhas alsofound manyuseful applications. Segmented
imagesoftenaidinoilexploration,identification of mineraldepositsinremote
locations,
populatingGISdatabases and cartography. Classmapsof cropshave beenusedin many waystooptimize agriculture.
Crop
yields canbemaximizedby determining
where andwhenit is bestto plant,
fertilize, irrigate,
orharvest. It has beenusedby
thelogging
industry
toidentify
and manageforestresources. Evenlarge brokerage houses haveutilized classificationofremotelysensedimages for predicting commodityandfuture
prices
by
monitoring crop healthandmeasuring biomass.Many
oftheseapplications baseimportant decisionson evidence uncoveredby
imageclassification. Thisunderscorestheneedfor high qualityclass maps wheretheaccuracyand confidence intervals areknown.
Classification is sometimes used as a preprocessortofurther digital image
processing. Forexample,class maps canbeusedforatmospheric calibration or
emissivity determination inthermal studies. Fortheseapplicationsespecially,class maps mustbeofhigh accuracy toensure excessive errorisnot propagatedto further processing steps. Classificationis commonlyusedin imageexploitation as an analyst'stool. It
reducesthe
dimensionality
ofdatawithlittleor nolossofcriticalinformationwhichinturn aidsin humanassimilation
(Harsanyi,
1994).5.2
Motivations for
Accuracy
Assessment
Thereare severaltypes of errorintroduced intoremotesensing data. Otherthan
radiometric, therearetwomajortypesof errorthatare of concern. The
first,
positionalerror,referstotheimproperrelativelocationof a pixelin a scene whencomparedto the originalscene geometry. Positional accuracyisoftenmeasuredinrootmean square
(RMS)
units and correctedfor usingone ofthemethodsofimageregistrationorthis thesisisthematic accuracyof classifiedimagesbutpositionalaccuracy affectsthe
measurementofthematic accuracy. Positionalerror whencollectingreferencedata from
a second registeredimagewill resultinunderestimatedthematicaccuracy. Inaddition, classmappixelswith positional error willnolongercorrespondtoproper relative locationontheground. Inthisthesis,accuracy,unless notedotherwise,willbe referring to the thematicaccuracyof a class map.
Accuratedataiscriticalto all oftheapplications mentioned above. Classified imagesare of no use if
they
containexcessiveamounts oferror,therefore, thevalidation of classifieddataisparamount. Theamount oftolerableerrorisspecifictoeachapplicationbuttheneed for accuracyassessmentisconsistent. Thethematic accuracy is oftenthe
deciding
factorindetermining
whethera classmap is appropriatefora study.Precise accuracy assessmentis neededtodeterminetheeffectiveness ofdifferent classifiers.
Continuing
researchintonew, more robust classifiers requires effectivemethods for measuringtheirperformance. Vigorous accuracyassessmentscan alsopoint outflaws in existingclassifiers andleadtoimprovements. Assessment has alsobeen usedto facilitatestudiestodetermine how
imaging
parameterssuchasviewangle, time ofday,
spatial resolutions and eventhesensor used affectthe finalclassificationaccuracy.5.3 Classification
Algorithms
Therearetwo distincttechniquesofimageclassification. The firsttypeis
unsupervised classifiers such ask-means (Dudaand
Hart,
1973)
andISODATA (Tou andGonzalez,
1974)
algorithms. Theseroutines arehighly
automatedand requireonly one input fromthe user, thenumber ofdesiredclass categories. Thecategories segmentedby
thesemethodsmayormaynot correspondto classes whichmaybedesirablefortheuser.However,
unsupervisedclassifiersare often usedasaquickfirstruntodeterminehow separabledesiredclasses mightbe.They
are also oftenusedtoprovide puretraining
datathe supervised algorithms. Supervisedclassification routines require prototype
training
data fromtheuser.Training
dataare samplepixels, alongwiththematiclabels,
whichbelong
totheclasses whichtheuser wishestosegment. Once
they
have beenselected, theentire spectral vector of each pixelisusedby
theclassifier. The gatheringoftraining
dataisa subjective,man-in-the-loopprocess,whichhasalargebearing
ontheultimateclassification accuracy. Supervisedclassification
training
datais usually identifiedby
an imageanalystusing one oftwo techniques. Withthefirstand most common methodtheanalyst
interactively
selects solid polygons over areas of animagewhich arebelievedto containonlythedesiredclass. Thesecondtechniquerequirestheimageanalysttoonlyselect a single pointinthecenter of ahomogeneousarea oftheimage representingthe
desired imageclass. This single pointisthenused as a seedforan unsupervised
classifies
suchasthefuzzy
k-means clustering algorithm,which extrapolatestoselect spectrallyandspatiallynearimage datatobeusedastraining
data. Both supervisedtraining
methods requiretheanalystto determinethenumberofdesiredclasses, and select atleastone region per category.Aftertheclassifieristrainedordevelopedwiththe
training data,
thesupervisedclassifier proceedsto assignthematiclabelstothepixelsintheimage. Mostclassifiers allow pixelstoremain undefined whichdonotfitwellinto anyoftheestablished categories. Inthiscase,theuser must supplyamembershipcoefficientthreshold that
mustbeexceededfor any given pixeltobeclassified. Undefinedpixels will notincrease ordecreasemeasuredaccuracy because
they
are notincluded inconfusiontables. Three supervised classifiers willbeusedinthisproject.They
also are all 'per-pixel' classifiers. Thismeansthey
assign pixelsindividually
toclassesbased onlyonthespectral signature fromthatpixel,withno regardtothesurroundingpixels. Otherclassification routines5.3.1
Gaussian Maximum Likelihood
The Gaussian Maximum Likelihood
(GML)
classifieristhemost popular of all classifiers. The GMLisa supervisedclassificationalgorithm which employsBayesianprobability
theory
toselecttheclasstowhich apixel mostlikely
belongs. Thisis accomplishedby
segmenting featurespacewith n-dimensional clouds calledhyperellipsoids. Ifthestatistical assumptions setforth
by
thismethod are validfora givendataset, theresultingclassification willminimize overallclassification error.Becausethisclassifierissowidelyaccepted and
theoretically
understood,itisoften usedasabenchmarkforcomparisons against new classifiers.
ThesubsequentderivationoftheGMLclassification routine follows closelywith
thatofSchott (1997). The GMLclassifierismostreadily derivedand visualized
by
considering a single
band,
grayscaleimage. Thistreatmentoftheunivariate caseisthenabletobescaledto themultivariate case withthe appropriate number ofspectral
channels.
Using
Bayesian probability theory,thea posterioriprobability[p(/IDC)],
isthe probabilitythata pixel with an observeddigitalcount ofDC willbelong
toclass /.p(DCIi') p(i')
Thea prioriprobability, p(i), istheprobabilitythatany class/willbeobserved. Inother words, this termistheproportion of pixels which
belong
intheclassi. Thechancethata particulardigitalcountDC willbeobservedwithin a certainclassisgivenby
p(DCIi). Thisvalueisevaluatedby
theGMLclassifierusing Equation 5-2 forall valuesofDC and ibasedonthetraining
datasuppliedby
theuser. Afewyearsagothecomputer storagerequirementofthiscalculation wassignificantwhen
dealing
withmultispectral andespeciallywithhyperspectral imagery.
Today,
with moderncomputers, this sameamountcountswithin anygiven classhaveaGaussian distribution. This isbecausethespectral
distributionof classes areonlyrepresented
by
theirmeans and standarddeviations.Where:
f \2
DC-DC;
p(DCIi)=
jhta]
v2o? /
/ istheclass,
DC isthe digitalcount of apixel,
DC,-is theaverageDCoftheclass / and,
a, isthe standarddeviationoftheclass i.
(5-2)
Thetermp(DC)istheprobabilityofany digitalcountoccurring, otherwiseknownasthe
imagewidenormalizedhistogram. This function isthesameforall classes andsimply
scalestheresultinga posterioriprobability. Ifthep(DC)termis dropped fromtheGML
classifier, itwillhavenoeffect onthe results. Thegoalistofindtheclass, i,withthe
highest probabilitynotthevalue oftheabsolute probability. Therankordering is
maintainedwiththe
following
simplified equation:p(ilDC)=p(DCIi)p(i)
(5-3)
Bayes decision function isthendefinedtobetheGMLdiscriminationmetric, D'
,
by
substituting Equation 5-2 into Equation 5-3. The GMLdiscriminatemetric (Equation5-4)
isthevalueby
whichclassmembershipwillbedecidedon apixelby
pixelbasis.\2
D;
=p(DCI0p(0 =-r=2=eDC-DC;
2a]
J2na2
Thismetriccanbefurthersimplified
by
taking
thelogarithmof D'D,"=ln[D/]=ln[p(i)]
--ln[2n]-ln[o,
]
-(DC-DC;)2 2o?
(5-4)
Finally
addingaconstanttoEquation5-5,
wehavearrivedatthefinal GML discriminantshown asEquation 5-6. Neither
taking
thelogarithmnoraddinga constant will changetherankorderingdetermined
by
thediscriminant.D,
=ln[p(0]-ln[a,]-(DC-DC,)'
2a?
(5-6)
Ateach pixelinthe
image,
thediscriminant,
D;
, isevaluatedforallclasses, i. Theclasswiththehighestvalueisselected astheclass ofthatpixel. In many
implementations,
theuserisallowedto select aprobabilitythresholdwhich mustbeexceededbeforea pixel canbe assignedto a class. Pixels thatare not assignedtoaclassareleftasundefinedin
thefinal class map.
DC band 2
Isoprobability contours
[image:30.552.105.417.327.549.2]DC bandl
Figure 5-1 GMLClassification of aTwo BandImage
Whilethe GMLclassifierhas been derivedthusfarassumingaoneband image is
being
classified, this is rarelythecaseinpractice. Imageswhich arenormally classifiedclassifyingmultidimensional
imagery,
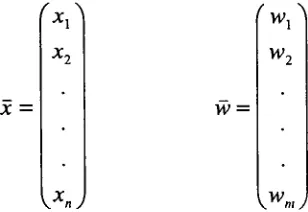
thealgorithmisthesame except scalarmathematicsisreplacedwithvector mathematics. Forexample,takeann-dimensional spectralvector of apixel x and a m-dimensional vector w ofthetargetclassification
classeswhere nisthenumber ofimage bands and misthenumber oftargetclasses.
X=
\XnJ
VV=
W, W,
(5-7)
\WmJ
Inthiscase,Equation5-1 would needtobetransformedtoitsvector equivalentform shown
by
Equation 5-8. The sameis truefortherest ofthecalculationsintheGML classifier.p(w,.lx)=
p(xlw.)p(w[)
[image:31.552.181.335.174.280.2]P(x)
(5-8)
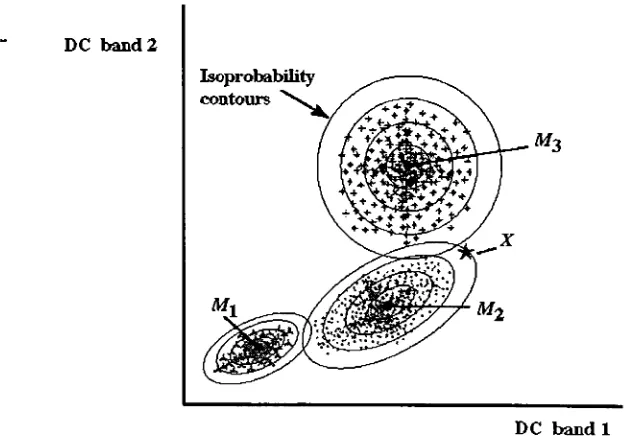
Figure 5-1 has beenprovidedtoaidin visualizingtheclassification of atwoband image containingthreedistinctclasses. Thethreeclasses are centered abouttheir
respective multivariate means
Mi, Mz,
andM3. Theconcentric ellipsoids centered aboutthesemeans representiso-contour intervalsof equal classmembershipprobabilityor GML discriminatevalue. The distributionof pixelshas botha meanin bandone andin
bandtwo.
However,
as seenin Figure5-1,
thedistributioncantakeon adiagonalcharacteras well. Thisis duetocorrelationin digitalcountsofclasses inmultiband
images. Themultivariatestatistical approachtaken
by
theGMLclassifier accountsfor the shapeofthis typeofdistributionwith acovariancematrix.This abilityoftheGML classifier resultsinhigherclassificationaccuracythansimilarclassifiers such astheparallelepiped classifier whichlacksthis ability.
Unlikethe
Fuzzy
ARTMAPandtheRule Based GeneticAlgorithm
which willbestatisticsand makes decisions usingclass orientation and spectral extentinformation
containedinthemean vector and variance-covariance matrix.Thisparametric model
minimizes effectsofnoisyoroutlying
training
data duetoits averagingproperties. This advantageismoderatedby
thefactthatimage datawhich varies greatlyfromnormal can beproblematic. Itis commonlynotedthatGMLperformancemapsbesttovisual interpretationwhen comparedtonon-parametric classifiers. The Environment forVisualizing
Images(ENVl)
software package wasselectedfor its GML implementation foruseinthis thesis.5.3.2
Fuzzy
ARTMAPInrecentyears,several neural-networktypearchitectureshave been implemented
toclassify images. The interest inneural-networksforuseinclassifiersis duetotheir
abilitytoJearnand remainflexible. Theirrulefor
deciding
inwhichcategory toclassifyapixel will change and adaptfromregion toregioninan attemptto make optimal
decisions. Traditionalneural-networkclassifiers havetwoprimarydisadvantages.
First,
neural-networksusetraditionallogicwhich allowsfor onlycrisp set,
binary
decisions.Secondly,
conventional networkshaverequired excessiveamountoftraining
cycles, orepochs. The
fuzzy
ARTMAPsupervisedclassifier,developedby Grossberg
andCarpenteratBoston
University
in1991,
overcomesboththeselimitations. Itcombines a fastlearning
neural-networks architecture withfuzzy
logic decisionmaking.Underlying
principlesofthenetwork'soperation arebasedonmodelingofthehumaneye-brain system. The
fuzzy
ARTMAParchitecture's abilitytolearnand adapt makeitwellsuited to theclassificationofremotelysensedimages. Itwillbeone ofthesupervisedclassifiersfuzzy
ART,
W;ab map field
Pb
F2a
ab
W;'
Fia
F a
reset
A=
(a,ac)
Fb
fuzzy
ART,
wt
match
tracking
Fl"
[image:33.552.109.443.89.300.2]F b B=
(b,bc)
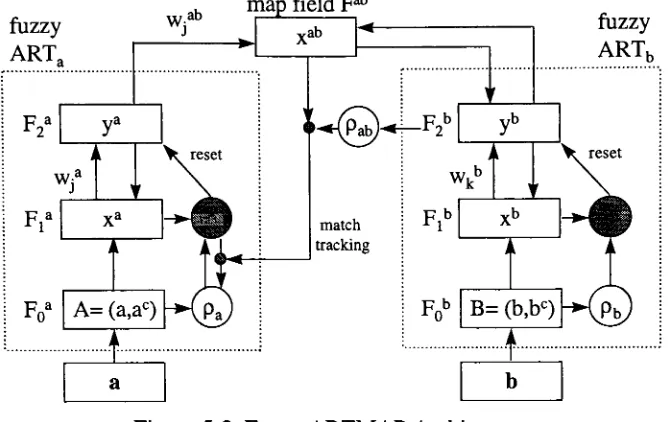
Figure 5-2
Fuzzy
ARTMAP Architecture(Nessmiller,
1995)
The
Fuzzy
ARTMAP doesnothave a classical mathematicalderivation asdoestheGMLclassifier. The
fuzzy
ARTMAPclassifier consists of an advanced neuralnetworkknown astheAdaptive Resonance
Theory
MAPping
(ARTMAP)
combined withfuzzy
logic algorithms. Thearchitectureofthefuzzy
ARTMAP,
shownin Figure5-2,
will
help briefly
describe itsoperation as outlinedby
Nessmiller (1995). Thefuzzy
ARTMAPclassifier consists oftwoAdaptive Resonance
Theory
(ART)
neuralnetworks,labeled
ARTa
andARTt,. The ART'sare unsupervised classifiersby
themselves. TwoART'scanbecombinedto formasupervisedclassifierknownas an ARTMAP. An ARTMAPcanbemodifiedtoincorporate
fuzzy
logicwhichthenforms thefuzzy
ARTMAPclassifier. Thefirststep,as withanysupervisedclassifier,is tosupply
training
pixels. Thespectral vectorfroma
training
pixelissuppliedat a andthecorrespondingclasslabelissuppliedatb. The
intensity
values of each oftheNspectralbands inthetraining
datamustfirst, however,
benormalizedtovaluesbetween 0and 1.Next,
both inputsundergo a calculation called complementcodingatthepreprocessing fieldsF0aandthelabel isencoded with a
binary
designatorwhich willbeusedby
thenetworkto specify theclass categories. Nextcomesthelong
termmemory ofthefuzzy
ARTMAPwhich consists oftheactivityvectorFi
andtheclassification vectorF2.classification p a /Ov/v~N(Z
field
h2
oyow
DO
weight vector W:
Wjl/
/
\
\.WJ2N/
A2
\
\
inputfield Fja
@00
Q
Figure 5-3 WeightVector Operation
(Nessmiller, 1995)
Before training,all theweight vectors are settounity. Thegoal ofthisnetworkis tofindthestrongest connection oftheweightfactorbetweentheinputfieldandthe classificationfield.
However,
beforetheclassificationcanbeconsidered acceptableit must meet or exceedthevigilance parameter. Thevigilanceparameter, p,isacertainty thresholdwhich mustbeexceededinorderto classifyapixelinagiven class. The higher the value, themore certaintheclassifier mustbe. This isanexample offuzzy
logicclassificationfield
ofART
F**
O
w.ab Wjl
inter-ART field Fab (x
classificationfield
ofARTh
v
6
Figure 5-4 Inter-ART Field Operation
(Nessmiller,
1995)
The last step is theinter-ART
field,
representedby
Fab,
which couplesthe twoART'stogether. Theinter-ART fieldhastwopurposes.
First,
itmapstheclassificationfrom
ARTa
to theclassification outputofARTb.Secondly,
itrealizesthematchtracking
rule. Whenthere isa mismatch
during
training
betweenthe output ofARTa
andthecorrect classification of
ARTb,
match trackingoccurs. Comparedto otherimageclassifiers, the
fuzzy
ARTMAPtendstobemathematicallycomplex andcomputationallyintensive. Fora more rigorousdevelopmentofthe
Fuzzy
ARTMAP classifier, thereadermayconsultNessmiller
(1995)
orCarpenter,
etal(1991).The
fuzzy
ARTMAPis a non-parametric classifier soitmakes no assumption ofnormalityastheGMLclassifierdoes.
However,
likeother non-parametricclassifiers,experiencehas indicatedthatittendstobe extremelysensitive tobiased
training
sets andnoisy datapoints. Forthisreasonitrequires a
highly
homogenoustraining
set. Thisproperty is importanttoremember whenselecting
training
regions.Therefore,
thecriterionis very differentwhenselecting
training
setsforthefuzzy
ARTMAPwhencomparedto theGMLclassifier.
Nevertheless,
when supplied withrobusttraining
data it5.3.3
Rule Based
Genetic AlgorithmMysticis
aclassifier,termed terraincategorization
(TERCAT),
whichuseslogicalrules toassignimagepixelstotheirrespective classes. Ithas been implemented
withintheMATRIXenvironment. Rules canbepowerful andflexiblemethodsfor
associatinganobserved pixel with a specific class.
Mystic'
s reliance on rules rather
thanstatistics allowstheclassifiertomake no assumption of normality.
Therefore,
thistypeof non-traditional classifierdoesnot makethesame errorsthatothertraditional
classifiers,such asthe
GML,
makeby
erroneously assumingtargetreflectanceisdistributed inaGaussianmanner. Rules aresimplyalogicalstatement which selects
some pixels and rejects others. Asample rule(Equation
5-9)
isprovidedtoillustratetheclassification process. Parameterswithin each rule are optimizedinsuch awaythethat
therulesfunction inthebestmannerpossible onthesupplied
training
data. Themeasureof howwell a specific rulefunctionsis basedonitsperformance
during
theoptimizationprocess wereit isused againstthe
training data,
wherethe 'true'class in known. Thismeasurefora given ruleiscalled a rewardfunctionandis calculated
by
applyingtheruletoall pixelsinthe
training
set andfinding
thenumberofcorrectlyclassified pixels. Themore pixelsproperlyclassified,thehigherthereward valueforthatcombination of
variables. Inotherwords, thedependent setaccuracyassessmentisused as feedback into
theclassifier.
Obviously,
assessing theaccuracywiththissamedataset will resultinanoverly optimisticaccuracyestimate. Theenormous amount of parametercombinations
allowed
by
even simple rules necessitatestheuse of anadvancedoptimization algorithm.Attempting
to testeach combinationisprecludedduetopracticalitiesoftimeconstraintsonanycurrent orforeseeablecomputer. Recentdevelopmentsofsophisticated
function,
to continueto thenext generation. Evenwiththisadvancedoptimizationtechnique,theMysticclassifieris
extremelycomputationintensive.
Oneofthesimplest and most successfulrulesis givenbelow. This typicalruleis
calledtheonebandthreshold. Once selected,thisrulewouldbeoptimized
by
Mysticontheentire supervised
training
setprovidedby
theuser. Therewardfunctionforthesetof optimization variablesij,kis thenumberof pixels correctlyclassifiedwhenthe
prototype ruleisappliedtothe
training
set. Theset ofoptimizationvariableswiththehighestrewardfunction isthenselected and used withtheruletoclassifytheentire
image.
Theoretically,
once a ruleis optimizeditcanbeappliedtoother, similardatasets.(5-9)
Where:
fy
is
theDCinthei*band
and,ijjcare variables optimized
by
theGA.
Then:
bi
belongs
toclass associatedwithi,
j\andL
Mystic
requiresthat theuserselecttherules which willbeusedto
identify
pixelsineachoftheclasses. Mysticispackaged with6predefined rulesand
allowances are madeforuserdefinedrules. Adifferentrule canbeusedto
identify
eachclassbut only one ruleis allowed within each class. Forexample,differentrules canbe
usedto assign pixelstoclassAor classB. But onlyone rule can assign pixelstoclassA
andonlyone rule can classifypixels as classB. TheMysticalgorithm usestheGAto
optimizethe parameters of eachrule,butnot which ruleisused.
Currently,
theMysticclassifiers areverysimple and utilizeonlyspectralinformationof each pixel. Allrules
arebasedontheDCinthebandsof one pixel without regardtotheneighboringpixels.
Neglecting
thesurroundingpixelsfailstoutilizeanyofthespatialinformationof a scene5.4
Image Data Sets
Three different scenes were selectedtobeusedinthis study. Ofthese
images,
onewas syntheticallygenerated on acomputer whiletherest wereacquiredusingreal
airborne sensors. Theseparticularimageswere selectedbecause
they
representa widesamplingofterrain,phenomenology,andcontent. The M7andDaedalus sensors usedto
acquirethese multispectralimagesare of particularinterestbecause oftheircombination
ofhighspectral and spatial resolution. Thiscombinationhas a great potentialfor
generatingimageswhich canbeclassifiedto ahigh degreeofaccuracy andprecision.
Theimagesusedinthisproject wheretakeninthevisible
(VIS)
toshort-waveinfrared(SWLR)
spectral region oftheelectromagnetic spectrum. Bands longerthanthis, ifany,were eliminatedtoavoidthermalphoton contributions. Thermal bandsare often avoided
whenclassifying images becausethesebandshave low
day-to-day
correlation. Thisattributeisnotdesirable because itmakes
training
datacollectedfromoneimagenotapplicabletoimagesacquired on subsequentdays. Portions aroundtheperimeter of two
images have beenremovedbecause
they
exhibited erroneous sensor effects. Theseportions where not classified anddidnot contributeto accuracy assessment. The images
consistedof rawdigitalcounts.
Nearly
any studyinvolving
different imageclassification algorithms will utilizetheGMLclassifier. The GMLclassifierhas consistently demonstrated highclassification
accuracyand
frequently
isusedas abaseline forcomparisonsof newclassifiers. Itwasselected foruse inthisstudy forthesereasons.
However,
the non-parametricnature oftheMysticclassifierdifferssignificantlyfromtheGML. Thenon-parametric
fuzzy
ARTMAPclassifier was chosenbecauseitutilizedaequallynontraditional approach as
5.4.1
Tank Scene
The first image(Figure
5-5),
which willbecalledthe tankscene,was acquired aspartoftheSouthernRainbowcollection
by
Environmental Research InstituteofMichigan(ERTM). Itwascapturedat 8-bitsper pixels usingthe 16 band M7 aeriallinescanner.
Band number
16,
the thermalband,
was removed and not usedinthisstudy. Thebandpasses fortheremaining bands arelisted Table 5-1. Thisimage inparticularwas
selectedfor its
diversity
of content. Inadditiontoforest, brush,
and exposedsoils, thescene containsavarietyof man-madeobjects. Thescene derived itsname fromthe fact
thatseveralmilitaryvehicles,
including
tanks,arecamouflagedthroughouttheimage.During
classification, all vehicles werecategorizedintoone metal class. Toreduceclassificationerrorandproduce a useful classmap, 9classes were neededtocategorize
thisimagecomparedtoapproximately5forother scenes. This scene wasimagedas part
of a wellorganized collection andistherefore
highly
characterized.Many
groundphotos [image:39.552.181.376.425.661.2]are availablefor
building
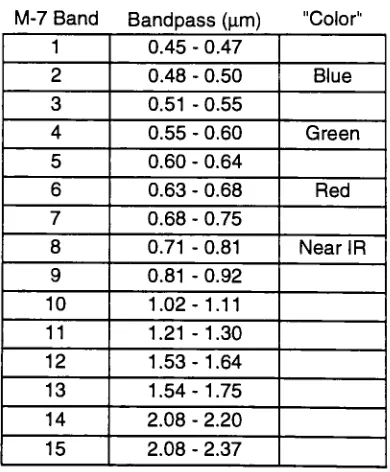
accuratereferencedatasets.Table 5-1 Southern Rainbow Bandpasses M-7 Band Bandpass
(\im)
"Color"1 0.45
-0.47
2 0.48- 0.50 Blue
3 0.51
-0.55
4 0.55- 0.60 Green
5 0.60
-0.64
6 0.63- 0.68 Red
7 0.68
-0.75
8 0.71 - 0.81 Near IR
9 0.81 - 0.92
10 1.02-1.11
11 1.21 -1.30
12 1.53
- 1
.64
13 1.54
- 1 .75
14 2.08 - 2.20
Figure 5-5 Southern Rainbow Tank Scene
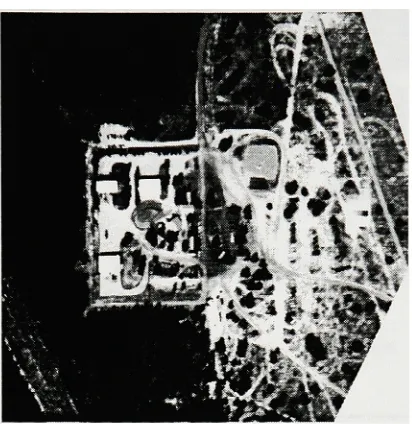
5.4.2 Desert Scene
Thedesertscene(Figure
5-6)
was acquired as part oftheWesternRainbow,
JointCamouflage ConcealmentandDeception
(JCCD)
fieldcollectionusing theDaedalusairborne sensor. The siteofthissceneistheYuma provinggrounds. The original
GIFOVofthescene was onemeter,buttheimagewas alsodegradedto twoandfour
meterresolutionsforuseinthis study. Thescene consists ofmostly desertpavement(or
desertvarnish)butnotable featureshave beenexpandedforillustrationpurposesin
Figure5-6. Thethermalbands have beenremoved again andtheedges which exhibited
severe geometricdistortion have bemasked out. Thecollection was welldocumented
andmanyground photographsare availablefor verifyingthelandcover. The imagewas
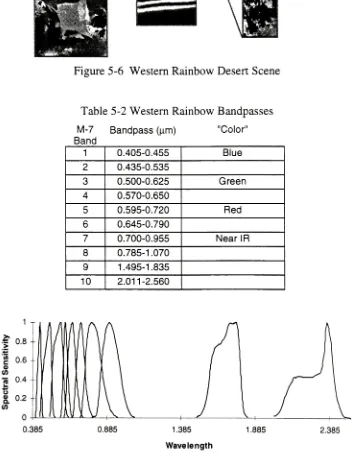
Figure 5-6 Western Rainbow Desert Scene
Table 5-2 Western Rainbow Bandpasses M-7 Bandpass
(nm)
"Color" Band1 0.405-0.455 Blue
2 0.435-0.535
3 0.500-0.625 Green
4 0.570-0.650
5 0.595-0.720 Red
6 0.645-0.790
7 0.700-0.955 Near IR
8 0.785-1.070
9 1.495-1.835
10 2.011-2.560
0.385 0.885 1.385
Wavelength
1.885 2.385
5.4.3 Forest Scene
The forestscene(Figure
5-8)
isthefinal image. Unlike thefirsttwoscenes,which wereimagedwithrealairbornesensors, thisimagewas generatedsynthetically
withtheDigital
Imaging
andRemoteSensing
Image Generation(DIRSIG)
model. Thebandpasses(Table
5-3)
simulatethatoftheM7linescanner. Theradiancefieldgeneratedby
DIRSIGwas convolved with a3x3equal weightedkernel,
resampledtoonethirdoftheoriginal sizeusingcubicconvolution, and quantizedto 8 bitsper pixelforeach ofthe
15 bands. Convolutionwasnecessary becausetheradiance fieldpixelsare spectrally
purebuttheconvolution results contain mixedpixels,asisthecaseinrealimages. Three
versions ofthesynthetic scenewere generated. These images had LOWTRAN
atmospheric visibilities of
23km,
7km,
and5 kilometers. For further detailsaboutsyntheticimages generated
by
DIRSIG,
thereaderisreferredtoDIRSIG,
DigitalImaging
andRemote
Sensing
ImageGeneration, Description, Enhancement,
andValidation [image:42.552.181.373.389.580.2](Schottetal, 1993).
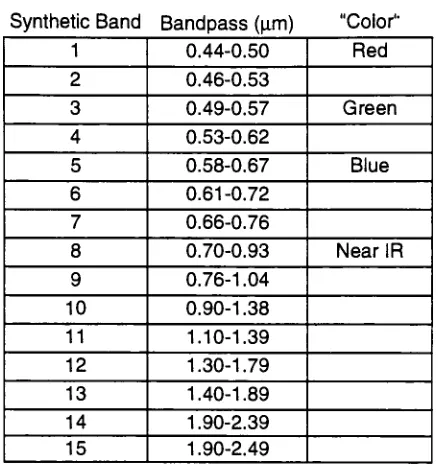
Table5-3 DIRSIG Scene Bandpasses
SyntheticBand Bandpass
(|j.m)
"Color"1 0.44-0.50 Red
2 0.46-0.53
3 0.49-0.57 Green
4 0.53-0.62
5 0.58-0.67 Blue
6 0.61-0.72
7 0.66-0.76
8 0.70-0.93 Near IR
9 0.76-1.04
10 0.90-1.38
11 1.10-1.39
12 1.30-1.79
13 1.40-1.89
14 1.90-2.39
[image:43.552.167.386.119.354.2]6.
Approach
Allthreeclassifierswere trainedusingthesame
training
regionsforeachimage.Providing
anoptimal,commontraining
setforall classifiers wasdifficult butaquantitative comparisonwould notbepossible without it. The accuracyof each ofthe
resultingclassmaps was assessedusing
dependent, independent,
and random referencesources. Reference datafrom DIRSIGmaterial maps was usedforthe syntheticimages
as well. Fromthesereferencesources, the
Simple, Weighted, Kappa,
Prediger'sKappa,
andtheTaucoefficients were calculated. Theresults were obtainedusingacombination
ofrealand syntheticimagery. Thesyntheticdatasets servedasa goodindicatortobias in
theothersamplingtechniques. Trendswere thenobservedintheresults obtainedfrom
boththesamplingmethods andaccuracymetrics. Thegoal ofthis novel approach wasto
identify
theoptimal overall methodfor accuracyassessmentofclassmapsbasedonaccuracyand efficiency.
Asingle program was writtentogenerate a confusionmatrix and evaluatethefive
most common accuracymetrics. Theconfusion matrices were generatedfrom anyoneof
four differentgroundtruthsources.
Dependent,
independent,
randomand syntheticdatasets were readinas rawimage files. Inadditiontoanyone ofthesedatasets,theuser
must also supplyaclassmap. Thisclassmapcanbegenerated
by
anyoftheclassificationmethodsbutmust alsobesuppliedintheformof a rawimage file. Each
referenceand class mapmustbea singlebandimage. Eachclass wasdesignated
by
auniquedigitalcount
(DC)
andthebackgroundclass,ifany,wasdesignatedby
aDCofzero(black). The DC intheclassmapmust matchtheDC inthe truthdatasetforeach
correspondingclass. This wasdone usingaUNIX utility
(XV)
by
changingthegray levelineitherimagetomatchforeach class. A
key
filewasusedforeachclassmaptoidentify
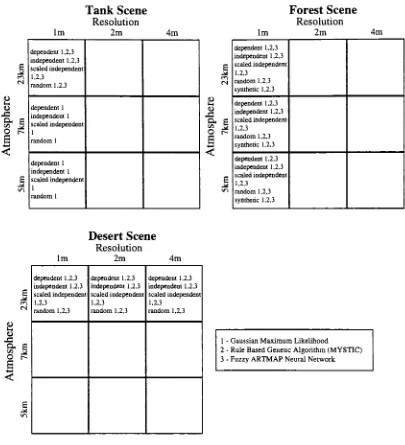
6.1
Experimental Data Set Matrix
Threesceneswere used asthebasis forthiseffort. Imageswere generatedfrom
these scenes withdegradedatmosphericvisibilityor spatial resolution. Images hadthree
possible spatial resolutions: 1 meter,2meter,and4ground spot size. Theatmospheric
visibilityoftheimageswas either23
kilometers,
7kilometers,
or5 kilometers. Duetothelargenumberofpossible combinations of scenes andstressingparameters, only a
limitednumber where selectedforanalysis. Figure 6-1 illustrates theexperimental
matricesforthe stressingparameters of resolution and atmosphericvisibilitywhich were
selectedforeach ofthescenes. Thefigure indicates thesource ofthereference dataused
toassess theaccuracyof each class map. The numbernextto thereference source
indicateswhich classifier or classifiers was usedto categorizethatimage. Foreach ofthe
numbers, thescene was
degraded,
theclassifier(s)were trained,theimageclassified, andthefinalclassmap accuracywas evaluated. Aspart ofthisthesis, atotalof onehundred
andnineteen
(119)
confusion matrices were generated. Theresults ofthese accuracyu <U 1/2 o lm Tank
Scene
Resolution 2m 4m dependent 1,2,3 independent 1,2,3 scaledindependent 1.2.3 random1,2,3 dependent 1 independent 1 scaledindependent 1 random1 dependent 1 independent 1 scaledindependent 1 random1 1) & E o t-lm Forest Scene Resolution 2m 4m dependent 1,2,3 independent 1,2,3 scaledindependent 1,2.3 random1.2,3 synthetic1,2,3 dependent 1,2,3 independent 1,2,3 scaledindependent 1,2,3 random1,2,3 synthetic1.2,3 dependent 1,2,3 independent 1,2,3 scaledindependent 1,2,3 random1,2,3 synthetic1.2,36
< lm Desert Scene Resolution 2m 4m i-i <D O p= dependent 1,2,3 independent 1,2,3 scaledindependent 1,2,3 random1,2,3 dependent 1,2,3 independent 1.2.3 scaledindependent 1,2.3 random1,2,3 dependent 1,2,3 independent 1,2,3 scaledindependent 1,2,3 random1,2,31-GaussianMaximum Likelihood
2- RuleBased Generic Algorithm
(MYSTIC) 3
-FuzzyARTMAPNeural Network
Figure 6-1 Experimental Matrices
6.2
Importing
Training
Data
Training
dataconsistsofthedigitalcounts(DC)
ineachbandof aselect pixel andtheproperclasstowhichitshouldbeassigned.
Training
regions are the imageareas over [image:46.552.65.470.81.526.2]selectedastheapplicationfromwhich
training
regions willbeselected.Using
themouse,polygon verticeswillbeselectedineach imagetodesignate thedesiredclasses.
Differentcolor polygons willbeusedforeach class. Theseregions ofinterest
(ROI)
canthenbeused
directly
forsupervisedclassification(GML)
withinENVI. Tomake animpartialcomparisonbetweenclassification algorithmsitwasdecidedcommon
training
setswouldbeusedforeachimagewithallthreeclassification methods.
The
following
procedurewas usedtoimporttraining
data intotheMysticrulebase geneticalgorithm classifier.
First,
theimageunderneaththe polygons willbereplaced
by
ablack backgroundwithinENVI. The ROI'ssuperimposed overtheblackbackgroundwillthenbesaved as aGIF image. This GIFimage willthenbeconvertedto
a portable pixelmap
(PPM)
using PNMTOOLS. Oncethisiscomplete, the PPM imagecanbe imported into a program which uses thisimage as a mask againsttheoriginal
image. Areas inthemask which areblackarekept
black,
andin areas wherethemaskisnotblacktheoriginalimage will pass. Thiswillbe done on each ofthebands inthe
originalimage automatically
by
theprogram. Theresultis aMystictraining
imagewhich wasblackeverywhereexcept werethedesired ROI'swere selectedin ENVI. In
theseareas, theoriginal multibandimagewill appeared. DuetotheMystic256x256
pixellimiton
training
imagessizes,one extrastep isrequired. TheMystictraining
imageswerelargerthan this soENVI willbeusedto generate a smallerimage
(<256x256)
into which each ofthetraining
regions willbecutandpasted. ThemosaicimagewillserveasthefinalMystic
training
image. This image isthenimported intoMystic'
s
training
function. Eachclass regionisselectedby
specifyingtheproperregion fromtheMystic
training
image. TheMysticiso-datafunction helpsautomatethisprocesses
by
automatically selectingtheproperpolygonaftertheuserclicks withineach
training
region withthemouse. Theiso-dataparameterswillbeadjustedto theproperthreshold toallow properfunctioning. Aftertheregionselection is
done,
Mysticis
trained(rulesareoptimized)onthisdata. OnceMystichas been
classificationis performedontheoriginalimage. Thisprocedurewillberepeated for all thebaseline images.
Theprocedure for
training
theFuzzy
ARTMAPwill requiredless steps onthepart oftheuserwhen comparedto thatofMystic. Firstthetraining
polygons were saved as animagewithablack background. Eachofthepolygonscorrespondingto anindividual classwillbedesignatedby
a unique color. This imageis thensavedfromwithinENVI as aGIF image exactly inthesame manner as was used whiletraining
Mystic. This imagewillthenbeconve