Controls on amorphous organic matter type and sulphurization in a
Mississippian black shale
Joseph F. Emmings
a,b,⁎
, Jan A.I. Hennissen
a, Michael H. Stephenson
a, Simon W. Poulton
c, Christopher H. Vane
a,
Sarah J. Davies
b, Melanie J. Leng
d,e, Angela Lamb
d, Vicky Moss-Hayes
aa
British Geological Survey, Keyworth, Nottingham NG12 5GG, UK b
School of Geography, Geology and the Environment, University of Leicester, Leicester LE1 7RH, UK c
School of Earth and Environment, University of Leeds, Leeds LS2 9JT, UK d
NERC Isotopes Geosciences Facilities, British Geological Survey, Keyworth, Nottingham NG12 5GG, UK
eCentre for Environmental Geochemistry, Sutton Bonington Campus, University of Nottingham, Sutton Bonington, Leicestershire LE12 5RD, UK
a b s t r a c t
a r t i c l e i n f o
Article history:
Received 21 December 2018 Received in revised form 2 April 2019 Accepted 2 April 2019
Available online 05 April 2019
Paleoredox proxies (Fe speciation, trace element andδ34S
py) integrated with sedimentological and palynological observations link the distribution and type of particulate organic matter (OM) preserved to hydrocarbon source rock potential. In the Mississippian Bowland Shale Formation (Lancashire, UK), particulate OM is dominated by
“heterogeneous”amorphous OM (AOM), primarily“sharp-edged, pellet-like”(AOMpel) and“heterogeneous, granular”(AOMgr) types. AOMpel is abundant in muds deposited under anoxic and moderately to highly sulphidic conditions and most likely represents the fecal minipellets of zooplankton and/or pellets of macro-zooplankters. We recognize two intervals,“A”and“B,”which exhibit Sorg/TOCN0.04, suggesting a bulk Type II-S kerogen composition. The Interval A palynofacies is typified by pyritized AOMpel (AOMpyr) particles that contain high-relief organic spheres surrounding individual pyrite framboids, within each AOMpyr particle. These textures are interpreted as sulphurized OM local to pyrite framboids (Sorg-PF). Sorg-PFis rarely observed in Interval B, and absent in all other samples. Redox oscillation between ferruginous and euxinic conditions during early diagenesis of Interval A likely promoted S cycling in microenvironments surrounding pyrite framboids, which generated reactive S species and reactive OM required for sulphurization. Early diagenetic redox oscilla-tion processes were apparently triggered by relative sea level fall, associated with an increased supply of FeHR from adjacent shelves into the basin. Interval B represents deposition during the late stages of basin infill and transition from anoxic to (sub)oxic bottom waters, where AOMpel is replaced by AOMgr as the dominant type of AOM. A large particle diameter at the limit of the mesh size (500μm), sheet-like, fragmented character, and presence of candidate organic sheaths suggests AOMgr at least partially represent fragments of benthic microbial mats, probably as sulphide-oxidizers. A ternary plot of AOMpel + AOMpyr versus AOMgr versus spores + phytoclasts links the observed palynofacies to bottom and pore water redox conditions, water column productiv-ity and proximproductiv-ity tofluvial (deltaic) supply of spores and phytoclasts. These variables were moderated by chang-ing basin accommodation, driven primarily by eustatic sea levelfluctuation. A sequence-stratigraphic control on AOM type and sulphurization is important for understanding the link between source rock heterogeneity and the timing of hydrocarbon generation and expulsion from this source rock.
© 2019 Published by Elsevier B.V. Keywords:
Mudstone
Amorphous organic matter Sulphur
Redox
1. Introduction
The upper unit of the Mississippian Bowland Shale Formation (Upper Bowland Shale; herein“Bowland Shale”) is a potential target for unconventional hydrocarbon exploration and an important conven-tional hydrocarbon source rock in the UK (e.g.,Andrews, 2013; Clarke
et al., 2018) and time-equivalent units across Europe (Kerschke and Schulz, 2013; Nyhuis et al., 2015). The spatial and temporal distribution and type of organic matter (OM) in organic-rich mudstones, such as the Bowland Shale, is an important control on hydrocarbon prospectivity (e.g.,Jarvie, 2012). Palynological assessment of particulate OM type yields important data relating to hydrocarbon source rock generative potential, particularly when supplemented with organic geochemical analyses such as RockEval pyrolysis (e.g., Espitalie et al., 1977). Palynofacies analysis can be used to quantify the proportions of highly aliphatic (“Type I”), moderately aliphatic (“Type II”), humic (“Type
Review of Palaeobotany and Palynology 268 (2019) 1–18
⁎ Corresponding author at: British Geological Survey, Keyworth, Nottingham NG12 5GG, UK.
E-mail address:josmin65@bgs.ac.uk(J.F. Emmings).
https://doi.org/10.1016/j.revpalbo.2019.04.004 0034-6667/© 2019 Published by Elsevier B.V.
Contents lists available atScienceDirect
Review of Palaeobotany and Palynology
III”) and refractory (“Type IV”) palynofacies components (e.g.,Tyson, 1995). Since sulphur (S) radicals associated with organic S (Sorg) cata-lyze hydrocarbon maturation (Lewan, 1998), the recognition of S-rich (sulphurized) OM (“Type II-S”) is also important with respect to under-standing hydrocarbon source rock prospectivity (e.g., Orr, 1986; Dembicki, 2009).
In Mississippian organic-rich mudstones, in particular, the extracted palynological OM fraction (e.g.,Wood et al., 1996) is dominated by amorphous OM (AOM; e.g.,Könitzer et al., 2016; Hennissen et al., 2017). This is especially typical of Mississippian source rocks, given the lack of recognizable marine palynomorphs during the“ Phytoplank-ton Blackout”(Pitrat, 1970; Riegel, 1996; Riegel, 2008; Servais et al., 2016; Tappan, 1970). This 100-Myr phenomenon is possibly explained by high nutrient availability, and therefore high rates of primary pro-ductivity, in the paleo-Rheic-Tethys seaway (Servais et al., 2016). These productive (low stress) conditions potentially supported phyto-plankton which did not produce cysts, considered marine palynomorphs with relatively high preservation potential, because en-cystment was unnecessary (Servais et al., 2016).
AOM is usually described under transmitted andfluorescent light by eye (e.g.,Tyson, 1995), and is often subdivided into“homogenous”and
“heterogeneous”types (e.g.,Hennissen et al., 2017).“Homogenous”
AOM includes gellified humic material, and is therefore often interpreted as Type III OM (Tyson, 1995).“Heterogeneous”AOM is subdivided into“diffuse-edged”(also termed“granular”) and“ sharp-edged”AOM (Tyson, 1995). The former is typically interpreted as bacte-rial or highly degraded plant matebacte-rial and defined as Type III OM.
“Sharp-edged”AOM is usually interpreted as“well-preserved”Type I or II OM, particularly if this is highlyfluorescent under ultra-violet light (Tyson, 1995). Where AOM exhibits a distinctive orange color under transmitted light, this is usually a proxy for S-rich compounds (e.g.,Tribovillard et al., 2001). Under suitable conditions, S may be in-corporated into OM during syngenesis or early diagenesis, a process that is termed sulphurization (e.g.,Sinninghe Damsté and De Leeuw, 1990a; Amrani, 2014).
In order to understand controls on the types and distribution of AOM and mechanisms for sulphurization, geochemical and palynological data were integrated through three sections of the Mississippian Upper Bowland Shale in the Craven Basin (Lancashire, UK), a basin with ongoing hydrocarbon exploration (Clarke et al., 2018). Palynofacies abundance data were integrated with syngenetic and early diagenetic paleoredox proxies including Fe-speciation, redox-sensitive trace element andδ34Spyanalyses.
2. Geological setting
The Bowland Shale was deposited in a series of epicontinental basins within the Rheic-paleo-Tethys paleoequatorial seaway, spanning from present-day North America to Poland (e.g.,Davies et al., 1999). This sea-way developed in response to oblique collision between Gondwana and Laurussia (Warr, 2000), including phases of extension (e.g., active rifting), thermal subsidence, strike-slip and compression tectonism. Mississippian extension (Leeder, 1982) generated a series of graben and half-graben structures, separated by platform“blocks”and“highs”
(e.g.,Waters and Davies, 2006) (Fig. 1a). Transition from active rifting to thermal subsidence broadly aligns with subdivision of the Bowland Shale Formation into lower and upper units coincident with the Visean-Serpukhovian boundary (Bisat, 1923; Davydov et al., 2012; Earp, 1961; Menning et al., 2006; Waters et al., 2009). The Upper Bowland Shale was deposited from the early to late Pendleian (~ 330–330.7 Ma;Gastaldo et al., 2009; Waters and Condon, 2012) in the Craven Basin (Fig. 1c).
The switch from rift to thermal sag, coupled with the advance of Pendlefluviodeltaic systems across and around the Askrigg Block, pro-duced an interdigitating succession of hemipelagic and siliciclastic facies in the Craven Basin, as the mixed-to-siliciclastic Upper Bowland Shale
(e.g.,Brandon et al., 1998). Sedimentary facies include hemipelagites, turbidites, hybrid event beds and lenticular mudstones (Emmings et al., 2019) and the Hind Sandstone Member (Aitkenhead et al., 1992; Moseley, 1952; Moseley, 1962), which is an injectite (Kane, 2010). Craven Basin water depth likely ranged from ~ 100 to 200 m (Davies, 2008; Holdsworth and Collinson, 1988) through to several hundred metres (Davies et al., 1993).
Hemipelagic sediments in the Bowland Shale include discrete, macrofauna-bearing, calcareous sedimentary packages (“marine bands”; e.g.,Ramsbottom, 1977;Fig. 1c) that are typically linked to starved siliciclastic input during the maximum rate of transgression (Posamentier et al., 1988) and/or at maximum marine flooding (Martinsen et al., 1995). Marine band cyclicity was likely a response to far-field ice-sheet volume on Gondwana (Veevers and Powell, 1987).
The macrofaunal body fossils present, particularly ammonoids, form the basis of a high-resolution biostratigraphic framework (Ramsbottom and Saunders, 1985). The ammonoid biozones E1a1, E1b1, E1b2and E1c1 are recognized in the Upper Bowland Shale (e.g.,Brandon et al., 1998) (Fig. 1c), with an average periodicity of 111 ka (Waters and Condon, 2012). Multipleflooding surfaces are recognized for E1a1(a, b and c) and E1b2(a and b) marine bands (Fig. 1c), which may represent sub-100 ka precession or obliquity forcing (Waters and Condon, 2012). The Bowland Shale was followed by deposition of delta-top facies on the Askrigg Block and a submarine turbidite fan complex in the basin (Fraser and Gawthorpe, 1990; Kirby et al., 2000), as the Pendleton For-mation (Waters et al., 2007) (Fig. 1c). Variscan inversion of the Craven Basin resulted in the development of a set of north-east south-west trending folds, thrust-folds and monoclines, collectively defined as the Ribblesdale Fold Belt (Arthurton, 1984; Gawthorpe, 1987) (Fig. 1b).
3. Materials and methods
Outcrop locality Hind Clough (grid ref.: 364430 453210, British Na-tional Grid projection) exposes the Upper Bowland Shale as a ~124 m thick stream-cut and weathered slope section (e.g.,Moseley, 1962; Brandon et al., 1998; Emmings et al., 2019) on the north-west edge of the Ribblesdale Fold Belt (Arthurton, 1984; Gawthorpe, 1987). Together the sections at Hind Clough and in nearby boreholes Marl Hill 4 (MHD4; 367426 446752) and Cominco C9 (386010 463500) (Fig. 1b) were logged, sampled and assigned sedimentary facies (A–J) byEmmings et al. (2019). The stratigraphic framework was based on ammonoid biozones identified byBrandon et al. (1998). The sampling strategy was designed to minimize the potential for alteration due to modern weathering at outcrop, as implemented byEmmings et al. (2017).
3.1. Palynology
34 palynology samples were processed using standard preparation methods (Wood et al., 1996), using hydrochloric (36% vol/vol) and hydrofluoric (HF) (40% vol/vol) acid to remove carbonate and silicate phases, respectively. Kerogen residues were sieved at 500 and 10μm. Residues were spiked withLycopodium clavatumspores (batch no. 3862, MPA66949–66953, 2 tablets in 5 g sample; MPA67171–68150, 3 tablets in 5 g sample) in order to calculate absolute abundances using the marker grain method (Maher, 1981; Stockmarr, 1971). Since AOM was the primary target in this study, and highly abundant compared to spores, this precluded calculation of absolute abundances using the marker grain method. A much larger spike (i.e.,N10 tablets) could po-tentially enable quantification of spore absolute abundances (but not AOM) in this material. A subset of residues were oxidized for 7 min using fuming nitric acid.
using a 100 V tungstenfilament (HVP) lamp at maximum brightness passed through the Zeiss 00 Propidium Iodide (PI) filter set (λ530–585 nm excitation). A subset of slides were also analyzed under a mercury HXP light source. Under green-light, the spectral irra-diance for tungsten filament lamps and mercury lamps is similar (Lin and Davis, 1988). × 10, × 40 and × 100 (oil immersion) EC Plan Neofluor objectives were utilized. Emitted light was red-lightfiltered (530–585 nmλbeam-splitter,filtering emission aboveλ615 nm).
Green lightfluorescence (coupled with red lightfilter) was used as a proxy for moderately quenched (i.e., polymerized) structures and highly“delocalized”double bonds (Lin and Davis, 1988). Aromatic structures contain highly delocalized bonds, rather than acyclic com-pounds which may contain isolated double-bonds (e.g., alkenes, acyclic terpenoids). Thus green light fluorophors represent phenols and heteroatomic aromatic moieties contained within aliphatic polymers, and some aromatic (e.g., lignin-containing) substances. Highly poly-merized substances that contain abundant delocalized bonds (e.g., humic compounds) promote quenching and are therefore typi-cally non-fluorescent under all wavelengths (Lin and Davis, 1988).
Images were captured with an AxioCam MR R3 camera connected to a PC with Zen 2012 (Blue Edition) software. All images were captured in
a dark room and under the same ambient light conditions. Particles were described and counted using an automatic stage, based on visual assessment and semi-automated analysis of extracted particle shape and fluorescence parameters using the Fiji ImageJ platform (Schindelin et al., 2012). Total AOM and AOMgr abundances are there-fore relative and corrected for particle area. Palynofacies abundance data are provided in Appendix A.
3.2. Geochemistry
Samples selected for geochemical analysis were crushed and agate-milled to afine powder. 193 samples were selected for pyrolysis, con-ducted onfinely powdered samples in a Rock-Eval 6 pyrolyser (Vinci Technologies) in standard configuration and operated using the Bulk-Rock method (e.g.,Słowakiewicz et al., 2015). The generated total organic carbon (TOC) and inorganic C (MINC) data were previously reported byEmmings et al. (2019).
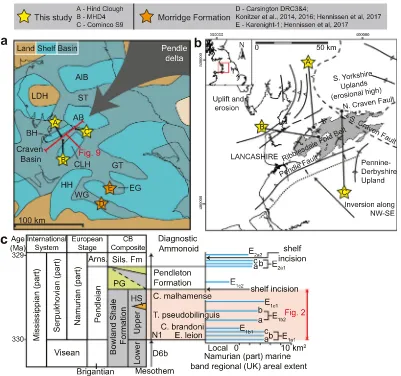
[image:3.595.103.504.51.427.2]Total carbon (C) and sulphur (TS) concentrations were measured on 110 samples using a LECO CS 230 elemental analyser. Major and trace element concentrations were measured on fused beads (109 samples) and powder briquettes (108 samples) with a PANalytical Axios Fig. 1.(a) Regional basin structure modified fromWaters et al. (2007), including the Craven Basin, study positions Hind Clough (A), MHD4 (B) and Cominco S9 (C), and UK coastline. Palynological studies byHennissen et al. (2017)andKönitzer et al. (2016)through the broadly time equivalent (Pendleian to Arnsbergian) Morridge Formation from the Widmerpool Gulf (D) and Edale Gulf (E) are also plotted for reference. LDH = Lake District High; AIB = Alston Block; ST = Stainmore Trough; AB = Askrigg Block; BH = Bowland High; CLH = Central Lancashire High; GT = Gainsborough Trough; EG = Edale Gulf; WG = Widermerpool Gulf; HH = Holme High; (b) The Bowland Shale Formation is exposed as part of the Ribblesdale Fold Belt, including Westphalian structural elements (Fraser and Gawthorpe, 1990) and study sites Hind Clough (outcrop) and borehole Marl Hill 4 (MHD4). Outcrop extent data are based on DigMapGB-625, published with permission of the British Geological Survey. (c) Generalized Lower Namurian stratigraphy and Craven Basin composite after Brandon et al. (1998). Marine band areal extent data fromWaters and Condon (2012), including diagnostic ammonoid fauna fromRiley et al. (1993). Mesothems fromRamsbottom (1973). HS = Hind Sandstone Member. PG = Pendle Grit Member.
Advanced X-Ray Fluorescence (XRF) spectrometer using default PANalytical SuperQ conditions.“Excess Si”(sensu.Sholkovitz and Price, 1980) was calculated byEmmings et al. (2019)and interpreted primarily as a pelagic and biogenic (radiolarian) signal that did not mi-grate significantly during diagenesis. Trace element enrichment factors (EFs) (e.g.,Tribovillard et al., 2006) were utilized to normalize to abun-dances to the detrital fraction (Eq.1), using Post-Archaean Average Shale (PAAS) (Taylor and McLennan, 1985). X is the element concentra-tion (major elements; wt.% and trace elements; ppm).
EFelement¼
X Al sample=
X
Al PAAS ð
1Þ
Fe species concentration data for 99 samples were measured via se-quential extraction of“highly reactive”Fe (FeHR;Poulton and Canfield, 2005; Eq. 2) phases, including carbonate-associated Fe (Fecarb; e.g., siderite and ankerite), ferric (oxyhydr)oxides (Feox;e.g., goethite, haematite) and magnetite (Femag). The extraction is a simplification of the method ofPoulton and Canfield (2005). Fecarb, Feoxand Femag con-centrations were measured using an Atomic Absorption Spectrometer (AAS).
The pyrite (Fepy) fraction was estimated via extraction of sulphide S liberated by boiling chromous chloride solution, and titrated as Ag2S (Canfield et al., 1986). This followed extraction of HCl-soluble (acid-vol-atile, FeAVS) sulphide S, in boiling HCl (Canfield et al., 1986), although in all samples FeAVSwas only present as a trace component (below the limit of determination). FeHR/FeT(FeT; total Fe) and Fepy/FeHRare com-pared with established thresholds for redox (Poulton and Canfield, 2011; Poulton and Raiswell, 2002; Raiswell and Canfield, 1998). Facies H–I FeHRis presented on a Femag-free basis, due to the likely input of de-trital Femag(seeEmmings, 2018).
FeHR¼FecarbþFeoxþFemagþFepy ð2Þ
37 sample powders (~1 g) were washed for 24 h in 200 ml 10 wt/vol % NaCl in order to leach free sulphate (Kampschulte et al., 2001). Total S measured on NaCl-washed residues was compared with the total S of untreated powders, yielding an estimate for the sulphate S (Ssul) frac-tion, after correction for the mass loss assuming leaching of pure CaSO4(Appendix B). In most cases, estimated Ssulwas within or close to ±0.08 wt.% of the total (untreated) S (i.e., the long-term analytical precision). Therefore Ssulis negligible for most samples. Sorgcontent was estimated by subtraction of Spy (Fepy*1.15) and Ssul from TS (Eq.3) (e.g.,Tribovillard et al., 2001). Propagating the precision of TS, Spyand Ssulin quadrature yields a precision estimate of ±0.12 wt.% Sorg.
Sorg¼TS−Spy−Ssul ð3Þ
S isotope ratios for chromium-reducible (Spy) extracts (as Ag2S) were measured using a Thermo Finnigan Continuous Flow-Elemental Analysis-Isotope Ratio Mass Spectrometry (CF-EA-IRMS) system, com-prising a Delta Plus XL isotope ratio mass spectrometer interfaced with a Flash 1112 elemental analyser.36S/34S ratios of pyrite S are re-ported usingδ34Spy(‰) notation on the VCDT scale. S isotope ratios were drift-corrected using IAEA-S-3 (−32.3‰VCDT) and calibrated using a linear two-pointfit through IAEA-S-1 (−0.3‰VCDT) and IAEA-S-3.δ34Spyprecision is estimated at ±1.0‰, based on two stan-dard deviations of repeat analyses, including IAEA-S-2 (+ 22.7‰
VCDT). Scanning electron microscopy (SEM) was conducted on un-coated ultrathin sections using an S-3600N Hitachi microscope with Ox-ford INCA 350 EDS. Electron microphotographs were acquired using backscattered electrons (BSE) at 15 kV accelerating voltage, 50–66μA filament current, in low-vacuum mode (25 Pa) and 15.0–16.3 mm (typ-ically 16.1) working distance (WD).
4. Results and discussion
4.1. Palynofacies and paleoredox
The palynofacies assemblage in sedimentary Facies A–G (seeFig. 2) is dominated by AOM, while spores and phytoclasts are a minor compo-nent (b20%), and marine palynomorphs are absent (Fig. 2;Table 1). In Facies H–I at Cominco S9, spores and phytoclasts are dominant (Fig. 3;
Table 1). Nearly all AOM is“heterogeneous”(e.g.,Tyson, 1995) and subdivided into two main types; “sharp-edged, pellet-like” AOM (AOMpel;Plate I) and“granular”AOM (AOMgr;Plate II). AOMgr is rare in Facies A–F and is the dominant type of AOM in Facies G, whereas AOMpel is dominant Facies A–F and rare in Facies G.
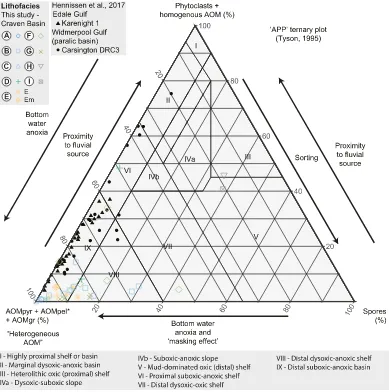
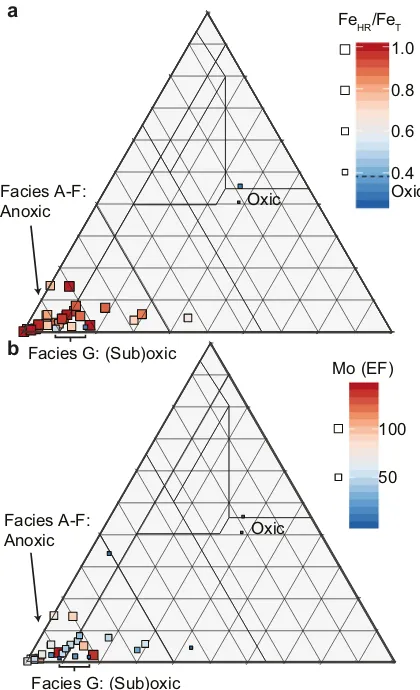
Plotting heterogeneous AOM versus phytoclasts versus spores (Fig. 4) demonstrates most Facies A–G samples are sited in the“distal suboxic–anoxic basin”and“distal dysoxic–anoxic shelf”fields ofTyson (1995). Anoxic conditions in bottom waters during deposition of Facies A–F sediments are supported by enrichment in redox-sensitive trace el-ements Mo and U (e.g.,Tribovillard et al., 2006) and FeHR/FeTN0.38 (Figs. 2, 4–5;Table 1) (Poulton and Raiswell, 2002; Raiswell and Canfield, 1998). Facies H–I samples at Cominco S9 are sited in the
“heterolithic oxic (proximal) shelf”and“mud-dominated oxic (distal) shelf”fields ofTyson (1995), respectively. Bottom water ventilation during deposition of Facies H–I is consistent with a lack of enrichment in Mo and U and FeHR/FeTb0.38 (Figs. 2, 4–5;Table 1). Morridge Forma-tion palynofacies data from the Edale Gulf and Widmerpool Gulf (Hennissen et al., 2017) plot along a mixing line between the“distal suboxic-anoxic basin”and“marginal dysoxic-anoxic basin”fields of
Tyson (1995).
AOMpel is not comparable to AOM in contemporaneous mudstones from the nearby Widmerpool Gulf paralic basin (Fig. 1a) (Hennissen et al., 2017; Könitzer et al., 2016), but is similar to a variety of“ well-pre-served”AOM with Type I and II composition.“Well-preserved”AOM is observed in the Kimmeridge Clay (Tyson, 1989; Tyson, 1995) and rela-tively aliphatic (H-rich) intervals from the Bowland Shale in the Edale Gulf (Fig. 1a) (Hennissen et al., 2017), for example. AOMpel typically ex-hibits pellet-like geometries (e.g.,Plate I, 3, 5, 7). Thus AOMpel most likely represent the fecal minipellets of zooplankton (e.g.,Stoecker, 1984; Gowing and Silver, 1985; Beaumont et al., 2002; Lampitt et al., 2009) and/or fecal pellets of macro-zooplankton (e.g., Porter and Robbins, 1981; Bruland and Silver, 1981; Cuomo and Chen, 1996; Henschke et al., 2016).
AOMgr (Plate II) exhibits a large particle diameter (500μm, i.e., limit of the mesh size), sheet-like, fragmented character (Plate II, 4) and con-tains candidate organic sheaths (Plate II, 6, 7). AOMgr is comparable to
“diffuse-edged AOM”(Tyson, 1995) and most AOM in contemporane-ous mudstones from the paralic Widmerpool Gulf (Fig. 1a), including AOMgr described byHennissen et al. (2017), and AOMGr and possibly AOMBr described byKönitzer et al. (2016). The relative abundance of AOMgr increases significantly above the transition from anoxic (Facies F) to suboxic or oxic (Facies G) bottom waters, indicated by a loss of en-richment of redox sensitive trace elements, such as Mo and U (e.g.,Tribovillard et al., 2006), FeHR/FeTclose to 0.38 (Poulton and Raiswell, 2002; Raiswell and Canfield, 1998), and bioturbation in Facies G (Emmings et al., 2019). AOMgr dominates the palynofacies assem-blage in Facies G (Fig. 2;Table 1) so that Facies G is sited in the“distal suboxic–anoxic basin”and“distal dysoxic–anoxic shelf”fields ofTyson (1995)(Figs. 4–5). This is slightly inconsistent with the paleoredox proxy record which suggests deposition under dominantly oxic or suboxic conditions.
Presence of pyritized burrows, and early diagenetic nodular, aggre-gated and large framboidal pyrite forms in Facies G (Emmings et al., 2019) suggests highly sulphidic, and advective or stagnant conditions existed near seabed (Rickard, 2012). This is supported by highδ34
(e.g.,Nissenbaum et al., 1972; Mossmann et al., 1991; Canfield et al., 1992). On this basis, AOMgr likely represents the remnants of extracel-lular polysaccharides (e.g.,Pacton et al., 2007, 2011) produced by ben-thic microbial mats. This is supported by sedimentological interpretations (Emmings et al., 2019). Such mats potentially colonized a niche environment at the seabed as chemoautotrophic or chemoheterotrophic sulphide-oxidizers (e.g.,Grunke et al., 2011).
4.2. Mechanisms for sulphurization
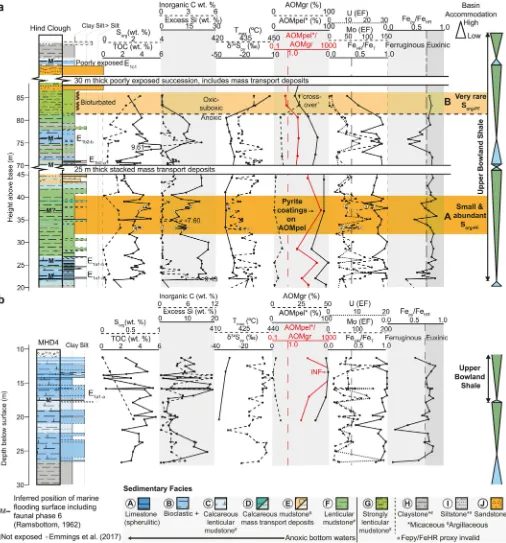
[image:5.595.51.557.52.595.2]Intervals“A”(within Facies F) and“B”(Facies G) exhibit Sorg/TOCN 0.04, suggesting a bulk Type II-S kerogen composition (Orr, 1986). A mi-crobial mat origin to AOMgr may explain the exceptionally high Sorg content in Interval B (Facies G). Modern microbial mats oxidize H2S using O2or NO3−as an electron acceptor across a strong redox gradient Fig. 2.Sedimentary logs through Hind Clough (a) and borehole MHD4 (b), fromEmmings et al. (2019), plotted with selected geochemical data including RockEval pyrolysis total organic carbon (TOC), inorganic C content and Tmax, organic S (Sorg), bulk pyriteδ34Spy, enrichment factors (EFs) for redox-sensitive trace elements (Mo, U) and Fe speciation redox proxies. See Materials and Methods for derivation of“excess Si”and calculation of trace element enrichment factors (EFs). Intervals A and B exhibit relatively high Sorgcontent. Interval A contains abundant sulphurized AOM spheres surrounding pyrite framboids (Sorg-PF).
at the seabed (Bailey et al., 2009; Canfield and Teske, 1996; Grunke et al., 2011; Sievert et al., 2007; Wirsen et al., 2002), and are consortia of several different types of bacteria. AOMgr is probably most
[image:6.595.36.549.83.327.2]comparable to the colorless sulphur bacteriumArcobacter(phylum Proteobacteria) that produces a“cotton-ball”-like structure (Grunke et al., 2011; Wirsen et al., 2002) via fixation of Sorgin filaments Table 1
Selected palynofacies abundances and geochemical data.
Sample Depth /Height
(m) Location Facies AOMpel* (%) AOMgr
(%) TOM (%) Total AOM (%)
AOMpel/
AOMgr AOMpelTOM/ T(°C)max TOC (%) MINC (%) (%)S (%)Spy S(%)sul S(%)org Atomic S/C δ 34Spy (‰) FeFeHRT/
Fepy/ FeHR
Mo (EF) (EF)U SSK61352 11.9 C-S9 I 10.1 11.0 78.8 21.1 0.9 7.8 457 2.17 0.30 0.047 0.04 0.01 <LLD - –8.6 0.25 0.04 1.00 0.80 SSK61392 33.28 C-S9 H 11.4 7.2 83.3 18.6 1.6 7.3 456 3.26 0.28 0.14 0.09 - <LLD - – 0.3 0.08 1.10 0.8 SSK61404 40.72 C-S9 B 53.0 15.2 31.9 68.2 3.5 0.6 445 3.42 1.63 1.61 1.47 0.10 0.04 0.00 –32.1 0.72 0.67 26.60 5.80 SSK61420 49.74 C-S9 F 42.6 10.4 46.8 53.0 4.1 1.1 443 1.95 0.12 3.07 2.95 0.28 <LLD - –24.4 0.64 0.83 2.70 1.4 HC02_198 114 HC F 49.5 11.1 39.4 60.6 4.5 0.8 433 3.1 0.2 0.22 0.09 0.05 0.08 0.01 –35.5 - - 6.7 3.1 HC02_191 85.7 HC G 36.9 45.6 17.6 82.5 0.8 0.5 440 2.7 0.2 4.05 1.23 0.26 2.56 0.34 6.4 0.31 0.74 2.9 2.0 HC02_188 83.6 HC G 44.5 45.9 9.3 90.4 1.0 0.2 440 3.3 0.2 3.61 1.93 0.12 1.56 0.17 –8.9 0.51 0.78 3.3 2.7 HC02_184 80.83 HC F 62.4 11.7 26.0 74.1 5.3 0.4 432 4.1 0.2 4.81 3.66 0.24 0.91 0.08 –39.5 0.90 0.73 48.9 7.0 HC02_174 76.1 HC B 76.9 13.0 10.1 89.9 5.9 0.1 432 4.5 1.5 3.51 2.04 1.37 0.10 0.01 –34.0 0.88 0.37 143.9 15.9 HC02_166 72.02 HC F 72.5 14.4 13.0 86.9 5.0 0.2 433 3.5 0.2 3.63 3.27 0.08 0.27 0.03 –30.8 0.91 0.79 25.1 4.5 HC02_127 62.78 HC B 54.9 26.1 19.1 81.0 2.1 0.3 433 4.92 0.21 2.90 2.56 <LLD 0.34 0.02 –37.2 1.00 0.73 137.8 7.9 HC02_125 62.44 HC D 87.4 8.8 3.8 96.2 9.9 0.0 437 1.59 3.19 1.43 1.19 0.13 0.11 0.02 –27.9 1.00 0.55 108.6 15.7 HC02_120 61.6 HC Em 89.5 3.0 7.6 92.5 29.8 0.1 437 1.61 0.08 0.45 0.51 <LLD <LLD - –27.0 0.75 0.75 18.1 5.3 HC02_106 56.35 HC E 65.4 20.5 14.2 85.9 3.2 0.2 439 3.45 1.71 2.81 2.07 0.12 0.63 0.06 –29.7 0.75 0.60 26.4 6.2 HC02_101 54.7 HC E 93.9 1.5 4.8 95.4 62.6 0.1 439 2.43 0.38 1.61 1.48 0.05 0.08 0.01 –24.8 0.92 0.70 21.5 4.8 HC02_87 51.86 HC E 77.2 11.9 10.9 89.1 6.5 0.1 435 3.77 1.21 3.72 2.71 0.52 0.50 0.05 –34.3 0.80 0.73 50.8 8.6 HC02_75 48.82 HC E 63.1 23.0 13.9 86.1 2.7 0.2 442 1.71 1.13 1.75 1.23 0.09 0.44 0.09 –23.0 0.73 0.63 19.8 4.2 HC02_73 48.14 HC Em 87.9 3.2 8.8 91.1 27.5 0.1 440 2.19 1.14 2.40 1.75 0.16 0.49 0.08 –28.5 0.82 0.65 34.4 5.5 HC02_67 44.77 HC E 87.9 3.0 9.2 90.9 29.3 0.1 431 2.27 1.57 3.94 2.88 0.12 0.93 0.15 –34.1 0.81 0.73 64.6 9.7 HC01_04B# 37.37 HC F 84.8 0.4 14.5 85.2 212.0 0.2 432 3.87 0.09 4.88 2.94 0.89 1.05 0.10 –40.1 0.77 0.65 77.5 9.7 HC02_37 28.7 HC F 68.4 14.6 17.0 83.0 4.7 0.2 440 3.75 0.17 1.16 0.97 0.20 <LLD - –34.6 0.95 0.74 47.6 10.4 HC02_31 25.52 HC C 97.8 0.7 1.4 98.5 139.7 0.0 441 4.33 0.82 1.25 0.97 0.09 0.19 0.02 –31.0 0.94 0.65 72.5 5.1 HC02_21 22.02 HC B 73.1 7.4 19.6 80.5 9.9 0.3 441 2.92 0 2.28 2.12 <LLD 0.16 0.02 –36.5 0.99 0.77 91.7 6.8 HC02_16 16.4 HC B 91.4 3.2 5.2 94.6 28.6 0.1 442 3.55 3.65 1.29 1.16 0.07 0.06 0.01 –25.3 0.98 0.65 66.9 3.5 HC02_14 12.9 HC B 49.6 15.5 35.0 65.1 3.2 0.7 441 2.95 3.66 1.75 1.56 0.06 0.13 0.02 –33.0 0.86 0.61 55.4 3.5 HC02_13 11.6 HC B 72.7 12.8 14.5 85.5 5.7 0.2 442 3.31 2.03 1.73 1.48 0.16 0.13 0.01 –30.1 1.00 0.76 49.6 4.8 HC02_11 5.9 HC D 76.3 5.2 18.3 81.5 14.7 0.2 436 2.18 4.04 3.01 2.61 0.21 0.19 0.03 –29.6 0.91 0.73 36.9 10.8
HC02_2 0.68 HC B 77.1 10.3 12.5 87.4 7.5 0.2 442 3.43 3.09 2.09 1.75 0.13 0.21 0.02 –30.8 0.96 0.77 43.0 4.4 SSK60768 10.8 MHD4 A 95.3 2.6 2.1 97.9 36.7 0.0 435 2.66 6.78 1.04 0.91 0.12 0.01 0.00 –29.3 0.82 0.51 74.8 5.8 SSK60774 12.9 MHD4 B 99.8 0 0.1 99.8 INF 0.0 435 4.87 5.51 2.15 1.87 0.14 0.14 0.01 –32.1 1.00 0.80 64.2 6.2 SSK60787 16.55 MHD4 B 95.4 2.1 2.3 97.5 45.4 0.0 435 5.2 5.09 1.81 1.55 0.51 <LLD - –34.6 1.00 0.77 49.6 12.9 SSK60798 20.18 MHD4 B 75.2 7.0 17.9 82.2 10.7 0.2 430 4.54 2.41 4.92 3.72 0.65 0.55 0.04 –36.7 0.89 0.75 98.6 8.4
*This fraction is dominated by AOMpel (including AOMpyr) but also includes other possible sub-types of heterogeneous, sharp-edged AOM. SeeEmmings et al. (2019)for sedimentary facies description and interpretations. SeeEmmings (2018)for Fe-speciation and Mo and U data and interpretations. Facies E and Em likely represent mass transport deposits (Emmings et al., 2019), and therefore contain Sorg-rich AOMgr as rip-up clasts. Highlighted rows indicate Interval A (bottom) and B (top) as detailed inFig. 2. TOM = terrestrial palynomorphs (spores) and phytoclasts. MINC = inorganic C. C-S9 = Cominco S9. HC = Hind Clough. MHD4 = Marl Hill 4. Facies H-I FeHRis presented on a Femag-free basis, due to the likely input of detrital Femag(seeEmmings, 2018for discussion).#RockEval pyrolysis and major and trace element data reported byEmmings et al. (2017).
Cominco S9 0 5 10 15 20 25 30 35 40 45 50 55 60 65 70 Clay Silt Sand Mud
F M C
E1c1
0 2 4
TOC (wt. %)
-40 -20 0
Sorg < LLD
δ34S py(‰)
Ferruginous Euxinic
0 1 2
0 10 20
Excess Si (wt. %) Inorganic C (wt. %)
430 445
Tmax (ºC) 460 AOMgr (%) 50 100 0 AOMpel* (%) 50 100 0 AOMpel*/AOMgr (%) 1.0 1000 0.1
0.0 0.5 1.0
FeHR/FeT**
Depth below surface (m) M
0 5 U (EF) 10 0 20 Mo (EF) 40
0.0 0.5 1.0
Fepy/FeHR**
Basin Accommodation
High
Low
[image:6.595.37.551.452.700.2](Steudel, 1989).Arcobactermats are present at cold seeps on the Nile Deep Sea Fan (Grunke et al., 2011), for example. AOMgr may also be comparable toThiopoloca, a sulphide-oxidizing denitrifier that is wide-spread beneath the upwelling Peru-Chile upwelling region (Fossing
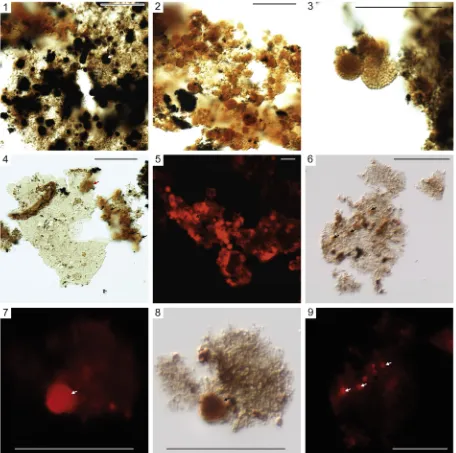
et al., 1995). Alternatively, the high Sorgcontent in Interval A may be ex-plained by direct reaction of H2S with OM (e.g.,Sinninghe Damsté and De Leeuw, 1990a; Amrani, 2014). Regardless of Sfixation mechanism, stagnation or advection of sulphidic porwaters near seabed implies Plate I.“Sharp-edged”heterogeneous amorphous organic matter (AOMpel) example transmitted light microphotographs. Scale bars = 50μm unless otherwise stated. 1–4. MPA68143. 5. MPA68144. 6. MPA66949. 7–9. MPA68145.
relatively vigorous and sustained rates of SO4-reduction (as the likely source of sulphide) and/or minimal buffering by reactive Fe in underly-ing sediments.
Ancient examples of benthic microbial mats are rare (Catuneanu, 2007; Schieber, 1986; Schieber et al., 2007a; Schieber et al., 2007b; Seckbach and Oren, 2010), especially regarding chemotrophs (Bailey
et al., 2009). Early silica-cemented chemotrophic microbial mats are present in the Miocene Monterey Formation (Williams, 1984), which potentially contributed significantly to the petroleum system and Type II-S kerogen composition (Orr, 1986; Williams, 1984). S-richfilaments in modern chemosynthetic microbial mats can be sheathed by OM (Wirsen et al., 2002). Such sheaths are possibly observed within AOMgr (Plate II, 6, 7), although these are not a universal feature (Wirsen et al., 2002), and are not always preserved (Grant, 1991). Sul-phide is toxic to infauna (Wang and Chapman, 1999). Thus predators to mats, such as gastropods (e.g.,Tribovillard et al., 2000), were likely occluded from this environment due to the high redox gradient at seabed.
Interval A in Facies F overlying the E1a1marine band exhibits rela-tively high Sorgcontent yet contains minimal AOMgr (Fig. 2;Table 1). This package is distinctive because the palynological fraction is domi-nated by AOMpel that is coated by fine, microcrystalline pyrite (“AOMpyr”;Plate I, 6). AOMpel in Interval A also contains abundant or-ange, high-relief organic spheres within each particle (Plate III). Rarely, these spheres are also present within AOMgr in Facies G (Interval B;
Fig. 2;Plate III, 6–9).
The spheres exhibit afinely reticulated texture in transmitted light that mimics pyrite framboids (Plate III, 3), and are best observed in
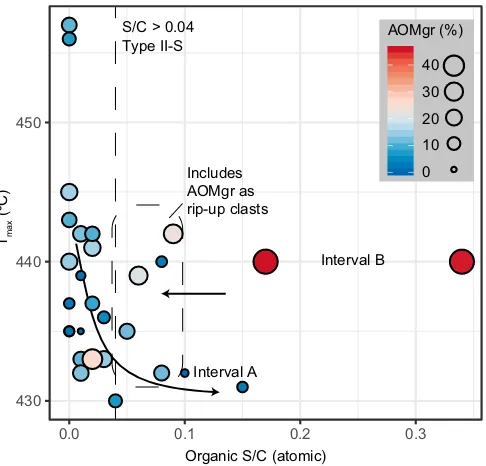
oxidized slides following removal of the microcrystalline pyrite coatings on AOM. In some cases, each sphere contains a single pyrite framboid (Plate III, 1). The diameter of organic spheres in Interval A (Fig. 6) is sim-ilar to pyrite framboids in Facies F (Emmings et al., 2019). The orange color of the organic spheres suggests sulphurized OM (e.g.,Tribovillard et al., 2001), possibly comparable to orange gel-like AOM“drops”(Aycard et al., 2003). AOM sulphurization is consistent with the relatively high Sorgcontent in Interval A. The catalytic effect of S radicals associated with Sorgduring the thermal decomposition of kerogen (Lewan, 1998) may also explain the relatively low Rock-Eval Tmaxthrough Interval A. Tmaxthrough Interval A is approximately 15 °C lower than the adjacent mudstone packages (Figs. 2, 7;Table 1). Such Tmaxinversions are not necessarily diagnostic of Type II-S OM, however, because a similar reduction in Tmaxis observed through the E1c1marine band at Cominco S9 despite very low Sorgcontent (Fig. 3). This suggests Tmaxis also influenced more broadly by OM composition (Type II versus III) and/or mineral matrix effects.
[image:9.595.108.497.53.445.2]Spherefluorescence under green light (Plate III, 5, 7, 9) suggests the presence of aromatic compounds within a moderately polymerized structure (Lin and Davis, 1988), potentially including S heteroatoms such as thiophenes (e.g.,Eglinton et al., 1990). Since AOMgr in Interval B lacksfluorescence under green light and generally lacks Sorg-PF, this Fig. 4.“APP”ternary plot of heregeneous AOM (defined as AOMpyr + AOMpel + AOMgr) versus phytoclasts + homogenous AOM (the latter is typically negligible in samples in this study) versus spores (terrestrial palynomorphs). Fields and interpreted processes are fromTyson (1995). Reprinted/adapted by permission from Springer Nature Customer Service Centre GmbH: Springer Nature, Sedimentary Organic Matter: Organic Facies and Palynofacies by Tyson, R. V. © 1995. SeeFig. 2andEmmings et al. (2019)for sedimentary facies description. Palynofacies abundance data for the Morridge Formation in the Edale Gulf (borehole Karenight 1) and Widmerpool Gulf (borehole Carsington DRC3), fromHennissen et al. (2017), are also plotted for comparison.
suggests most Sorgis present as (non-fluorescing) cross-linked (inter-molecular) S polymers (e.g.,Aizenshtat et al., 1995;Sinninghe Damsté et al., 1989).
The orange spherical texture in AOM is termed“Sorg-PF,”and is com-parable to the texture originally described byLove (1957, 1962). Pyrite framboids are present in all sedimentary facies (Emmings et al., 2019), yet Sorg-PFis only present in interval A, and rarely interval B. Clearly the microenvironment surrounding pyrite framboids within OM promoted sulphurization. Sulphurization of OM requires access to compounds prone to complexation with S (Adam et al., 2000) and available reactive S species in the local microenvironment. O contained within carbonyl groups, in particular, is prone to replacement by reduced S (e.g.,Adam et al., 2000). Carbohydrates are also susceptible to sulphurization (Van Kaam-Peters et al., 1998). Reactive S species include H2S, polysulphides, sulphites, or other S of intermediate oxidation states (Aizenshtat et al., 1995; Amrani, 2014; Amrani and Aizenshtat, 2004; Rickard, 2012; Sinninghe Damsté and Leeuw, 1990b; Wasmund et al., 2017).
Under anoxic conditions,“redox oscillation”between zones of SO4and Fe reduction (sensu.Aller, 1982; Aller, 1998) promotes sulphurization (Aplin and Macquaker, 1993; Filley et al., 2002) via S cycling and therefore generation of reactive S species (e.g.,Wasmund et al., 2017). Redox oscil-lation also enhances oxidation and/or dehydration of low-molecular weight compounds, such as alcohols, producing aldehydes or ketones (i.e., compounds with carbonyl functional groups;Burdige, 2006). These compounds are thought to be particularly susceptible to sulphurization, especially if they contain conjugate double bonds (Adam et al., 2000; Aizenshtat et al., 1995; Amrani, 2014; Grossi et al., 1998; Rontani et al., 1999).
Therefore redox oscillationlocalizedto OM is the best explanation for Sorg-PFformation. This differs from the mechanism of sulphurization under persistently sulphidic (euxinic) conditions (e.g.,Lewan, 1984; Orr, 1986; Hartgers et al., 1997), where H2S potentially reacts directly with OM (Amrani, 2014; Sinninghe Damsté and De Leeuw, 1990a). Under oscillatory redox conditions during early diagenesis, H2S genera-tion via SO4-reducgenera-tion likely proceeded only within the microenviron-ment local to particles of metabolizable OM (e.g.,Burdige, 2006). This is consistent with the presence of pyrite that apparently nucleated on and/or within AOMpel within Interval A (Plate I, 6).
Early diagenetic redox oscillation within Interval A is consistent with the Mo and U andδ34
Spyrecord (Table 1;Fig. 2). Firstly, high Mo relative to U in Interval A (Facies F mean Mo EF ~ 76 ± 86, U EF ~ 8 ± 3) suggests the presence of a relatively weak and unstable water column chemocline and development of “particulate shuttle” conditions (Algeo and Tribovillard, 2009). This contrasts with moderate to high MoandU contents in“marine band”Facies A–C (mean Mo EF ~ 32 ± 39, U EF ~ 11 ± 11), which suggests relatively stable, moderately sulphidic conditions in bottom waters. Secondly, strongly negative (close to–40‰) δ34Spyin Interval A suggests pyrite precipitation under long-lived open-system conditions and/or large S fractionations via intermediate S cycling (e.g.,Nissenbaum et al., 1972; Mossmann et al., 1991; Canfield et al., 1992; Canfield et al., 2010).
H2S that migrated into surrounding porewaters was likely oxidized to produce sulphuric acid (e.g.,Soetaert et al., 2007). This explains the lack of carbonate (Fig. 2), despite the presence of skeletal moulds (Emmings et al., 2019), in Intervals A and B. Therefore the contacts between OM mi-croenvironments and adjacent porewaters exhibited an intermittently high redox-gradient (Fig. 8). This gradient was likely strongest during pe-riods of redoxcline deepening, where porewaters wereflooded by Fe-reducers. S cycling across these micro-redox fronts, local to each framboid, provided the reactive S species required for sulphurization.
Pyrite nucleation within AOM likely formed initially as FeS, via reac-tion with dissolved reduced Fe, sourced via dissimilatory Fe3+reduction or direct reduction of particulate FeOOH by H2S (Fig. 8). FeS subse-quently reacted with H2S and/or polysulphides to produce pyrite (e.g.,Rickard, 2012). Microcrystalline pyrite coatings on OM (Plate I, 6) are therefore interpreted as a relict redox front, defined by reaction of H2S generated local to OM, and Fe3+and/or FeOOH present in the surrounding porewaters.
H2or short polysulphides are products of pyrite precipitation where FeS is the reactant (Soetaert et al., 2007). H2, as a key nutrient, poten-tially stimulated microbial activity (Nissenbaum et al., 1972; Rickard, 2012), which in turn promoted sulphurization local to the pyrite framboids. Thus Sorg-PFformed concomitantly with, or following, pyrite (e.g.,Filley et al., 2002), and are perhaps analogous to“sulphurized biofilms”(MacLean et al., 2008). Microbial oxidization of H2(as a nutri-ent) coupled to dissimilatory elemental S reduction (Aizenshtat et al., 1995; Sinninghe Damsté and De Leeuw, 1990a) also generates reactive S species (e.g., via elemental S or polysulphide-reducing bacteria;Ma et al., 1993;Ma et al., 2000;Wasmund et al., 2017).
Sorg-PFis abundant in Interval A but rare in Interval B (comparePlate III, 2 and 8), perhaps because pyrite framboids are also rare in Interval B (Emmings et al., 2019). This suggests that H2S and/or polysulphide in porewaters seldom attained the critical supersaturation conditions re-quired for framboid nucleation (Ohfuji and Rickard, 2005; Rickard, 2012). Together, this suggests that the steepest redox gradient during deposition of Interval B was located near or at (and parallel to) the sea-bed, likely utilized by microbial mats, and not local to OM. Thus pyrite nucleation and growth in Interval B was uncoupled to sites ofin situ H2S production driven by OM degradation, but instead driven by reac-tion of reduced Fe with upward-diffusing H2S. It is also possible AOMgr, as the dominant type of particulate OM in Interval B, was rela-tively refractory and therefore relarela-tively resistant to hydrolysis and deg-radation by microbes. This limited the production of H2S local to OM required for framboid (and therefore Sorg-PF) growth.
0.4 Oxic Oxic
Facies G: (Sub)oxic Facies A-F:
Anoxic
0.6 0.8 1.0 FeHR/FeT
50 100 Mo (EF)
Oxic
Facies G: (Sub)oxic Facies A-F:
Anoxic
a
[image:10.595.53.263.55.400.2]b
4.3. Controls on organic matter distribution
[image:11.595.75.531.52.505.2]The distribution of key palynofacies categories through the Upper Bowland Shale in the Craven Basin is predictable and linked to changing bottom water redox conditions and changing basin accommodation. Fa-cies A–C muds deposited during marine transgressions (Figs. 2–4,
Table 1) lack Sorg-PFlikely because the redoxcline bounding zones of SO4and Fe reduction wasfixed in the water column during deposition (Fig. 9a). Marine maximum flooding is associated with a high AOMpel/AOMgr and low abundance of spores and phytoclasts.
Intervals A and B overlie“marine band”packages and were therefore likely deposited during sea level fall (Emmings et al., 2019). An en-hanced shelf-to-basin“Fe shuttle”during falling sea level (Lyons and Severmann, 2006) increased the FeHRsupply to the basin (Emmings, 2018). This process promoted buffering of H2S by FeHRvia pyrite forma-tion (including nucleaforma-tion on AOM to generate AOMpyr), weakening and destabilizing the chemocline, stimulating early diagenetic redox Plate III.Sulphurized AOM local to pyrite framboids (Sorg-PF; arrows indicate examples). Scale bars = 50μm. 1–5. Interval A. 1–4. MPA66949 (oxidized slide 4, transmitted light). 5. MPA66949 (oxidized slide 4, incident green light, red lightfiltered). 6–9. Interval B. 6, 8. MPA68139 (oxidized slide 4, transmitted light). 7, 9. (Incident green light, red lightfiltered).
Sorg-PF Diameter (μm) N = 119 MFD = 12.7 μm Mean = 6.0 μm Skewness = 0.50
Frequency (%)
2 4 6 8 10 12
0
2
468
1
0
Fig. 6.Sorg-PFdiameter versus frequency in Interval A (Facies F). N = number of spheres counted, MFD = maximum framboid diameter (Wignall and Newton, 1998).
[image:11.595.48.291.561.716.2]oscillation and triggering Sorg-PFformation (Interval A;Fig. 9b). There-fore Sorg-PFis a proxy for redox oscillation between sulphidic and ferru-ginous anoxic micro-environments during early diagenesis.
Pendle delta progradation during the E1b2biozone triggered eupho-tic zone desalination, which sufficiently reduced the export of autoch-thonous (marine) OM to seabed and therefore promoted bottom water oxygenation (Emmings, 2018). Bottom water ventilation pro-moted colonization of the seabed by sulphide-oxidizing microbial mats (Fig. 9c). Therefore the transition from anoxic (Facies F) to oxic/ suboxic conditions (Facies G) exhibits a“cross-over”between AOMpel and AOMgr (Fig. 2;Table 1). The proportionality of AOMpel and AOMgr may therefore delineate ancient redox fronts at or near seabed. Palynological assessment of AOM types should be coupled with detailed
[image:12.595.40.283.52.285.2]sedimentological characterization, however, in order to determine whether AOMgr particles are present in situ or as rip-up clasts.
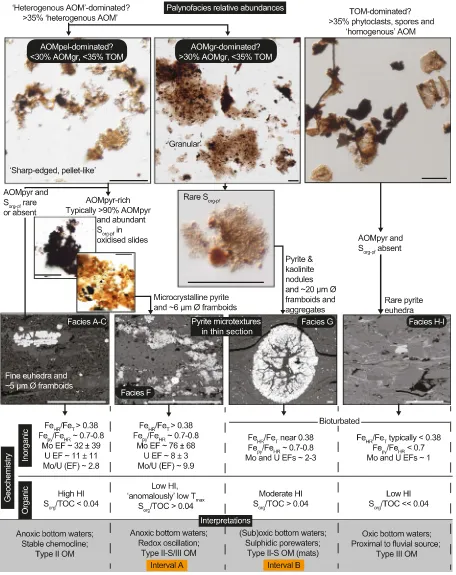
Fig. 10integrates and summarizes observations and interpretations spanning palynology and geochemistry (this study), sedimentology 430
440 450
0.0 0.1 0.2 0.3
Organic S/C (atomic) Interval B
Interval A S/C > 0.04 Type II-S
Includes AOMgr as rip-up clasts
Tmax
(ºC)
0 10 20 30 40 AOMgr (%)
Fig. 7.Rock-Eval pyrolysis Tmaxversus organic S/C, with point size and color mapped to the relative abundance of AOMgr, and with Type II-Sfield (S/CN0.04) fromOrr (1986). Several turbidites, debrites and hybridflow deposits exhibit moderate S/C and contain AOMgr interpreted as rip-up clasts (Emmings et al., 2019). Interval A is possibly positioned at the end of a mixing line defined by the catalytical effect of S radicals during hydrocarbon maturation (Lewan, 1998).
[image:12.595.302.552.52.319.2]Fig. 8.Proposed mechanism for formation of Sorg-PFlocal to pyrite framboids in Interval A (and rarely B), via capture of reactive S species across a local redoxcline between zones of Fe- and SO4-reduction, and/or via microbial reduction of intermediate S species perhaps via H2nutrient loading local to framboids. These conditions are likely favored during early diagenetic redox oscillation under relatively high FeHRloadings. Fe mono-sulphide and pyrite nucleation equations (labeled A and B, respectively) fromSoetaert et al. (2007).
[image:12.595.46.544.533.710.2]and pyrite microtextures described byEmmings (2018)andEmmings et al. (2019). A ternary plot of AOMpel + AOMpyr versus AOMgr versus spores + phytoclasts (Fig. 11) links palynofacies abundances to bottom and pore water redox conditions, water column productivity and prox-imity tofluvial (deltaic) supply of spores and phytoclasts. Field I delin-eates AOMgr-rich samples located in the paralic Widermerpool Gulf
[image:13.595.76.532.53.628.2](Hennissen et al., 2017). Field I is a mixing line between AOMgr and spores and phytoclasts. Lack of AOMpel suggests relatively low produc-tivity water column conditions. Dominance of AOMgr in Field I may in-dicate widespread occurrences of candidate microbial mats existed in these paralic basins, supported by a long-lived, restriction-driven redox gradient near or at seabed. Alternatively, it is possible AOMgr is Fig. 10.Summary of key observations and interpretations spanning palynology and organic geochemistry (this study) and sedimentology (Emmings et al., 2019). Backscattered electron microphotographs are also reported byEmmings (2018). All scale bars = 50μm. Generalized geochemistry includes mean Mo and U EFs with uncertainty quantified as two standard deviations.
generated via multiple pathways; perhaps AOMgr also includes a com-ponent of bacterially modified terrestrial OM (TOM). Field II is interpreted to indicate low to moderate water column productivity, dominantly oxic or suboxic bottom water conditions and sulphidic con-ditions near or at seabed (Figs. 11, 12a). The atomic Sorg/TOC in Field II (Interval B) exceeds 0.04 (Table 1;Fig. 12b), the threshold for definition of Type II-S kerogen (Orr, 1986).
Field III represents moderate to high rates of water column produc-tivity and autochthonous OM export to seabed, linked to anoxic and at least intermittently sulphidic bottom water conditions (Figs. 11;12a). Thisfield includes Type II-S kerogen (Sorg-PF) generated via early diage-netic redox oscillation (Fig. 9b). Sorg-PFexhibits a possible catalytic effect on Tmax(Lewan, 1998). The majority of Bowland Shale samples from the Craven Basin and contemporaneous mudstones from the Edale Gulf (Hennissen et al., 2017) plot within thisfield. This suggests productivity was relatively widespread, and perhaps stimulated by nutrient loading from the nearby Pendle delta system (Figs. 1a,9a–b) (Emmings, 2018). Field V represents oxygenated conditions and/or close proximity to the supply of TOM (Figs. 9, 12a). Facies H–I in Cominco S9, located proximal to the Pendle delta system and deposited during reduced basin accommodation, are sited in thisfield. Thus Field IV likely repre-sents transitional settings defined by fluctuating oxic/suboxic and
anoxic conditions, or significant supply of spores and phytoclasts into anoxic bottom waters (Fig. 11).
The mixing line betweenfields III and V (and therefore through Field IV;Fig. 11) represents increasing proximity tofluvial sources and/or bottom and pore water ventilation that was sufficiently gradual or dif-fuse. This inhibited development of a high redox gradient at seabed. Candidate microbial mats (AOMgr) were unable to colonize seabed in these settings. The mixing line betweenfields III and I represents rapid bottom water ventilation and/or high frequency redoxfluctuation, coupled to persistently stagnant or advective, sulphidic porewaters near seabed. This configuration supported colonization by the candidate mi-crobial mats.
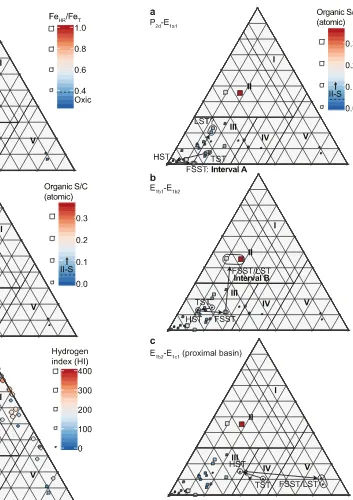
[image:14.595.96.490.54.463.2]Hydrogen index (HI), a key measure for hydrocarbon source rock potential, is highest near Field I and III apices for all immature to early oil-mature data plotted (Fig. 12c; including data fromHennissen et al., 2017). Absence of inorganic geochemical data for Field I precludes as-sessment of the mechanism for high HI in thisfield. However, assuming paralic basins were subject to long-lived and stable redoxclines near seabed, it is plausible these conditions promoted condensation and preservation of relatively labile (aliphatic) OM. High HI in Field III is best explained by enhanced preservation of labile OM under sulphidic bottom water conditions beneath a stable redoxcline.
Changing basin accommodation during deposition of the Bowland Shale is considered at least partially equivalent to eustatic sea level sys-tems tracts (Posamentier et al., 1988). A sequence-stratigraphic control on OM type is important for understanding the link between source rock heterogeneity and timing of hydrocarbon generation and expul-sion from this source rock. The effect of changing sea level for biozones E1a1to E1c1is summarized using the ternary plot of AOMpel + AOMpyr
[image:15.595.62.277.47.603.2]versus AOMgr versus spores + phytoclasts (Fig. 13). Key intervals de-posited during falling sea level contain bulk Type II-S OM, which likely entered the oil window at a relatively low temperature (e.g.,Dembicki, 2009). Understanding the distribution and type of OM is important for exploring this unconventional hydrocarbon resource in the UK (e.g.,Andrews, 2013; Clarke et al., 2018), especially if Type II-S intervals are laterally extensive. The possibility that sulphide-oxidizing microbial mats colonized seabed, and across several basins, suggests nutrient and inorganic S and C cycling in epicontinental Missississippian seaways likely operated in a vastly different way com-pared to modern oceans.
[image:15.595.181.534.48.548.2]Fig. 12.Ternary plot of AOMpel + AOMpyr versus AOMgr versus spores + phytoclasts (seeFig. 11for details), with (a) FeHR/FeT; (b) organic S/C, and; (c) hydrogen index (HI) mapped to each data point. Palynofacies abundance data for the Morridge Formation in the Edale Gulf (borehole Karenight 1) and Widmerpool Gulf (borehole Carsington DRC3), fromHennissen et al. (2017), are also plotted with HI. See text for discussion.
Fig. 13.Ternary plot of AOMpel + AOMpyr versus AOMgr versus spores + phytoclasts (seeFig. 11for details), with organic S/C mapped to each data point and interpreted basin accommodation pathways fromEmmings et al. (2019). Basin accommodation pathways are at least partially equivalent to the eustatic sea level systems tracts of Posamentier et al. (1988). TST = transgressive systems tract; HST = highstand systems tract; FSST = falling stage systems tract; LST = lowstand systems tract.
5. Conclusions
Geochemical and palynological data were integrated through the Upper Bowland Shale unit in the Craven Basin (Lancashire, UK), a basin with ongoing hydrocarbon exploration. Fe-speciation, trace ele-ment geochemistry andδ34S
pyanalyses were utilized in order to assess syngenetic and early diagenetic redox conditions. These data were inte-grated with sedimentological and palynological observations, in order to understand the controls on OM sulphurization and the distribution of AOM.
Particulate OM in the Upper Bowland Shale is dominated by two types of AOM;“homogenous”AOM (AOMpel) and“heterogeneous, granular”AOM (AOMgr). On the basis of textural observations, AOMpel most likely represent the fecal minipellets of zooplankton and/or pellets of macro-zooplankters. On the transition from anoxic to oxic bottom waters, AOMgr replaces AOMpel as the dominant type of AOM (Interval B). A large particle diameter (likelyN500μm), sheet-like, fragmented character, and presence of candidate organic sheaths suggests AOMgr at least partially represent fragments of benthic microbial mats, likely as sulphide-oxidizers.
Abundant orange, high-relief organic spheres are recognized within each AOM particle, particularly in one key interval (A) overlying the E1a1 marine band. These textures are associated with a high Sorgcontent and are therefore interpreted as sulphurized OM local to pyrite framboids (Sorg-PF). Sulphurization is linked to early diagenetic redox oscillation processes. Whilst the precise mechanism for sulphurization is unclear, we propose redox oscillation promoted sulphurization in two ways. Firstly, redox oscillation enhanced the degradation of OM. This pro-duced organic compounds prone to sulphurization. Secondly, redox os-cillation also promoted S cycling across micro-redox fronts local to each framboid. Intermediate, and therefore reactive, S species were thus available for complexation with OM.
Sorg-PFformed primarily under anoxic conditions during periods of reduced sea level (Interval A), via an increased supply of FeHRfrom ad-jacent shelves. An increased supply of FeHRstimulated redox oscillation between ferruginous and euxinic conditions, which promoted acidifi ca-tion of porewaters near seabed. Redox oscillaca-tion was associated with S cycling required to generate reactive S species.
Both intervals A and B exhibit Sorg/TOCN0.04 and are therefore interpreted as Type II-S kerogen. A ternary plot of AOMpel + AOMpyr versus AOMgr versus spores + phytoclasts links the observed palynofacies and sulphurization (intervals A and B) to bottom and pore water redox conditions, water column productivity and proximity tofluvial (deltaic) supply of spores and phytoclasts. These variables were moderated by changing basin accommodation, driven primarily by eustatic sea levelfluctuation. This is important for understanding the link between source rock heterogeneity and timing of hydrocarbon generation and expulsion from this source rock.
Acknowledgements
This study was funded by the Natural Environment Research Council (NERC), [grant no. NE/L002493/1], within the Central England Training Alliance (CENTA). The study also received CASE funding from the British Geological Survey. SWP acknowledges support from a Royal Society Wolfson Research Merit Award. Nick Riley (Carboniferous Ltd) is thanked for sharing biostratigraphic expertise and assistance. Nick Marsh and Tom Knott are thanked for providing assistance during geo-chemical analyses. Jane Flint is thanked for preparation of the palyno-logical slides. BGS authors publish with the approval of the Executive Director of the British Geological Survey.
Appendix A. Supplementary data
Supplementary data to this article can be found online athttps://doi. org/10.1016/j.revpalbo.2019.04.004.
References
Adam, P., Schneckenburger, P., Schaeffer, P., Albrecht, P., 2000.Clues to early diagenetic sulfurization processes from mild chemical cleavage of labile sulfur-rich geomacromolecules. Geochim. Cosmochim. Acta 64 (20), 3485–3503.
Aitkenhead, N., Bridge, D., Riley, N.J., Kimbell, S., 1992.Geology of the Country around Garstang: Memoir for 1:50 000 Sheet 67. HMSO, London.
Aizenshtat, Z., Krein, E.B., Vairavamurthy, M.A., Goldstein, T.P., 1995.Role of Sulfur in the Transformations of Sedimentary Organic Matter: A Mechanistic Overview, Geochem-ical Transformations of Sedimentary Sulfur. ACS Symposium SeriesAmerican Chemi-cal Society, pp. 16–37.
Algeo, T.J., Tribovillard, N., 2009.Environmental analysis of paleoceanographic systems based on molybdenum–uranium covariation. Chem. Geol. 268 (3–4), 211–225. Aller, R.C., 1982.Carbonate dissolution in nearshore terrigenous muds: the role of
physi-cal and biologiphysi-cal reworking. J. Geol. 90 (1), 79–95.
Aller, R.C., 1998.Mobile deltaic and continental shelf muds as suboxic,fluidized bed reac-tors. Mar. Chem. 61 (3), 143–155.
Amrani, A., 2014.Organosulfur compounds: molecular and isotopic evolution from biota to oil and gas. Annu. Rev. Earth Planet. Sci. 42 (1), 733–768.
Amrani, A., Aizenshtat, Z., 2004.Mechanisms of sulfur introduction chemically controlled:
δ34S imprint. Org. Geochem. 35 (11), 1319–1336.
Andrews, I.J., 2013.The Carboniferous Bowland Shale Gas Study: Geology and Resource Estimation. British Geological Survey for Department of Energy and Climate Change. Aplin, A.C., Macquaker, J.H.S., 1993.Quantifying sedimentary geochemical processes - C-S-Fe geochemistry of some modern and ancient anoxic marine muds and mudstones. Phil. Trans. R. Soc. Lond. Ser. A: Phys. Eng. Sci. 344 (1670), 89–100.
Arthurton, R.S., 1984.The Ribblesdale fold belt, NW England—a Dinantian-early Namurian dextral shear zone. Geol. Soc. Lond., Spec. Publ. 14 (1), 131–138.
Aycard, M., et al., 2003.Formation pathways of proto-kerogens in Holocene sediments of the upwelling influenced Cariaco Trench, Venezuela. Org. Geochem. 34 (6), 701–718. Bailey, J.V., Orphan, V.J., Joye, S.B., Corsetti, F.A., 2009.Chemotrophic microbial mats and
their potential for preservation in the rock record. Astrobiology 9 (9), 843–859. Beaumont, K.L., Nash, G.V., Davidson, A.T., 2002.Ultrastructure, morphology andflux of
microzooplankton faecal pellets in an East Antarctic fjord. Mar. Ecol. Prog. Ser. 245, 133–148.
Bisat, W.S., 1923.The carboniferous goniatites of the north of England and their zones. Proc. Yorks. Geol. Soc. 20 (1), 40–124.
Brandon, A., et al., 1998.Geology of the Country around Lancaster: Memoir for 1:50 000 Sheet 59. The Stationary Office, London.
Bruland, K.W., Silver, M.W., 1981.Sinking rates of fecal pellets from gelatinous zooplank-ton (Salps, Pteropods, Doliolids). Mar. Biol. 63 (3), 295–300.
Burdige, D.J., 2006.Geochemistry of Marine Sediments. Princeton University Press, USA. Canfield, D.E., Teske, A., 1996.Late Proterozoic rise in atmospheric oxygen concentration
inferred from phylogenetic and sulphur-isotope studies. Nature 382, 127. Canfield, D.E., Raiswell, R., Westrich, J.T., Reaves, C.M., Berner, R.A., 1986.The use of
chro-mium reduction in the analysis of reduced inorganic sulfur in sediments and shales. Chem. Geol. 54 (1), 149–155.
Canfield, D.E., Raiswell, R., Bottrell, S.H., 1992.The reactivity of sedimentary iron minerals toward sulfide. Am. J. Sci. 292 (9), 659–683.
Canfield, D.E., Farquhar, J., Zerkle, A.L., 2010.High isotope fractionations during sulfate re-duction in a low-sulfate euxinic ocean analog. Geology 38 (5), 415–418.
Catuneanu, O., 2007.Sequence stratigraphic context of microbial mat features. In: Schieber, J., et al. (Eds.), Atlas of microbial mat features preserved within the clastic rock record. Elsevier, pp. 276–283.
Clarke, H., Turner, P., Bustin, R.M., Riley, N., Besly, B., 2018.Shale gas resources of the Bowland Basin, NW England: a holistic study. Pet. Geosci. 24 (3), 287–322. Cuomo, M.C., Chen, Y.Y., 1996.Pellets and epifluorescence. In: Jansonius, J., McGregor, D.
(Eds.), Palynology: Principles and Applications. 1. American Association of Strati-graphic Palynologists Foundation, pp. 1092–1097.
Davies, S.J., 2008.The record of Carboniferous sea-level change in low-latitude sedimen-tary successions from Britain and Ireland during the onset of the late Paleozoic ice age. Geol. Soc. Am. Spec. Pap. 441, 187–204.
Davies, R.J., Austin, R., Moore, D., 1993.Environmental controls of Brigantian conodont-distribution: evidence from the Gayle limestone of the Yoredale Group in Northern England. Ann. Soc. Géol. Belgique 116, 221–241 (Fascicule 2 - Carboniferous biostratigraphy).
Davies, S., Hampson, G., Flint, S., Elliott, T., 1999.Continental-scale sequence stratigraphy of the Namurian, Upper Carboniferous and its applications to reservoir prediction. Geol. Soc., Lond., Petrol. Geol. Conf. Ser. 5, 757–770.
Davydov, V.I., Korn, D., Schmitz, M., 2012.The Carboniferous Period. Geologic Time Scale 2012 2-Volume Set. Elsevier.
Dembicki, H., 2009.Three common source rock evaluation errors made by geologists dur-ing prospect or play appraisals. AAPG Bull. 93 (3), 341–356.
Earp, J.R., 1961.Geology of the Country around Clitheroe and Nelson (One-Inch Geological Sheet 68, New Series). H.M.S.O.
Eglinton, T.I., Sinninghe Damsté, J.S., Kohnen, M.E.L., de Leeuw, J.W., 1990.Rapid estima-tion of the organic sulphur content of kerogens, coals and asphaltenes by pyrolysis-gas chromatography. Fuel 69 (11), 1394–1404.
Emmings, J., 2018.Controls on UK Lower Namurian Shale Gas Prospectivity: Understand-ing the Spatial and Temporal Distribution of Organic Matter in Siliciclastic Mudstones. PhD Thesis. University of Leicester.
Emmings, J., et al., 2017.Stream and slope weathering effects on organic-rich mudstone geochemistry and implications for hydrocarbon source rock assessment: a Bowland Shale case study. Chem. Geol. 471, 74–91.