PATT18 PAPER
Exploring Creativity and Progression in transition through “Assessment
is for learning”
S.V. McLaren, University of Strathclyde, GlasgowProf. K. Stables, Goldsmiths College, University of LondonJ. Bain, Goldsmiths, College, University of London Outline
This paper provides an overview of the aims, methods and findings of the Capability and Progression in Transition through Assessment for Learning in Design and Technology (CAPITTAL-DT) project. This project, funded by Determined to Succeed Scotland, aimed to identify useful approaches to aid progression in creativity through the current initiative entitled ‘Assessment is for learning’ (AifL, SEED, 2002). AifL encourages learners and teachers to engage with assessment for, as, and of learning and adopt a range of strategies and ideas. The project team gathered baseline and follow up data from teachers and learners using questionnaires to gauge attitudes towards creativity, structured conceptual design activities to assess performance, learner evaluations and teacher interviews. The team concludes that there is scope for adopting the tools explored to support formative and sustainable assessment strategies and approaches to gathering meaningful indicators that can be embedded into enterprising teaching and learning for Design and Technology Education.
Introduction/ Background
The National Guidelines for 5-14 Environmental Studies (1993) described for the first time the required learning for Science, Social Subjects, Technology Education, Health Education and Information Communications Technology for children aged from 5years to 14 years old in Scotland. Problems with the implementation in schools, both primary and secondary, led to a review and revision of the guidelines. The revised guidelines Environmental Studies: Society, Science and Technology (LTS, 2000) simplified the language, terminology and clarified the intended purpose of technology education.
Standards and Quality in Primary and Secondary Schools: 1998-2001(HMI 2002)
identified weaknesses in technology, the majority of schools achieving only ‘fair’ or ‘unsatisfactory’. Only a minority of learners’ were found to be skilful in designing and making and had a good understanding of the impact of technology on society. Limited understanding of technological capability (SCCC, 1996) had resulted in a
tendency for the teacher to focus on the production of a product rather than the
thinking skills, creativity, processes, exploration of issues and key learning involved.
Two current initiatives in Scotland ‘Assessment is for learning’ (SEED, 2002) and ‘A Curriculum for Excellence’ (SEED, 2004) contribute towards ‘Ambitious Excellent Schools’ (SEED, 2004) and aim to improve the educational experience and achievement of youngsters. The development of technological capability has a significant role to play within these developments (HMIE, 2004). But there is concern that due to historical reluctance to change and adapt, the potential Technology Education offers learners may not be exploited. (Dakers, 2005)
To date, learning, teaching and assessment methods have all too often distorted the very nature of creativity and innovation and resulted in students ‘jumping through hoops’, taking a highly strategic approach to their work. Hayward, Kane, Cogan (2000) caution against creating assessments that dominate and encourage strategic learning. An example of this in Design and Technology Education is where a ‘design folio’ becomes a product in itself rather than a record of the journey involved in the design thinking (Kimbell et al., 2002). There is evidence (e.g. Atkinson, 2000; Barlex and Welch, 2004; Kimbell, 2002; McCormick and Murphy, 1996; McLaren, 2003) that learners are being asked to follow a template or formulaic approach to designing. This reduces design activity to a series of steps that limit thinking, risk taking, spark generation, development and collaboration and therefore limits learning and rewards ‘playing safe’, leading to what Lave (1988) calls a ‘veneer of accomplishment.’ It also may result in a dependency culture and does not empower learners with sustainable assessment strategies that involve them directly in their own progress. (Black and Wiliam, 1998)
Purpose of the research study
This study aimed specifically at supporting the development of learning and teaching in technology education through focusing on assessment for learning with an emphasis on creativity, targeting learning and teaching at the transition between primary and secondary schools (McLaren et al., 2006; Bain and McLaren 2006; Stables, 2006). The approaches developed, data gathered and subsequent analysis aimed to inform recording and monitoring methods by providing an informative record of performance for individuals and class groups, whilst encouraging a related, reflective personal learning planning process.
The questions framing the exploration were grouped into four aspects:
̇Value and attitudes towards Creativity (teachers and learners);̇Self and peer evaluation;̇Learner progress;̇Relationship between learner attitudes, evaluation and performance.
Research Design
Method
The study involved learners from 7 schools, in two different Scottish local authorities at a time of transition to new class or from primary to secondary. The participants (n=225) were in Primary 6 (10-11years old), primary7 (11-12years old) and secondary 1 students (12-13 years old).
Three categories of research cohorts were created to take a quasi-experimental approach in the 9 month period between baseline and follow-up data collection:
an intervention cohort, where teachers were given support in the development
an in-the-know cohort, where no support was given, but where the teachers were present at all teacher meetings for discussion and explanation of the project; a control cohort, where teachers had no involvement with the project.
Survey Instruments
A dataset of 124 learners was created from those completing all aspects ofthe survey:̇a ‘Learner Attitudes Towards Creativity’ questionnaire; ̇an ‘unpickled portfolio’ type performance activity (Stables & Kimbell, 2000;
Kimbell et al., 2004); ̇a ‘learner evaluation’ questionnaire.
The ‘Attitudes to Creativity’ questionnaire drew on methodology firstdeveloped through PATT research (Raat et al., 1987) and presented a set ofstatements about creativity (e.g. “Creative people can improve other people’slives”, “Being creative is difficult”) which required a response on a 4-pointLikert scale. It also included a free response question -“in your own wordswrite down what creativity, or being creative, means to you”. Teacherscompleted a parallel questionnaire.
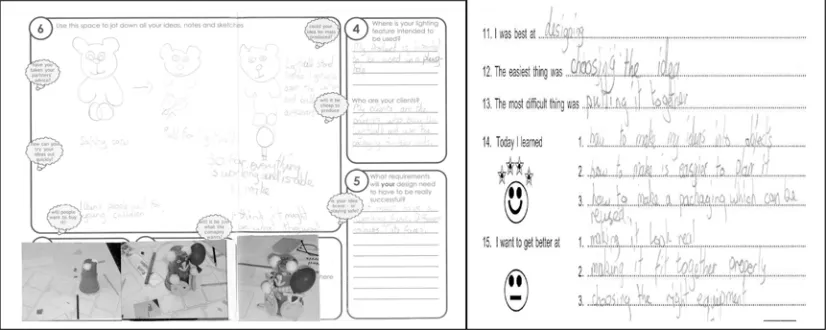
A‘Learner Evaluation’ questionnaire asked the learners to record theiragreement / disagreement with statements (again on a 4-point scale) aboutwhy they liked/disliked the activity and what it had allowed them todemonstrate. To probe further they were asked to note three things they feltthey had learned and three things they would like to get better at. Eachparticipant was prompted by the following stem sentences:̇I
was best at… ̇The easiest thing was…̇The most difficult thing was…̇Today I
learned…̇I want to get better at…
For both questionnaires the scaled responses were analysed quantitatively and the free response and stem sentences were analysed using derived content analysis.
The outcomes of the performance activities were assessed using a rubric that
provided criteria for assessing holistic performance; performance of having ideas; growing ideas (though modelling); growing (optimising, developing, refining, dealing with complexity) and proving (testing, criticality, reflection and thoughtfulness). Each of the qualities was characterised by criteria organised on a four-point continuum, each point then subdivided into low, mid and high, providing a 12-point scale for each quality. The criteria for having ideas is given as an example.
Figure 1: Criteria for having ideas
having ideas eg.explicit lychoosing ariskyt askorexpressing
ariskyidea;dicing ont heedge; suspending
(sparkiness)
l ooking f or s t art ing eg.suspends realit y&t akeonchallenge; point s... running wit hriskyideas t owards unknown,but
risk/ comf ort zone undercaut ious get t ing out s ide convent ional eg.plays at t heedgeofasafet askoridea;
const raint s set s
t hemont hepat ht oachievesomet hing new;dipping t oes in
eg.plays safe;works wit hinexist ingexperience/ realit y/ repert oire;needs a ‘
The activity booklets also provided evidence of peer support in idea generation and concept development, peer and self-evaluation.
This paper focuses on the relationship between learner attitudes towards creativity, evaluation and performance.
Findings
The base-line and follow-up activities provided a variety of data. Theassessment judgments allowed performance groupings to be created. Thesewere:
̇Consistently high performers;̇Consistently middle performers;̇Consistently low
performers; ̇Those who improved and those whose performance diminished.
Generally, the learners’ attitudes towards creativity did not shift to anysignificant degree over the 9 month duration of the project. The data indicatesthat although most learners thought that ‘being allowed to be creative is morefun’ only 50% of the sample group agreed that ‘projects where you have tofollow instructions are boring’. The majority (94%) agreed that ‘you can learnto be creative’ and that ‘everybody can be creative in their own way’ (98%).However, a significant majority (71%) agreed that high marks can be obtained
in technology education without being creative. This was echoed in the responses from the teacher survey. The teachers and learners were of differing opinions when considering whether creative people break rules. Initially only 19% of the learners thought creative people break rules, rising to 32% on follow up questionnaire to learners. Whereas 92% of the teacher sample indicated they believed creative people break rules.
However, further analysis indicated that there was a difference in thinking between the ‘high performers’ and the other learners in this, and a range of other, aspects, these ‘high performers’ often having similar responses of the teachers. (Stables, 2006)
Illustrative samples of learner profiles
The learners were required to record peer and self evaluation comments at specific stages during the activities. To identify trends and patterns in responses, comments were grouped and compared using the performance categories identified above.
Consistently low performers were typically limited in their comments to their peers and to themselves. Most frequently used phrases included, ‘I like what I have done’,‘I thought it was good’,‘It’s a good idea’ ,‘ok’,‘It was good it turned out well’,‘I think I
could do better…’ By contrast, high performers tended to relate comments to
process, quality and design issues of function and intended market. For example, in
Activity 1, learner no.07/02/45/7 identified the strengths ‘I think I have managed to
children and has a safety catch.’ The learner was also able to identify weaknesses and wrote, ‘I would try to improve its safety make it all the same colour scheme.’
Figure 2.sample from Activity 1 booklet and accompanying learner evaluation
The comments of improved learners tend to show a deeper level of reflection on their own work and that of others in activity 2 and when compared to activity 1. This
critique included issues of quality of their model; usability/practicality of the design idea; aspects of process of thinking, planning and taking action. For example,
learner01/01/12 acknowledged the most difficult thing in activity 1 was ‘commenting
on others’ and there was evidence that this learner attempted to improve the
comments written to self and others in activity 2. This learner also changed in terms of their perception of creativity from something that gives ‘a better chance of passing test’ to meaning ‘thinking up and putting an idea forward’, and ‘making things out of your ideas.’
Likewise, learner 07/02/16/7 acknowledged the most difficult thing in activity 1 was ‘answering and commenting’. Improvement was evident in activity 2 where the
comments to self and to others consider the idea in terms of the user and purpose of the design.
Improved learner + strengths - weaknesses
To self 07/02/16/7 Act 1 I think it was an alright idea. I think I could have done better
Act 2 It’s a good idea with the sticking to your jacket
It needs improvement e.g. stronger
07/02/16/7 to 07/02/45/7
[image:5.595.101.517.81.246.2]Act 2 I like the way it won’t get in your way It will be hard to get to
Figure 4.Sample statements from Activity booklets 1 & 2 by improved learner
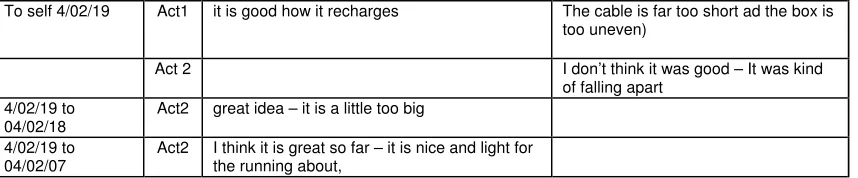
A sample profile of a learner who displayed a drop in performance is illustrated below (figure 5). As noted in the accompanying learner evaluation (activity 1) learner no. 4/02/19 wanted to get better at ‘evaluating’, and learned ‘how to help others and work as a team’. After
activity 2, he acknowledges ‘I was not very good at coming up with ideas’ and ‘not
very good at making models’. He thought he was best at ‘commenting on other
people’s work’.
Drop in performance
To self 4/02/19 Act1 it is good how it recharges The cable is far too short ad the box is too uneven)
Act 2 I don’t think it was good – It was kind
of falling apart 4/02/19 to
04/02/18
Act2 great idea – it is a little too big
4/02/19 to 04/02/07
[image:6.595.80.509.34.123.2]Act2 I think it is great so far – it is nice and light for the running about,
Figure 5. Sample statements from Activity booklets 1 & 2 by learner
The post activity learner evaluations indicated similar trends in the focus of
responses and in learners’ self-awareness.
Profiles of consistently high performers indicated these learners evaluate using a greater variety of factors than lower performers and have a higher awareness of their
own strengths and weaknesses. Words such as ‘thinking’, ‘choosing’, ‘designing’,
‘planning’ feature more frequently in their learner evaluations. For example, learner
07/02/35/7 identifies that the most difficult aspect is ‘thinking about what to make’
(Activity 1) and again ‘thinking how you would make it’ (Activity 2). She has learned
she ‘can think of good ideas (and indeed she scored a 7 in ‘having’ Activity 2) Her
targets include ‘thinking up more things’ and ‘getting good ideas.’
This contrasts with consistently low performers who tend to be less aware of their own learning and set targets related to modeling rather than nuanced statements about quality, thinking, choosing and planning, for example. Typical low performer statements can be exemplified by ‘doing the modelling’;‘using the glue gun’;‘cutting the paper’ ;‘cutting out’;‘sticking’; ‘making’. Generally there was very little difference
in any of their comments prompted by the evaluation i.e. best at, easiest, most
difficult, learned and want to get better at.
For improving performers there is not much evidence to indicate a high level of maturity or self-awareness in the words recorded. However, the comments did
display glimpses of reflection and becoming meta-cognitive, e.g. ‘thinking what I
should do better’;‘thinking up my ideas and planning them’; ‘thinking of ideas’;‘sorting things out’. Interestingly learners in this performance group commonly wrote words that implied:
caution and / or low self esteem e.g. ‘I am not very good at this’ ;‘I am not very good at planning’ ; ‘difficult to think what to do’;
surprise at what they had achieved or learned about themselves e.g. ‘I was
good at making models’ ;‘I can think up ideas’; ‘that you can have many good ideas but not know it’;‘that sometimes I can be good at things’; ‘I can help other people with my idea’.
Learners whose performance dropped in Activity 2 tended to have made little effort to evaluate and record what they wanted to get better at, showed little interest and often indicted a level of low self esteem and lack of motivation. Target setting in terms of ‘I want to get better at…’ was related to making, if anything was noted at all.
For example, Learner 06/01/25 in Activity 1 was best at ‘designing things’ and
learned ‘how I enjoyed it so much’. This altered in Activity 2 where aspects of
making, cutting, sticking and gluing became the focus for what she thought she was best at and what she had learner. The most difficult thing was the noted as being the
same as that which she identified as wanting to get better at ‘trying not to get
burned’.
profiles of consistently high and consistently low performers, those who improved and those whose performance dropped. There were more consistently high performers and ‘improvers’ in the intervention groups and more consistently low performers and drops in performance in the control groups.
Discussion
This study illustrated that many learners, particularly the high achievers, are indeed
aware of their own strengths and weaknesses. The target setting, ‘I want to get
better at’ was completed by the majority of the learners relative to what they thought had been easy, best and most difficult and this is borne out as being highly relevant when examined in the context of their performance scores.
Low achievers seem far more unaware of their learning and as a result target setting remains very focussed on modelling related aspects. Whilst being less able to recognise the complexity of the various aspects involved in designing, many of the targets do show a continued willingness to learn and a desire to develop their skills. This ought to be exploited further and indicates potential in terms of achievement, if not attainment, to be recognised and celebrated as in keeping with the principles and capacities of ‘A Curriculum for Excellence’ (SEED, 2004).
At no time during the test activities, nor during any of the intervention sessions, did a learner ask what mark they were getting or how the work was being assessed by the teacher. There were many opportunities to make comments to self, to others, and to receive comments from others and this may have superseded the need for feedback from teacher at this time. Engagement in creativity appears to have a positive correlation with intrinsic motivation and the learners, particularly high and improving performers, displayed a good level of self efficacy. (Bandura, 1977; Lepper et al., 1973)
In addition to performance being judged holistically and in aspects of having, growing
and proving, Design and Technology domain specific basic knowledge, domain
specific design knowledge and general process knowledge/transferable knowledge
and skills (Christiaans and Venselaar 2005) were tracked. This indicated further potential for the approach to allow both learners and teachers clearer insights into personal learning needs for progression that could be utilised in personal learning planning processes (LTS, 2004) and meaningful target setting.
In summary
The learners …
The learners were generally motivated by the performance assessment activities and sustained engagement for the duration of the task. Comments offered by learners indicate an enthusiasm and the improvement in performance for the majority of the learners may be part due to novelty since ‘successful learning takes place when pupils are highly motivated, interest and curiosity is aroused’ (HMIE, 2000). The activities met a wide variety of learning preferences and styles through the range of approaches and sub-task types, and resources and yet were tightly structured through sub-task and time ‘milestones’ (Cross, et al.1996). The opportunity to engage with 3D sketch modeling was a key element to maintaining engagement.
The teachers …
The interviews with the teachers involved in the project revealed a willingness to adopt some of the underpinning concepts of the ‘unpickled portfolio’ approach. It was thought that the experience illustrated the potential to move away from a linear design approach ‘formula’ whilst providing a clear framework for design activity. The approach taken for the assessment of performance activities 1 and 2, and any intervention, contrasted with strategies more commonly used which are based on teacher demonstration with learners doing as teacher had shown.
Teacher no.01/01 was ‘surprised that the pupils didn’t question more’. Teacher no.
02/07 intends to ‘deviate from insisting everything should be written down’ and noted
that the learners ‘loved all of it -they were very focussed and concentred for long
spells’. The experience has provided the confidence to allow her to let her pupils do D&T - especially 3D modelling.
Although some of the teachers were familiar with learner self evaluation of product outcomes, showing and inviting peer comment on initial design concepts and models at interim stages was a new strategy and was received positively. The teachers recognised that more work was needed to develop the vocabulary and skills of peer support related to design thinking and felt that this would be of value. Teachers acknowledged that their current assessment strategies, if indeed in existence, were more heavily weighted towards the practical outcome and less towards process and designing. The use of photos taken and logged at various junctures of the work as ongoing was also novel for the teachers and was an approach which most felt would be easily integrated and would be worthwhile. They recognised that the ‘unpickled portfolio’ has potential to be adapted and developed to create further learning opportunities.
Many personal qualities were demonstrated by the learners e.g. recognising the need for creativity and perseverance, supporting others, self -realisation of having achieved success and having a ‘can do’ attitude. Through the learner’s own attitudinal comments, this study illustrates that Design and Technology has the potential to foster personal qualities, attitudes and dispositions, particularly those pertaining to enterprising thinking and creativity which are valued as central to citizenship in the 21st century (Kimbell and Perry, 2001; SEED, S004).
(3,450 words)
Atkinson, S., (2000) Does the need for high levels of performance curtail the
development of creativity in design and technology project work? International
Journal of Technology and Design Education 10(3): 255-281.
Bain, J., & McLaren, S. (2006) Sustainable Assessment: exploring a learner centred approach in practice. TERC 2006: Values in Technology Education Gold Coast, Australia.
Bandura, A. (1977) Social Learning Theory. Englewood Cliffs, NJ: Prentice
Hall
Barlex, D. & Welch, M. ( 2004) Portfolios in Design and Technology
Education: Investigating different views in E.W.L.Norman, D. Spendlove, P. Grover, A. Mitchell Data International Conference 193-197
Black, P. & Wiliam, D. (1998) Inside the Black Box: Raising standards through
classroom assessment London: Kings College
Boud, D., (2000) Sustainable assessment: rethinking assessment for the learning society, Studies in Continuing Education, 22(2): 151-176
Christiaans, H., & Venselaar, K. (2005). Creativity in design engineering and
the role of knowledge: modelling the expert. International Journal of Technology
and Design Education, 15(3), 217 - 236.
Dakers, J. (2005) Technology Education in Scotland: an Investigation of the
past twenty years J. Dakers & M. de Vries PATT15 Twenty Years
Retrospective International Conference on Design and Technology Education, Eindhoven accessed www.iteaconnect.org 04/01/07
Cross, N., Christiaans, H., & Dorst, K. (eds.) (1996) Analysing Design Activity, John Wiley & Sons, Chichester, UK
Fox-Turnbull, W. (2006) The Influences of Teachers knowledge and authentic
formative assessment on Student learning in Technology Education International
Journal of Technology and Design Education, 16( ), 141-159
5-14 National Guidelines (1993) Environmental Studies SOED Dundee SCCC
5-14 National Guidelines (2000) Environmental Studies: Society, Science and
Technology Learning and Teaching Scotland
HMIe (10th Sept 2004) Good Practice Conference: Primary Technology
Education Northern College, Aberdeen University
HMIE (2000) Effective learning and teaching in Scottish secondary schools: technical
education Edinburgh : Scottish Executive
HMIE (2002) Standards and Quality in Primary and Secondary Schools:
1998-2001 HMI
Hayward, L., Kane, J. and Cogan, N. (2000) Improving Assessment In
and 5-14
Harlen, W. Holroyd, C. & Byrne, M. (1995) Confidence and understanding in
teaching science and technology in primary schools Edinburgh: SCRE
Harlen, W. (1997) Confidence rising slowly: primary teachers' feelings about
science and technology Edinburgh: Scottish Council for Research in
Education
Jones, A & Compton, V. (1998) Towards a model for teacher development in
technology education: research to practice International Journal of
Technology and Design Education 8 (1) 51-65
Kimbell, R. (2002) Assessing design innovation. A paper commissioned by the
Design and Technology Association and the Engineering Council
Kimbell, R. & Perry D. (2001) Design and Technology in a knowledge
economy Engineering Council
Kimbell, R., Stables, K. & Sprake, J. (2002) Designers in action: an evaluation
of the impact of the Design Museum workshop series. Journal of Design and
Technology Education, 7 (2), 101-107.
Lave, J. (1988) Cognition in practice: Mind Mathematics in Everyday Life New York:
Cambridge University Press
Lepper, M. P., & Greene, D., & Nisbett, R. E. (1997) Undermining children's intrinsic interest with extrinsic reward: A test of the "overjustification" hypothesis. Journal of Personality and Social Psychology, 28, 129-137.
Learning and Teaching Scotland (2004) Personal Learning planning: a
framework for development
www.ltscotland.org.uk/assess/images/plpframework_tcm4-168238.pdf
accessed 21/08/2006
McCormick, R. & Murphy P. (1996) Problem solving and the tyranny of
product outcomes. Journal of Design and Technology Education,1(3), 230-
241.
McLaren, S.V. (2003) Designing Can be Fun! or why Scottish Technology is
failing to meet the national priority (eds.) J. Dakers & M. de Vries PATT13 International Conference on Design and Technology Education, Glasgow 1-5
McLaren, S. V., Stables, K. and Bain, J. (2006) Creativity and Progression in
transition through Assessment for Learning in Design and Technology
Education (CAPITTAL-DT): A pilot project Report to Determined to Succeed
Division, University of Strathclyde
Ritchie, R. (2001) Primary design and technology: a process for learning London : David Fulton
Stables, K., & Kimbell, R. (2000).The unpickled portfolio: Pioneering performance
assessment in design and technology. In R. Kimbell (Ed.) Design and Technology
International Millennium Conference (pp. 195-202). Wellesbourne: DATA.
Stables, K. (2006) Valuing creativity: the perceptions of learners and teachers
and how these relate to performance. TERC 2006: Values in Technology
Education Gold Coast, Australia.
Scottish CCC (1996) Technology Education in Scottish Schools Dundee
SEED(2002)Assessment is for Learning
www.ltscotland.org.uk/assess/index.asp
SEED (2004) A Curriculum for Excellence: The Curriculum Review Group Purposes
and principles of Education 3-18
www.scotland.gov.uk/Publications/2004/11/20178/45862
SEED (2004) Ambitious Excellent Schools: Our Agenda for Action