Does intangible capital affect economic growth?
CEPS Working Document No. 335/September 2010
Felix Roth and Anna-Elisabeth Thum
Abstract
Using new international comparable data on intangible capital investment by business within a panel analysis from 1995-2005 in an EU-15 country sample, we detect a positive and significant relationship between intangible capital investment by business and labour productivity growth. This relationship is cross-sectional in nature and proves to be robust to a range of alterations. Our empirical analysis confirms previous findings that the inclusion of business intangible capital investment into the asset boundary of the national accounting framework increases the rate of change of output per worker more rapidly. In addition, intangible capital is able to explain a significant portion of the unexplained international variance in labour productivity growth and when incorporating business intangibles, capital deepening becomes an even more significant source of growth. The relationship is slightly stronger in the time period 1995-2000 and seems to be driven by the coordinated countries within the EU-15.
CEPS Working Documents are intended to give an indication of work being conducted within CEPS research programmes and to stimulate reactions from other experts in the field. Unless otherwise indicated, the views expressed are attributable only to the authors in a personal capacity and not to any institution with which they are associated.
ISBN 978-94-6138-046-3
Contents
1. Introduction ... 1
2. Theoretical links between business intangible capital and labour productivity growth ... 2
3. Previous empirical results... 4
4. Model specification, research design and data ... 9
4.1 Model specification... 9
4.2 Research design and data... 10
5. Descriptive analysis... 12
6. Econometric analysis... 16
6.1 Growth regressions ... 16
6.2 Dynamic panel analysis ... 19
6.3 Sensitivity analysis ... 21
7. Conclusion... 22
References ... 24
Appendices Appendix 1. Descriptive statistics (1995-2005 EU-15 mean values)………...28
Appendix 2. Theoretical reasoning for core and control variables... 29
Appendix 3. Detailed description of the construction of the business intangible capital variables... 31
| 1
D
OES INTANGIBLE CAPITAL AFFECT ECONOMIC GROWTH
?
CEPS WORKING DOCUMENT NO. 335/SEPTEMBER 2010
F
ELIXR
OTH ANDA
NNA-E
LISABETHT
HUM*1. Introduction
As highly developed economies are transforming more and more into knowledge economies, the input of intangible capital has become vital for the future competitiveness of their economies (Corrado, Hulten and Sichel 2005; World Bank 2006), as well as the competitiveness of their firms (Teece 1998, Youndt, Subramaniam and Snell 2004; Subramaniam and Youndt 2005; Lev and Radhakrishnan 2003 and 2005; Eustace 2000: 6). Although a further refinement of the concept of intangible capital is still clearly needed, the overall measurement of the different dimensions of intangible capital has largely improved and past commentaries, which have called into question the possibility of measuring certain dimensions of intangible capital, seem to have been too pessimistic.1 Nevertheless, it remains an open question which range of intangible capital indicators should be incorporated into the asset boundary (Sen, Fitoussi and Stiglitz 2009) and which dimensions should be included in a definition of intangible capital (World Bank 2006).
This paper focuses on intangible capital investment by business. Using international comparable data on business intangible capital investment generated within the INNODRIVE project, the paper tries to shed first econometric evidence on the impact of investments in business
* Dr. Felix Roth, Centre for European Policy Studies, Place du Congrès 1, 1000 Brussels, Belgium and
Ibero-Amerika Institut, Oecinomicum II/99, Platz der Göttinger Sieben 3, 37073 Göttingen, Germany; Anna-Elisabeth Thum, Centre for European Policy Studies, Place du Congrès 1, 1000 Brussels, Belgium and European University Institute, Department of Economics, Via della Piazzuola 43, 50133 Firenze, Italy; E-mail: felix.roth@ceps.eu
The authors are grateful for a grant from the European Commission under the Seventh Framework Programme for the INNODRIVE project (Intangible Capital and Innovations: Drivers of Growth and Location in the EU, contract number 214576). This paper was produced as the CEPS Deliverable in WP9 and as part of the Seventh Framework Programme FP SSH 2007 1. We would also like to thank Massimiliano Iommi, Cecilia Jona-Lasinio and Stefano Manzocchi for their contribution of the variables on intangible capital.
1 As recently as 1999, Robert Solow criticises the introduction of the term ‘social capital’ into the
discipline of economics, by highlighting that “the term capital stands for a stock of produced or natural
factors of production that can be expected to yield productive services for some time”. He continues to state that: “Originally, anyone who talked about capital had in mind a stock of tangible [highlighted by
the author], solid, often durable things such as buildings, machinery, and inventories” (Solow 1999: 6). Ten years and one financial crisis later, the concept of intangible capital (including social and human
capital) seems to have found its way into the economic discipline. The pure fact that the European Commission has financed three projects in the first round of its FP7 research grants on intangible capital and three more projects in the second round of its FP7 research grant underlines the new attention paid to the concept of intangible capital in economics. Other than the notion of social capital, intangible capital
defines itself exactly as not being tangible. Hence, the term intangible capital seems to offer an umbrella
term for all those capital forms that are theoretically important for productivity but are not tangible in
nature. A very similar definition is used in the World Bank (2006) book entitled Where is the wealth of nations? in which the authors use intangible capital as an umbrella term for human capital, the skills and
intangible capital on labour productivity growth. As envisaged in the INNODRIVE framework (Jona-Lasinio, Iommi and Roth 2009), the dimensions of business intangible capital were generated along the framework originally proposed by Corrado, Hulten and Sichel (2005 and 2006). However, as the authors deeply share the view of the World Bank (2006), that the dimensions of human and social capital should also be classified as intangible capital, the dimension of human capital has been included in the core model of the paper and the concept of social capital within the control variables.
2.
Theoretical links between business intangible capital and labour
productivity growth
It is widely recognised that knowledge and intellectual capital are major determinants of the generation of innovation and thus the enhancement of growth, employment and competitiveness of the European Union. The importance of Business Enterprise Research & Development (BERD) and innovation was explicitly recognised in the ‘Lisbon process’ and has been adopted by the European 2020 strategy for smart, sustainable and inclusive growth (European Commission 2010). Although the importance of business investment in Research and Development has already been widely acknowledged – by policy makers and in economic theory – our knowledge of the contribution of business intangibles to labour productivity growth is still incomplete.
Economic theory has not completely discarded the importance of innovation. Actually, the inclusion of technological progress in models of economic growth started already with the Solow (1956) model, which is based on a production function with technological progress entering multiplicatively and as a constant. Later technological progress was allowed to grow over time, which implied different conclusions than the basic Solow model. In a further step technological progress was endogenised as in the Romer (1990) model. This theoretical model takes account of the fact that technological progress is driven by innovation and inventions by highly educated people. Endogenous growth models were further developed by Rebelo (1991), Grossman and Helpman (1991, 1994) and Aghion and Howitt (1992). However, in the empirical applications of these models technological change usually enters in these models econometrically as the error term and is not accounted for by an explicit empirical measure. Generating a wider concept for innovation and focusing on the issue of a possible revision of the national accounting framework, Corrado, Hulten and Sichel (2005) have grouped the various items that constitute the knowledge of the firm into three basic categories: i) computerised information, ii) innovative property and iii) economic competencies. Whereas computerised information is embedded in computer programmes and computerised databases, innovative property reflects the scientific knowledge embedded in patents, licenses and general know-how (Corrado, Hulten and Sichel 2005: 26). Corrado, Hulten and Sichel (2005: 28) define the economic competencies category of intangibles as “the value of brand names and other knowledge embedded in firm-specific human and structural resources”. It comprises expenditures on advertising, market research, firm-specific human capital and organisational change. These measures indicate that the potential of intangible capital for stimulating productivity growth lies in the provision of knowledge, an increase in the selling potential of a product and the development of processes and a productive environment for the actual physical production of a good, or as Corrado, Hao, Hulten and van Ark (2009: 63) stress, that products and services are becoming more knowledge-intensive.
dimensions of economic competencies, namely brand names, firm-specific human capital and organisational capital. Stressing why the single intangible capital dimensions should be accounted as gross fixed capital investment, has already been elaborated upon by Jona-Lasinio, Iommi and Roth (2009).2 Further theoretical reasoning why the single dimensions of business intangible capital investments contribute to labour productivity growth can be given as follows. In theory, Brand Names should positively affect labour productivity growth since an important
aspect of today’s products is the ‘image’ attached to them. Cañibano, Garcia-Ayuso and Sanchez (2000) argue that the ownership of a brand that is attractive to customers allows a seller to obtain a higher margin for goods or services that are similar to those provided by competitors. The authors refer to an analysis of Comanor and Wilson (1967) who were the first to provide early evidence on the usefulness of advertising. Not only does advertising strengthen the brand equity of a firm or customer loyalty, but it also has a positive effect on future stock performance and impacts positively actual and potential customers. In other words, expenditure on advertising is intended to create a perceived ‘image’ of the firm in the minds of potential consumers. As the consumer’s choice among the products of competing firms is often driven by a perception of reliability and trustworthiness, the development of this image or brand has to be considered key in the yield of future benefits. Expenditure on market research constitutes, next to expenditure on advertising, an important part of the investment in brand equity. Both investments in advertising and market research comply with the four principles of categorising gross fixed capital formation, as can be seen in Appendix 4.
Firm-specific human capital
Firm-specific human capital is another important asset of a firm. In accordance with the findings of Huselid (1999) or Hand (1998), a firm with more capable employees is likely to earn higher profits than competitors whose workers have lower capabilities for the development of the tasks involved in the activity carried out by the firm (Cañibano, Garcia-Ayuso and Sanchez 2000). Thus, the value of companies will increase if the quality of their human resources increases (see also Abowd 2005).
Organisational capital
In addition to the ‘image’ projected by a firm or a product and the quality of the training of workers, the management of a production process involving highly technological physical capital has also become important. As goods become more and more sophisticated, production processes are becoming more complex and the organisational capital of a firm becomes crucial. Lev and Radhakrishnan (2005: 75) define organisational capital as “an agglomeration of technologies – business practices, processes and designs, and incentive and compensation systems – that together enable some firms to consistently and efficiently extract from a given level of physical and human resources a higher value of product than other firms find possible to attain”. Organisational capital is seen by many scholars (Teece, 1998; Youndt, Subramaniam and Snell 2004; Subramaniam and Youndt 2005; Lev and Radhakrishnan 2003 and 2005) as the only competitive asset truly owned by a firm, while the others are tradable and thus available for
2 The expenditures as GFCF were classified according to the following principles: i) if the asset is
every firm that wants to invest in them (information technologies and human capital). Leana and van Buren (2000) come up with the very interesting notion of organisational social capital and argue that the erosion of organisational social capital is diametrically opposed to the long-term competitiveness of the US and the long-term stability of individuals and society as a whole. They put forward three different aspects why low organisational capital might hamper a firm’s output: i) employees are more committed to their particular work than to the organisations for which they work, ii) flexible work organisation might be harder to achieve and iii) organisations are less able to solve collective action problems.
3. Previous
empirical
results
In the World Bank book entitled Where is the wealth of nations? Measuring Capital for the 21st century, researchers come to the conclusion that 78% of the world’s wealth is due to intangible
capital (World Bank 2006: 24). Their results vary between developing and developed countries. Whereas in developing nations intangible capital is only responsible for 59% of the wealth, in OECD (high-income) countries the intangible capital share is 80%.
There are several empirical studies that try to estimate the importance of intangible assets for economic growth. Two different types of methodologies are currently used in the empirical literature on the relationship between intangible capital and growth. One group of researchers uses growth accounting3 to incorporate measures of intangible capital into a growth model, while another group follows a more econometric path and employs growth regressions. Growth accounting yields estimates that indicate how much of the growth of a dependent variable is explained by the various independent variables. Additionally the reduction in unexplained variance when adding a certain independent variable can be determined. In contrast to the growth accounting exercise, the regression technique can be used in a cross-country context and non-monetary indicators such as policy variables may be included.
There is an extensive growth accounting literature studying intangible capital investment both on the micro (firm-level) and on the macro (national) level. Sichel (2008) shows that one of the most recent approaches to measure intangible capital is to measure the difference between a firm’s market value and its tangible assets. Several micro studies by Brynjolfsson and Yang (1999) and by Brynjolfsson, Hitt and Yang (2002) follow this approach to analyse the relation between intangible investment and computers in the US. Webster (2000) adopts a similar approach using Australian micro data and finds that the ratio of intangible to total capital rose by 1.25% a year from 1948 to 1998. Another definition is employed by Cummins (2005) who defines intangible capital in terms of adjustment costs and uses US firm-level data to estimate these costs. Lev and Radhakrishnan (2005) construct yet another measure of intangible capital using “sales, general and administrative expenses” as a proxy for organisational capital.
As this analysis conducts a cross-section and panel analysis taking the EU-15 countries as units of observations, it is particularly interested in analyses at the macroeconomic level.
In the first instance, there are several papers that measure the size of intangible capital stock as a percentage of GDP. Table 1 shows the most prominent results. Corrado, Hulten and Sichel (2005) find for the United States that the investment in intangibles was 12% of GDP between 1998 and 2000. Giorgio Marrano and Haskel (2006) show that in the United Kingdom the private sector spent a sum equivalent to 11% of GDP on intangibles in 20044. Jalava, Aulin-Ahmavaara and Alenen (2007) find that the Finnish investment in intangibles was 9.1% of GDP
3 See for example Barro and Sala-i-Martin (2004), chapter 10.
4 Giorgio Marrano, Haskel and Wallis (2007) estimate that expenditure on intangibles amounts to 14% of
in 2005. Fukao, Hamagata, Miyagawa and Tonogi (2007) estimate 7.5% of GDP as invested in intangible capital in Japan in 1995-2002. Hao, Manole and van Ark (2008) study the spending as a share of GDP on intangible capital for Germany, France, Italy and Spain and find that Italy and Spain invested 5.2%, Germany 7.1% and France 8.8%. Van Rooijen, van den Bergen and Tanriseven (2008) find 10% for the Netherlands in 2001-2004. Edquist (2009) follows a similar approach and finds that in Sweden total spending on intangibles was equivalent to 10.6 % of GDP in 2004. Nakamura (2010) estimates spending in the United States from 1959 to 2007 and finds that investment in intangible capital is as important as investment in tangibles in the US.
Table 1. Results on the importance of spending on intangibles
Corrado,Hulten, Sichel (2005)
Marrano,Haskel (2006)
Jalava, Aulin-Ahmavaara,
Alanen (2007)
Fukao, Hamagata, Miyagawa, Tonogi (2007)
Hao,Manole, van Ark
(2008)
van Rooijen-Horsten, van den Bergen, Tanriseven
(2008)
Edquist (2009)
Nakamura (2009)
Year 2003* 2004 2005 1995-2002 2004 2001-2004 2004 1959-2007
Countries
studied USA UK FIN JAP D,FR,I,ES NL SE USA
Dependent
variable % of GDP % of GDP % of GDP % of GDP % of GDP % of GDP % of GDP % of GDP
Spending on intangible capital as %
of GDP
12.1% 10.1% 9.1% 7.5%
7.1% in D, 8.8% in FR,
5.2% in I,5.2% in ES
10.0% 10.6%
as important
as investment in tangible
assets
*Corrado, Hulten and Sichel (2005) report the number from 1998-2000. Hao, Manole and van Ark (2008) requested the estimate for 2003 from them.
Table 2. Results in the growth accounting literature Corrado, Hulten, Sichel (2006) Marrano, Haskel, Wallis (2007) Jalava, Aulin-Ahmavaara, Alanen (2007) Fukao, Hamagata, Miyagawa, Tonogi (2007)
Hao, Manole, van Ark (2008) Corrado, Hao, Hulten, van Ark (2009) Corrado, Hao, Hulten, van Ark (2009) Corrado, Hao, Hulten, van Ark (2009) Corrado, Hao, Hulten, van Ark (2009) Corrado, Hao, Hulten, van Ark (2009) Period studied 1973-1995; 1995-2003 1979-1995; 1995-2003 1975-2000; 2000-2005 1980-1990;
1990-2002 1995-2003 1995-2006 1995-2006 1995-2006 1995-2006 1995-2006
Countries studied USA USA & UK FIN JAP D,F,I,ES USA UK F D
D,F,I,ES,AT, DK
Dependent variable
Labour productivity growth in the nonfarm business
sector
Annual change in labour productivity
in the nonfarm business sector
Labour productivity growth in the
non-financial business sector
Growth rate of GDP
Growth of labour productivity in the
market sector
Labour productivity growth in the market sector
Labour productivity growth in the market sector
Labour productivity growth in the market sector
Labour productivity growth in the market sector
Labour productivity growth in the market sector
% of dependent variable accounted
for by intangible capital deepening
26% in 1973-1995, 27% in 1995-2003
26% in 1979-1995,27% in 1995-2003 in the US,15%
in 1979-1995,20% in 1995-2003 in the
US
16% in 1995-2000, 30% in 2000-2005
11% in 1980-1990, 40% in 1990-2002
31% in D,37% in F,59% in I,64% in
ES
28% 23% 24% 21% 22%
Percentage points of dependent variable accounted for by intangible capital
deepening
0.43 in 1973-1995, 0.84 in 1995-2003
0.43 in 1979-1995, 0.84 in 1995-2003 in the US; 0.44 in 1979-1995,0.60 in 1995-2003 in the
UK
0.64 in 1995-2000, 0.84 in 2000-2005
0.43 in 1980-1990, 0.45 in
1990-2002
0.9 in F,0.6 in D,
0.4 in I, 0.2 in ES 0.83 0.69 0.48 0.38 0.3
Increase in growth by adding intangible capital to the asset
boundary
20% in 1973-1995, 11% in 1995-2003
20% in 1973-1995, 11% in 1995-2003; 11% in 1973-1995, 13% in 1995-2003
in the UK
13% in 1995-2000, 2% in 1995-2005
3% in 1980-1990, 7% in 1990-2002
10% in D, 14% in F,37% in I,40% in
ES
7% 6% 9% 12% 12%
Decrease in the importance of
multifactor productivity when
adding intangible capital deepening
Declines from 51% to 35% in
1995-2003
Declines from 51% to 35% in 1995-2003 in the US and from 22% to 16% in
1995-2003 in the UK
Declines from 59% to 42% in
1995-2005
Declines from 21% to 15% in 1980-1990 and from 10% to -5%
in 1990-2002
Declines from 38% to 21% in D, from 44% to 23%
in F
Declines from 64% to 45%
Declines from 53% to 40%
Declines from 48% to 35%
Declines from 61% to 49%
Hao, Manole and van Ark (2008) study Germany, France, Italy and Spain for the period 1995-2003. They find that intangible capital deepening accounts for 31% of labour productivity growth in Germany, 37% in France, 59% in Italy and 64% in Spain. Growth increases by 10% in Germany, 14% in France, 37% in Italy and 40% in Spain. In some quite recent work, Corrado, Hao, Hulten and Van Ark (2009) conduct a growth accounting exercise for several countries independently for 1995-2006, including the United States and selected EU-27 countries and on average over EU-15 countries. Similar to the findings of Corrado, Hulten and Sichel (2006) Corrado, Hao, Hulten and Van Ark (2009) find that intangible capital accounts for 28% of labour market productivity growth in the US. In the European countries intangible capital seems to be slightly less important than in the US, as their results shown in Table 1 indicate. In Germany, France, Italy, Spain, Austria and Denmark, intangible capital accounts for about 22% of labour productivity growth. All recent growth accounting studies find a positive effect of intangible capital on various measures of economic growth in different countries and for different time periods.
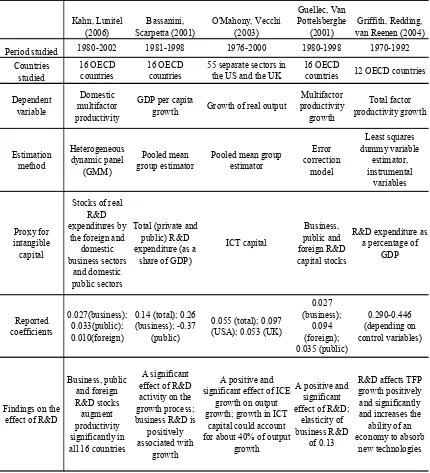
Third, we also found a vast body of empirical literature studying the relationship between R&D and economic growth using the growth regression approach. Most growth regression results, as shown in Table 3, also provide evidence of a positive effect of R&D on economic growth. There are studies on the micro or firm level as well as macro studies examining the country level. In our study we focus on the latter. Lichtenberg (1993) was the first to show empirically that R&D drives productivity at the aggregate or national level in addition to the firm and industry levels. He showed this by means of a 53-country cross-section regression. He finds that the elasticity of output with respect to private R&D is roughly 7% or about 1/3 as large as the elasticity of output with respect to physical capital. Indeed, the estimated social or national rate of return to private R&D is some seven times as large as the return to investment from physical capital. Coe and Helpman (1995) show the extent to which a country’s productivity depends on domestic and foreign R&D capital stocks. Using pooled macroeconomic data for 21 OECD
countries plus Israel over the period 1971-90, their results show that there is a close relationship between productivity and R&D capital stocks both domestic and foreign. Specifically, they show that the elasticity of total factor productivity with respect to domestic R&D, G7 domestic R&D, and foreign R&D is 0.073, 0.159 and 0.273, respectively. Coe and Helpman conclude that the estimated R&D spillover elasticities are large. Their study is significant in that it was one of the first to show empirically that a country’s total factor productivity depends on its own R&D capital stock and the R&D capital stock of its trade partners.
communication technology (ICT) capital as a measure of innovation. They find a positive and significant effect of ICT capital on growth of real output.
Table 3. Recent results for R&D or innovation and economic growth in cross-country growth regressions Kahn, Lunitel (2006) Bassanini, Scarpetta (2001) O'Mahony, Vecchi (2003) Guellec, Van Pottelsberghe (2001) Griffith, Redding, van Reenen (2004)
Period studied 1980-2002 1981-1998 1976-2000 1980-1998 1970-1992
Countries studied 16 OECD countries 16 OECD countries
55 separate sectors in the US and the UK
16 OECD
countries 12 OECD countries
Dependent variable
Domestic multifactor productivity
GDP per capita
growth Growth of real output
Multifactor productivity growth Total factor productivity growth Estimation method Heterogeneous dynamic panel (GMM) Pooled mean group estimator
Pooled mean group estimator Error correction model Least squares dummy variable estimator, instrumental variables Proxy for intangible capital
Stocks of real R&D expenditures by
the foreign and domestic business sectors
and domestic public sectors
Total (private and public) R&D expenditure (as a
share of GDP)
ICT capital
Business, public and foreign R&D capital stocks
R&D expenditure as a percentage of
GDP Reported coefficients 0.027(business); 0.033(public); 0.010(foreign)
0.14 (total); 0.26 (business); -0.37
(public)
0.055 (total); 0.097 (USA); 0.053 (UK)
0.027 (business); 0.094 (foreign); 0.035 (public) 0.290-0.446 (depending on control variables)
Findings on the effect of R&D
Business, public and foreign R&D stocks augment productivity significantly in all 16 countries
A significant effect of R&D activity on the growth process; business R&D is
positively associated with
growth
A positive and significant effect of ICE
growth on output growth; growth in ICT
capital could account for about 40% of output
growth
A positive and significant effect of R&D;
elasticity of business R&D
of 0.13
R&D affects TFP growth positively and significantly and increases the
ability of an economy to absorb
new technologies
negative effect on growth. Guellec and Van Pottelsberghe (2001) also study a sample of 16 OECD countries but use yet another estimation method. They find the same positive and significant coefficient for business and public R&D expenditure but a slightly larger effect of foreign R&D on multifactor productivity growth.
Griffith, Redding and van Reenen (2004) study a two-fold effect of R&D on total factor productivity – firstly, the direct effect of R&D on total factor productivity and secondly the potential of R&D to increase the ability of an economy to absorb new technologies. Their sample includes only 12 OECD countries and the time period is slightly shorter. The measure they use for R&D is R&D expenditure as a percentage of GDP. To estimate their model the authors use a least squares dummy variable estimator and find a larger effect than the previously mentioned authors.
This section has revised both previous empirical results from the growth accounting literature, as well as the growth regression literature. Both methodological approaches find a positive effect of intangible capital and R&D expenditure on economic growth. The following analysis will combine the two methodologies and use a novel international comparable dataset on business investments in intangible capital for the EU-15 area.
4. Model
specification,
research design and data
4.1 Model
specification
Our model specification takes into account both alternative methodologies to study the determinants of growth: growth regressions and growth accounting. The classical workhorse cross-country growth regression model has been developed by Mankiw, Romer and Weil (1992). This model is specified in terms of investment shares, which overcomes the difficulty of finding capital stock data. The assumption that all countries are in their steady state enables this specification. Barro (1991) proposed a more informal growth regression approach, in which the inclusion of variables is determined by previous findings. These models can be interpreted in terms of the Mankiw, Romer and Weil (1992) model since they typically include investment shares and initial income.5
Growth accounting models, on the other hand, are specified in terms of stock data or estimates of stock data. In this model specification the change in output is expressed in terms of changes in inputs. It is an empirical methodology in which the observed GDP growth is broken down into changes in factor inputs and in production technology. Growth accounting has several drawbacks with respect to growth regressions: firstly, it does not allow exploiting cross-country variation, which could be useful information for understanding the determinants of growth. Secondly, it does not aim to explain what determines growth and is seen more as a preliminary step towards a more fundamental analysis of the determinants of growth (see here Barro and Sala-i-Martin (2004): 433; Temple 1999: 121).
Benhabib and Spiegel (1994) and Temple (1999) propose a different model, which Temple calls “cross-country growth accounting” or “growth accounting with externalities”. This model combines both the growth accounting and the growth regression approach. In fact, the equation to be estimated is the same as the growth accounting equation but it is estimated using various methods of regression analysis. This methodology allows exploiting the cross-country variation in contrast to the growth accounting exercise.
We specify a model following Benhabib and Spiegel (1994) and extend it by including intangible capital and several other control variables. In our baseline model, labour productivity (GDP per hours worked) is dependent upon four input factors: physical capital Kit, human capital Hit, intangible capital Iit and hours worked Nit.The starting point for our estimation is a Cobb-Douglas production function, Yit = AKαit Hβit Nγit. If we take log differences, the annual growth relationship can be expressed as:
Δ
lnY
it=
Δ
A
it+
αΔ
lnK
it+
βΔ
lnH
it+
γΔ
lnI
it+
δΔ
lnN
it (1)Specifying equation (1) in terms of an econometric model yields:
Δ
lnY
it=
α
0+
αΔ
lnK
it+
βΔ
lnH
it+
γΔ
lnI
it+
δΔ
lnN
it+ w
it (2)where change in technological progress ΔAitcan be expressed as α0 + wit.
We follow Benhabib and Spiegel (1994)6 in their specification including also a lagged income term and in using the log of human capital levels. As mentioned above, since we are working with annual growth data rather than long term growth rates we need to add a control for business cycle fluctuations Bit (Guellec and van Pottelsberghe 2001). We add several ancillary variables Xit. A precise explanation for the theoretical reasoning behind which core and control variables were taken can be found in Appendix 2.
Following and trying to incorporate the growth accounting approach of Corrado, Hulten and Sichel (2006), we include intangible capital investment in the asset boundary and therefore also in the GDP variable. We denote this new GDP variable by Y*it.
The model we estimate then takes the form:
Δ
lnY*
it=
α
0-
η
Y
it-1+
αΔ
lnK
it+
β
lnH
it+
γΔ
lnI
it+
δΔ
lnN
it+
μ
B
it+
λ
X
it+ w
it (3)4.2 Research design and data
Our analysis covers all 15 EU-15 countries for a time period from 1995-2005 with the overall number of observations being 150. The country sample is restricted to an EU-15 country sample and to a time period from 1995 to 2005 as it was not possible to extrapolate in the 12 new member states the investment in intangible capital far enough to validly construct stocks of business intangible capital. The fact that this was only possible for the 15 EU-15 countries determines our choice of only 15 countries. To estimate the best possible model, our data for our econometric analysis were taken from the various different data sources described below.
• Data on intangible capital were taken from the macro approach of the INNODRIVE project (Jona-Lasinio, Iommi Roth 2009). A detailed explanation of the data construction can be found in Appendix 3. Data on intangible capital investment and intangible capital stock cover solely the business investments for the sectors c-k + o. Our measure of business intangible capital includes R&D activities, product development in the financial service industry7, market research, advertising, firm-specific human capital and organisational structure (own and purchased component).8 As the available data are given
6 See section 4 “Growth accounting with human capital stocks entering into productivity” in Benhabib
and Spiegel (1994).
7 In the light of the financial crisis it has become more doubtful whether it is feasible to treat the product
development in the financial service industry as a valid intangible capital input.
8 The final construction and merging of all intangible capital components, as well as the construction of
in 1995 prices, in order to normalise the variable to 2000 prices we divide the intangible capital measure by the price deflator with base prices of 1995 and multiply by the price deflator with base prices of 2000.9 The measure of intangible capital is adjusted by the purchasing power parity in 2000.
• The only database that would allow us to construct productivity data on a sectoral level would be EUKLEMS, but it misses important data on the capital stock for the five countries France, Belgium, Luxembourg, the Netherlands and Greece. However, a preliminary country sample for a cross-section analysis with a European country sample should, at a minimum, hold information on an EU-15 country sample. We have therefore chosen to utilise the annual macroeconomic database of the European Commission’s Directorate General for Economic and Financial Affairs (DG ECFIN), the AMECO dataset,10 which contains information on capital stocks of all EU-15 countries. Furthermore, as this data cover the whole economy, the important policy-relevant question can be answered in how far business investment in intangible capital affects overall labour productivity growth in an economy. Annual labour productivity growth Y*it is specified as the growth of Gross Domestic Product per hour worked, adjusted by the purchasing power parity in 2000 and the 2000-based price deflator. The GDP measure already includes the intangible capital investment in mineral exploration, computer software and entertainment and literary or artistic originals. The physical capital indicator Kit is specified as the capital stock to which we applied the 2000-based price deflator as well as the 2000-based purchasing power parity.
• Human capitalis measured as the “percentage of population who attained at least upper secondary education”, which is taken as a proxy for the inherent stock of human capital. This data are provided by Eurostat.
• Data on total hours worked were taken from DG ECFIN’s AMECO database.
• Since we use annual data on growth we need to control for the business cycle influence. We include a proxy variable specified as 1-unemployment. This proxy is included as one of the ancillary variables Xit in the model.
• The data on the stocks of inward FDI, the stock market capitalisation, inflation, income taxes, government expenditure, education expenditure and social expenditure are taken from Eurostat.
• The data on openness to trade is retrieved from the Penn World Tables 6.2.
• The variables government efficiency and political stability are taken from Kaufmann, Kraay and Mastruzzi (2008). The World Bank (2006) uses these indicators as proxies for trust. Trust is a form of social capital. We therefore see the inclusion of these variables as adding a further measure of intangible capital to the model.
LUISS and CEPS contributed to the data in the macroeconomic part of the study. The Innodrive team is especially grateful to LUISS researchers Massimiliano Iommi and Cecilia Jona-Lasino for their efforts to validate the macroeconomic data.
9 We use the price deflator for Gross Fixed Capital Formation available from the AMECO database.
10 One has to remark however that this research design comes with the price that tangible and intangible
5. Descriptive
analysis
Table A.1 in the Appendix shows the descriptive statistics of our data. The table shows the means over the EU-15 countries and over the time period 1995-2005. Annual labour productivity growth increases by 0.13 percentage points or by 6.7% when taking into account the contribution of intangibles in the measure of GDP. This number is comparable to the numbers reported by the studies listed in Table 2, which find that productivity growth increases by 12% in Germany, France, Italy, Spain, Austria and Denmark when adding intangible capital to the asset boundary. The reason why our number is smaller is that it measures the contribution of intangibles to the whole economy and not only to the business sector.
The descriptive results also show that the intangible capital stock grows on average at a faster rate than the physical capital stock. The growth rate of the intangible capital stock is 4.94, whereas the growth rate of the physical capital stock is 2.59. The mean physical capital stock is worth €1,582 million which is larger than the average intangible capital stock which is worth €64 million.
[image:14.595.87.511.447.636.2]Business intangible capital investments differ strongly across the EU-15 countries. As shown in Figure 1, Luxembourg clearly outperforms the other European countries with a share of its investment in business intangible capital (which is mainly due to the development in new financial products) being 0.14 of GDP.11 Luxembourg is followed by Sweden, Belgium and UK, all of which have a high level of intangible capital stock at around 6%.12 The four Mediterranean countries Portugal, Italy, Spain and Greece are situated at the four last positions in the distribution. The largest European economy – Germany - is positioned in the middle of the distribution.
Figure 1. Level of intangible capital investmentin the EU-15 countries, as a percentage of NEWGDP, 1995-2005
0 0.02 0.04 0.06 0.08 0.1 0.12 0.14
gr es pt it ie dk at de fi fr nl uk be se lu
Note: The measure of intangible capital investment does not include data on ICT since ICT is already
included in the GDP measure from the AMECO database.
Source: INNODRIVE database.
11 The measure of GDP includes intangibles in the asset boundary.
12 The levels of business intangible investment rates are lower than in Table 1 because it is the investment
Figure 2 shows the average level of intangible capital stock from 1995 to 2005. Luxembourg again leads the distribution and is again followed by Sweden. Germany is positioned in third place. It has a better position in terms of business intangible capital stocks than it does in average investments from 1995-2005. Again the bottom part of the distribution is occupied by the four Mediterranean countries plus Ireland.
Figure 2. Level of intangible capital stockin the EU-15 countries, as a percentage of NEWGDP, 1995-2005 (normalised to a 100 scale)
0 10 20 30 40 50 60 70 80 90 100
gr es pt ie it dk at fi nl fr be uk de se lu
Source: INNODRIVE database.
[image:15.595.89.496.545.734.2]Figure 3 shows the growth rates of our measure of labour productivity. As outlined above and following the approach proposed by Corrado, Hulten and Sichel (2006), this measure already includes intangible capital investment. Ireland grows fastest followed by Greece at nearly 4%. This is surprising in the light of the previous findings that Greece occupies the lowest position in terms of intangible capital. Luxembourg holds the third position followed by Sweden, Finland and the UK. Germany and France are about in the middle of the distribution. Again Mediterranean countries – namely Italy and Spain, hold the lowest positions on the distribution, with growth rates lower than 1%.
Figure 3. Growth rates of new labour productivity (GDP over hours worked, including intangible capital investment) in the EU-15 countries, average 1995 – 2005
0 1 2 3 4 5
es it dk be at nl de fr pt uk fi se lu gr ie
Figure 4 shows a partial regression plot between intangible capital deepening and labour productivity growth as specified in regression 2 (see Table 5). The graph clarifies that the growth of the stock of intangible capital is quite closely associated with the growth of labour productivity across the pooled country observations. The graph already visualises that the relationship will remain stable even with the exclusion of Luxembourg or any other country case.
Figure 4. Partial regression plot between intangible capital deepening and labour productivity growth – pooled cross-section estimation for the EU-15 countries
it be lu es fr esit nl de dk nl de uk it fr de ie fr se nl nl fr dk dk at nl uk nl it nl it uk atat nldk be uk es ukuk dk uk pt nlfr pt ukfr se it es dk pt be es nl uk it dk be dk be se de fr de lu esit ie gr espt at pt dk pt uk gr gr de fr esde at fr it se pt at esbe se es de pt lu de at gr be
dkgrlu fr at se se gr se ie de grie sese be at gr gr atfi fi fi fi ie be be lu fi fi ie lu fi it fi pt ie fi pt ie lu gr fi ie lu ie lu lu -2 0 2 4 6 La b o u r P rod uc ti v it y G row th
-5 0 5 10
Growth of Intangible Capital Deepening coef = .31160131, (robust) se = .05447419, t = 5.72
Figure 5. Partial regression plot between intangible capital deepening and labour productivity growth – fixed effects estimation for the EU-15 countries
lu ie be lu itie es se fr es lu de dept it dk atgr at de gr be pt
frptit uk fr gr at dkie nl dk fr be ptlu be uk gr se fiit se se be nl ie fiuk fi pt lu at pt se nl dk nlnl nlfiesat
fi de fi be uk dk gr uk gr nl it pt de esgr uk fi it fr uk dk fr ie gr eses fi uk dk at dk nl it esde ie uk de gr at pt se fi nl frat sefi es se fr be es dk se se it ukde fr it ie at nlde lu be lu ie at lu deesdk
pt fr ie be lu beie pt gr it lu -4 -2 0 2 4 La bo ur P rod uc ti v it y G row th
-5 0 5
Growth of Intangible Capital Deepening
coef = .17548271, (robust) se = .07677419, t = 2.29
Figure 6. Partial regression plot between total capital deepening and labour productivity growth – pooled cross-section estimation for the EU-15 countries
it es dknl be dkit it dk nl ie esse be uk itit nl nl nlfr nlnl fr dk nl pt dk nl uk deuk uk fr es at at uk fr uk fr lu at be es dk bededk
gr pt nl de dk itse uk es de be se it pt uk esgr es se be at fr es ie uk pt pt dk at fr itfrse it de uk pt fr de gr de grlu esat at atseptdk
ie gr at be deie lu se gr se es fi pt se de at be de fi fifilu gr fr pt fi gr fi
fibese
fi fi gr it ie ie lu lu fi ie pt be lu lu ie ie ie lu gr lu -4 -2 0 2 4 La bo ur P rod uc ti v it y G row th
-5 0 5 10
Growth of Total Capital Deepening
coef = .39374123, (robust) se = .05309987, t = 7.42
6. Econometric
analysis
6.1 Growth
regressions
[image:18.595.92.487.139.429.2]Table 4. Intangible capital and labour productivity growth – alternative estimation techniques
Estimation Method OLS OLS FE FE RE RE
(1) (2) (3) (4) (5) (6)
Lagged Labour Productivitya -2.641*** -1.569*** -8.938*** -10.32*** -2.882** -1.752
(0.575) (0.578) (2.844) (2.887) (1.262) (1.068)
Growth of Hours Worked -0.586*** -0.693*** -0.694*** -0.691*** -0.681*** -0.706***
(0.0988) (0.0847) (0.104) (0.0773) (0.0945) (0.0922)
Education 2.639*** 1.948*** 1.769 1.626 2.256*** 1.903***
(0.419) (0.425) (1.582) (1.179) (0.779) (0.649)
Growth of Physical Capital Stock 0.891*** 0.605*** 0.607 0.645** 0.661*** 0.581***
(0.125) (0.141) (0.350) (0.282) (0.171) (0.191)
Growth of Intangible Capital Stock 0.290*** 0.190* 0.237***
(0.0528) (0.107) (0.0707)
Proxy Business Cycle -6.137* -10.06*** -22.71** -26.80*** -14.47** -14.01***
(3.343) (3.083) (9.762) (7.617) (6.408) (5.123)
Constant 3.290 6.676** 45.34** 54.46*** 15.55** 12.10**
(3.168) (2.777) (16.12) (10.06) (6.820) (4.951)
Observations 150 150 150 150 150 150
R-squaredb 0.513 0.602 0.613 0.604 0.416 0.5749
Time effects yes yes yes yes yes yes
Number of countries 15 15 15 15 15 15
a Labour productivity augmented by investment in intangible capital if intangible capital stock included in the regression.
*** p<0.01, ** p<0.05, * p<0.1
b
The reported values for R squared are the overall value for the OLS and RE estimators and the within value for FE estimator. Note: Robust standard errors are given in parentheses.
Regression 2 shows the results when including intangible capital into the asset boundary. The effect of conditional convergence becomes smaller (which already indicates that the input of intangible capital seems to be more important in the richer, more advanced EU-15 economies), the labour input gains some impact, the effect of education and physical capital becomes weaker and the growth of intangible capital stock is positively associated with labour productivity growth. The coefficient can be interpreted as follows: a 1% growth of intangible capital stock is associated with a 0.29 percentage points increase of labour productivity growth. The model is now able to explain 60% of variance, thus 9% more than when intangible capital is not included. Regression 3 shows a fixed-effects model when estimating a traditional growth model and taking only the tangible capital into account. We detect conditional convergence and a negative coefficient for the labour input. In model (4), growth of intangible capital stocks is incorporated. Intangible capital is positively related to labour productivity growth at the 90% significance-level. As can be easily referred from Figure 5, this positive relationship is mainly driven by the case of Luxembourg and once it is excluded from the analysed country sample, the relationship between intangible capital and productivity growth becomes insignificant. Thus one should conclude that an increase in the growth of intangible capital is not associated with an increase of labour productivity growth when considering only the within-country effect. Regressions 5 and 6 utilise a random effects model. Similarly to the OLS model, the regressions depict the cross-sectional effect13 of intangible capital and labour productivity growth. As the between R-Squared value is significantly higher than the within R-R-Squared value there is some evidence
13 To put it correctly the random effects estimator is a combination of a within- and a between-estimator.
that the model explains the between-country variation in labour productivity growth better than the within-country variation. The coefficient of 0.237 is slightly smaller than in the OLS model. In this model specification, the inclusion of intangible capital is now able to explain 12% more of the international variance within labour productivity growth.
Table 5. Intangible capital deepening and labour productivity growth
Estimation Method OLS OLS FE FE RE RE
(1) (2) (3) (4) (5) (6)
Lagged Labour Productivitya -2.040*** -1.192** -9.344*** -9.628*** -3.227** -1.545
(0.511) (0.543) (2.976) (3.166) (1.319) (1.091)
Education 1.936*** 1.477*** 1.641 1.895 2.379*** 1.658***
(0.332) (0.326) (1.375) (1.408) (0.735) (0.580)
Growth of Capital Deepening 0.662*** 0.438*** 0.683*** 0.525*** 0.679*** 0.488***
(0.0918) (0.0949) (0.130) (0.152) (0.0921) (0.116)
Growth of Intangible Capital Deepening 0.312*** 0.175 0.235***
(0.0545) (0.104) (0.0703)
Proxy business cycle -4.166 -9.440*** -23.54** -25.09*** -16.21*** -13.00***
(3.162) (3.010) (8.104) (6.176) (6.190) (4.792)
Constant 4.338 7.190*** 47.73*** 49.91*** 17.74** 10.40**
(3.016) (2.726) (13.07) (10.89) (7.144) (5.033)
Observations 150 150 150 150 150 150
R-squaredb 0.472 0.587 0.612 0.602 0.4027 0.5607
Time effects yes yes yes yes yes yes
Number of countries 15 15 15 15 15 15
a Labour productivity augmented by investment in intangible capital if intangible capital stock included in the regression.
b The reported values for R squared are the overall value for the OLS and RE estimators and the within value for FE estimator.
*** p<0.01, ** p<0.05, * p<0.1
Note: Robust standard errors are given in parentheses.
Table 6. Total Capital Deepening and Labour Productivity Growth
Estimation Method OLS OLS OLS OLS
(1) (2) (3) (4)
Lagged Labour Productivitya -2.590*** -2.040*** -1.578** -1.578**
(0.699) (0.511) (0.793) (0.605)
Education 1.292*** 1.936*** 0.887** 1.101***
(0.404) (0.332) (0.448) (0.349)
Growth of Capital Deepening 0.662***
(0.0918)
Growth of Total Capital Deepening 0.394***
(0.0531)
Proxy business cycle 5.692 -4.166 8.710** -5.802*
(3.511) (3.162) (3.839) (3.195)
Constant 0.0451 4.338 -4.110 7.624**
(3.470) (3.016) (3.914) (3.060)
Observations 150 150 150 150
Time effects yes yes yes yes
R-squared 0.252 0.472 0.226 0.509
Number of countries 15 15 15 15
a Labour productivity augmented by investment in intangible capital if intangible capital stock included
in the regression.
*** p<0.01, ** p<0.05, * p<0.1
Note: Robust standard errors are given in parentheses.
6.2 Dynamic panel analysis
Growth regressions usually present several econometric problems. Firstly, the right-hand side variables are usually endogenous. Secondly, the initial level of efficiency is unobserved and correlated with the lagged level of income. This results in an omitted variable bias. To address these issues Arellano and Bond (1991) have developed a –popular and frequently used, estimator using a Generalised Method of Moments methodology, the GMM difference estimator. The idea is to remove the country-specific time-invariant effects by taking first differences, to add a lagged income term and to instrument for the right-hand side variables. The instruments are specified as the levels of the lagged variables. The omitted variable bias stemming from unobserved country-specific effects is addressed by taking first differences, and the problem of endogeneity is addressed by using instruments. Necessary assumptions for this estimator are that the errors are serially uncorrelated and that the instruments do not over-identify the model.14
However, as highlighted by Bond, Hoeffler and Temple (2001), the GMM difference estimator has its own pitfalls, especially in econometric cross-country growth regressions. The authors show that the GMM difference estimator appears to be biased in the growth context. The reason is that the first-differenced estimator behaves poorly if the time series is persistent15 and if the
14 These assumptions are tested automatically in the implemented STATA command by Roodman (2000).
Precisely, an AR(2) test of the error terms and a Sargan or Hansen test of over-identification are implemented.
15 A time series is persistent when its values depend (strongly) on its past values. In this case the series is
time dimension is small. If a time series is persistent, its lagged levels are weak instruments and their use can imply that the parameter estimates are biased in finite samples. According to Bond, Hoeffler and Temple (2001), growth models are usually characterised by a persistent income variable and by a small time dimension. They show that the GMM difference estimator is largely downward biased in their simulations. The estimate should lie between the upward biased OLS estimate and the downward biased fixed-effects estimate. In their simulation the difference estimate lies even below the downward biased fixed effects estimator.
To address these problems of weak instruments and a small time dimension, Bond, Hoeffler and Temple (2001) recommend using a more efficient estimator, the GMM system estimator developed by Arellano and Bover (1995) and Blundell and Bond (1998). This estimator is consistent even if the time series are persistent and has better finite sample properties as their simulations show.
Comparing the results of Tables 5 and 7 shows that the GMM difference estimate of the lagged dependent variable effect is close to the fixed effects estimate when not using time dummies and far below when using time dummies. This observation indicates that we should implement the GMM system estimator especially when working with time dummies. Table 7 shows the results when estimating our model with GMM difference and GMM system methodology. After including intangible capital deepening growth in regressions 2 and 4, we are able to replicate the results of our OLS, and random effects estimation. In contrast to our fixed-effects estimation in Regression 2, we get a positive relationship between intangible capital deepening growth and labour productivity growth. However, after excluding Luxembourg from the sample, the relationship becomes insignificant. The coefficient of intangible capital deepening growth is higher than with our OLS and random effects estimation.
[image:22.595.88.478.461.701.2]In a next step we want to test the robustness of our result in Regression 4 in Table 7.
Table 7. Intangible capital and labour productivity growth – dynamic panel estimation
Estimation Method GMM diff GMM diff GMM sys GMM sys
(1) (2) (3) (4)
Lagged Labour Productivitya -1.127 -13.99 -1.774* -0.654
(7.941) (10.49) (1.037) (0.472)
Education -2.153 -3.425 1.764** 1.189***
(2.403) (2.598) (0.697) (0.449)
Growth of Capital Deepening 0.776*** 0.227* 0.686*** 0.459***
(0.131) (0.122) (0.138) (0.117)
Growth of Intangible Capital Deepening 0.416*** 0.330***
(0.121) (0.0731)
Proxy business cycle -23.60 -2.514 -6.769 -15.08*
(20.42) (33.85) (5.727) (8.224)
Constant 5.485 11.44
(5.702) (7.849)
Observations 135 150 135 150
Time effects yes yes yes yes
Number of countries 15 15 15 15
a Labour productivity augmented by investment in intangible capital if intangible capital
stock included in the regression.
*** p<0.01, ** p<0.05, * p<0.1
6.3 Sensitivity
analysis
[image:23.595.88.509.235.619.2]Table 8 shows a sensitivity analysis of regression 4 in Table 7. The first row, which is titled “none”, depicts the coefficient of intangible capital deepening of regression 4 in Table 7. As can be depicted from Figures 4 and 5 Luxembourg and Ireland could be performing as outliers. Thus in row two of Table 8 we exclude Luxembourg from our sample. The relationship between intangible capital deepening and labour productivity growth becomes smaller with a coefficient of 0.193. But it remains significant at the 95%-level.
Table 8. Sensitivity analysis – the Arellano Bond system estimation
Row Specification Change
Coefficient on Intangible
Capital
Standard
Error Countries Observations
Coefficint on the additional
variable
R squaredb
Influential Cases
(1) None 0.330*** (0.0731) 15 150 - 0.5607
(2) Out Luxemburg 0.193** (0.0965) 14 140 - 0.5071 (3) Out Ireland 0.285*** (0.0837) 14 140 - 0.6421
Restructuring of data
(4) 1995-2000 0.390*** (0.0873) 15 75 - 0.5696 (5) 2001-2005 0.319*** (0.101) 15 75 - 0.6134
Restructuring of Country Sample
(6) Mediterranean 0.0854 (0.138) 4 40 - 0.8939 (7) Coordinated 0.335*** (0.0935) 6 60 - 0.687 (8) Scandinavian -0.0370 (0.181) 3 30 - 0.8058
(9) Liberal -0.273 - 2 20 - 0.9735
Specifications
(9) Stocks of inward FDIa 0.235*** (0.0853) 14 121 0.0164*** 0.6284 (10) Openness to trade 0.255*** (0.0639) 15 135 0.0149*** 0.5231 (11) Stock Market Capitalization in % of GDP 0.291*** (0.0467) 15 139 0.00651** 0.6209 (12) Inflation 0.269*** (0.0565) 15 150 -0.162** 0.6094 (13) Income tax in % of GDP 0.327*** (0.0670) 15 150 0.0104 0.5568 (14) Government Efficiency 0.286** (0.118) 15 105 0.442 0.6294 (15) Political Stability 0.260** (0.127) 15 105 0.977* 0.6265 (16) Government Expenditure in % of GDP 0.254*** (0.0635) 15 150 -0.0710*** 0.5904 (17) Education Expenditure in % of GDP 0.295*** (0.0644) 15 150 -0.0574 0.5602 (18) Social Expenditure in % of GDP 0.214*** (0.0754) 15 149 -0.133*** 0.5981
b The values for R squares are retrieved from a random effects regression (overall R squared). Note: Robust standard errors are given in parentheses.
*** p<0.01, ** p<0.05, * p<0.1 a Data for Belgium is unavailable.
In rows 6-9 we analyse which regime typology within the EU-15 countries might be driving the positive result. Interestingly, it seems that the coordinated countries (Germany, Austria, Belgium, Netherlands, Luxembourg and France) are driving the positive result between intangible capital deepening and labour productivity growth. Once excluding Luxembourg from the coordinated sample, the positive relationship remains highly significant. In the Scandinavian and ‘Liberal’ countries (see Hall and Soskice, 2001), the effect is even negative, although not significant.
Since labour productivity growth might be related to many other determinants of growth, here in particular characteristics of the institutional settings within the single EU-15 economies, rows 9 to 18 include a range of control variables. As the magnitude of the coefficient of the single control variables is also relevant for the European economic policy process we have included it in the table. None of the ten included control variables is able to alter the relationship between business intangible capital deepening and labour productivity growth. Furthermore, none of the additional control variables is able to increase the R-Squared value significantly. Furthermore, we can conclude that stocks of inward FDI, openness to trade, stock market capitalisation in % of GDP are positively related to labour productivity growth when taking our model specification with the EU-15 from 1995 to 2005. Inflation, government expenditure and social expenditure as a % of GDP are negatively related to labour productivity growth. As mentioned above, we use government efficiency and political stability similar to the World Bank approach (2006) as proxies for social capital16. Government efficiency appears to have an insignificant effect, whereas political stability is positively and significantly related to labour productivity growth. Finally, education expenditure is not significantly related to labour productivity growth.
7. Conclusion
Using new international comparable data on business intangible capital investment within a cross-sectional and panel analysis from 1995-2005 in an EU-15 country sample we detect a positive and significant relationship between business investments in intangible capital and overall economic labour productivity growth.
First, this relationship is cross-sectional and proves to be robust to a range of alterations. The relationship is stronger in the time period 1995-2000 and in coordinated countries. The result indicates that a country with a high intangible capital deepening growth rate is associated with a higher labour productivity growth rate.
Second, the relationship does not hold when controlling for country-specific effects, thus an increase of intangible capital deepening in a country is not associated with an increase of labour productivity growth in that country in the given time frame from 1995 to 2005.
Third, our empirical analysis confirms that the inclusion of intangible capital investment into the asset boundary of the national accounting framework implies that the rate of change of output per worker increases more rapidly.
Fourth, our empirical analysis confirms that intangible capital investment is able to explain a significant portion of the unexplained international variance in labour productivity growth, and thus diminishes the unexplained part of labour productivity growth, and hence a measure of our ignorance.
Fifth, our empirical analysis confirms, that when incorporating intangibles into the national accounting framework, capital deepening becomes more important.
16 As shown in Table A.1 in the Appendix, these indicators contain 50 missing values and the time series
In the light of these five points, what main policy conclusions can we draw from our empirical analysis for the European economies? Three main policy conclusions should be drawn from our analysis.
First, measuring innovation by solely focusing on R&D as it is currently proposed in the European 2020 agenda is not valid, and the R&D benchmark measure should be substituted by a wider intangible capital benchmark.
Second, incorporating intangible capital into today’s national accounting framework seems to be necessary as developed economies transition into knowledge societies and thus the significant change of investment from tangible to intangible investment is not acknowledged in today’s national accounting framework. The current accounting framework seems to be flawed as it incorrectly depicts too low levels of capital investment within European economies. In reality European economies’ levels of capital investment are significantly larger once incorporating investment in intangible capital. Thus, policy conclusions based upon investment rates in ‘bricks and mortars’ should be handled with caution.
Third, incorporating a wider dimension of innovation investments seems to be a first important step in revising today’s national accounting framework, in particular when focusing on the business sector.
In addition, a next step seems to involve the wider adaptation of the national accounting framework by environmental, educational, health and social protection to capital.17 Moreover, wider reform of the national accounting framework should be envisaged to achieve a more accurate signalling of real economic performance and allowing developed and emerging countries to strive for sustainable economic growth.
| 24
References
Abowd, J. (2005), “The Relationship Among Human Capital, Productivity and Market Value: Building Up from Micro Evidence”, in C. Corrado, J. Haltiwanger and D. Sichel (eds),
Measuring Capital in the New Economy, Chicago; IL: University of Chicago Press.
Aghion, P. and P. Howitt (1992), “A Model of Growth through Creative Destruction”,
Econometrica, Vol. 60, pp. 323-351.
Arellano, M. and S. Bond (1991), “Some tests of specification for panel data: Monte Carlo evidence and an application to employment equations”, Review of Economic Studies, Vol.
58, pp. 277-297.
Arellano, M. and O. Bover (1995), “Another look at the instrumental variable estimation of error-components models”, Journal of Econometrics, Vol. 68, pp. 29-51.
Bassanini, A. and S. Scarpetta (2002), “Does human capital matter for growth in OECD countries? A pooled mean-group approach”, Economic Letters, Vol. 74, No. 3, pp.
399-405.
Barro, R. (1991), “Economic Growth in a Cross Section of Countries”, The Quarterly Journal of Economics, 106 (2), pp. 407-443.
Barro, R. and X. Sala-i-Martin (2004), Economic Growth, 2nd edition, Cambridge, MA: MIT
Press.
Benhabib, J. and M. Spiegel (1994), “The role of human capital in economic development – evidence from aggregate cross-country data”, Journal of Monetary Economics, Vol. 34,
pp. 143-173.
Blundell, R. and S. Bond (1998), “Initial conditions and moment restrictions in dynamic panel data models”, Journal of Econometrics, Vol. 87, pp. 115-143.
Bond, S., A. Hoeffler and J. Temple (2001), GMM Estimation of Empirical Growth Models,
CEPR Discussion Paper No. 3048, Centre for Economic Policy Research, London.
Brynjolfsson, E. and S. Yang (1999), “The Intangible Costs and Benefits of Computer Investments: Evidence from the Financial Market”, paper presented at the International Conference on Information Systems, Atlanta, Georgia, December 1997, revised May 1999.
Brynjolfsson, E., L.M. Hitt and S. Yang (2002), “Intangible Assets: Computers and Organizational Capital”, Brookings Papers on Economic Activity, 2002-1, Brookings
Institution, Washington, D.C., pp. 137-181.
Cañibano, L., M. Garcia-Ayuso and P. Sanchez (2000), “Accounting for Intangibles: A Literature Review”, Journal of Accounting Literature, Vol. 19, pp. 102-130.
Coe, D. and E. Helpman (1995), International R&D Spillovers, NBER Working Paper No.
4444, National Bureau of Economic Research, Cambridge, MA.
Comanor, W.S. and T.A. Wilson (1967), “Advertising, market structure and performance”,
Review of Economics and Statistics, Vol. 49, pp. 423-440.
Corrado, C., C. Hulten and D. Sichel (2005), “Measuring Capital and Technology: An expanded framework”, in C. Corrado, J. Haltiwanger and D. Sichel (eds), Measuring Capital in the New Economy, National Bureau of Economic Research, Studies in Income and Wealth,
Corrado, C., C. Hulten and D. Sichel (2006), Intangible Capital and Economic Growth, NBER
Working Paper No. 11948, National Bureau of Economic Research, Cambridge, MA.
Corrado, C., J.X. Hao, C. Hulten and B. van Ark (2009), “Measuring intangible capital and its contribution to economic growth in Europe”, European Investment Bank Papers, Vol. 14,
No. 1, pp. 63-93.
Cummins, J. (2005), “A new approach to the valuation of intangible capital”, in C. Corrado, J. Haltiwanger and D. Sichel (eds), Measuring Capital in the New Economy, National
Bureau of Economic Research, Studies in Income and Wealth, Vol. 65, Chicago: University Chicago Press, pp. 47-72.
Edquist, H. (2009), How much does Sweden invest in intangible assets?, IFN Working Paper
Series No. 785, Research Institute of Industrial Economics, Stockholm.
European Commission (2010), “Europe 2020. A European strategy for smart sustainable and inclusive growth”, Communication from the Commission, European Commission, Brussels.
Eustace, C. (2000), The Intangible Economy Impact and Policy Issues, Report of the European
High Level Expert Group on the Intangible Economy, European Commission.
Fukao, K., S. Hamagata, T. Miyagawa and K. Tonogi (2007), Intangible Investment in Japan: Measurement and Contribution to Economic Growth, RIETI Discussion Paper No. 07-E-
034, Research Institute of Economy, Trade and Industry, Tokyo.
Giorgio Marrano, M. and J. Haskel (2006), How much does the UK invest in intangible assets?,
Department of Economics Working Paper No. 578, Queen Mary, University of London. Giorgio Marrano, M., J. Haskel and G. Wallis (2007), What happened to the knowledge
economy? ICT, Intangible Investment and Britain’s Productivity Record Revisited,
Department of Economics Working Paper No. 603, Queen Mary, University of London. Griffith, R., S. Redding and J. Van Reenen (2004), “Mapping the two faces of R&D:
Productivity Growth in a Panel of OECD Industries”, The Review of Economics and Statistics, Cambridge, MA: MIT Press, Vol. 86, No. 4, pp. 883-895, December.
Grossman, G.M. and E. Helpman (1994), “Endogenous Innovation in the Theory of Growth”,
Journal of Economic Perspectives, Vol. 8, pp. 23-44.
Guellec, D. and B. van Pottelsberghe (2001), R&D and productivity growth: panel data analysis of 16 OECD countries, OECD Economic Studies No. 33, 2001/II, OECD, Paris.
Hall, P. and D. Soskice (eds) (2001), Varieties of Capitalism: The Institutional Foundations of Comparative Advantage, Oxford: Oxford University Press.
Hand, J. (1998), Does CEO human capital make a difference?, Working Paper, Rutgers
University, New Brunswick, NJ.
Hao, J., V. Manole and B. van Ark (2008), Intangible Capital and Growth – An International Comparison, Economics Program Working Paper Series, EPWP No. 08-14, Conference
Board Inc., New York, December.
Huselid, M. (1999), Human resources, knowledge management and firm performance, Working
Paper, Rutgers University, New Brunswick, NJ.
Jalava, J., P. Aulin-Ahmavaara and A. Alanen (2007), Intangible Capital in the Finnish Business Sector, 1975-2005, ETLA Discussion Paper No. 1103, Research Institute of the