Int. J. Electrochem. Sci., 13 (2018) 7442 – 7450, doi: 10.20964/2018.08.54
International Journal of
ELECTROCHEMICAL
SCIENCE
www.electrochemsci.orgTraces of Tl
+direct quantification by Anodic Stripping
Differential Alternative Pulses Voltammetry in excess of Pb
2+Mafalda Argüelles, Roumen Zlatev*, Margarita Stoytcheva,
M. Socorro Romero-Hernández, Benjamín Valdez, Lesle Hernández and Roberto Ibarra
Universidad Autónoma de Baja California, Instituto de Ingeniería, Blvd. Benito Juarez s/n, 21280 Mexicali B.C., Mexico
*
E-mail: [email protected]
Received: 26 March 2018 / Accepted: 1 June 2018 / Published: 5 July 2018
The second order voltammetric technique Differential Alternative Pulse Voltammetry was applied in anodic stripping mode (ASDAPV) for traces of Tl+ quantifications in excess of Pb2+. The potential-time waveform and the signal processing were modified to allow the DAPV application in anodic stripping mode. Reliable results for Tl+ concentrations were obtained by the ASDAPV up to 10-fold excess of Pb2+ in 0.1 mol L-1 HCl model solutions. Finally ASDAPV was applied for simultaneous heavy metals quantification in purified industrial waste water real samples without any pre-treatment.
Keywords: Differential Alternative Pulse Voltammetry (DAPV), Tl+ traces quantification, Stripping
analysis
1. INTRODUCTION
the living cells [3-7]. This defines the need of sensitive and reliable analytical methods for its quantification.
The dust in the air containing thallium strongly affects the human health and it is quantified by dust accumulation on air filters combined with its subsequent dissolution followed by the application of some analytical technique. The thallium concentrations in the purified industrial waste waters is relatively low and lies in ppb range, but taking into account its toxicity, these concentrations cannot be neglected. The toxicity of the dissolved thallium depends on its chemical forms (species) [8], but no speciation procedure for thallium determination has been reported to be applied with the spectral techniques yielding results for the “total thallium” only. Unfortunately, the application of spectral analytical techniques such as: inductively coupled plasma-mass spectrometry (ICP-MS) [9-11], flame atomic absorption spectrometry (FAAS) [12], inductively coupled plasma emission spectrometry (ICP-ES) [13], laser-induced fluorescence (LIF) [14], neutron activation analysis (NAA), [15], as well as the ion chromatography [16] for Tl+ quantification is problematic because of either low sensitivity toward this element or because of cost inefficiency.
Due to their high sensitivity, speciation ability, reliability, simplicity and cost efficiency, the voltammetric techniques applied in stripping mode have been widely recognized as a powerful tool for the heavy metals quantification [17, 18] including the specie Tl+ [3, 19–29]. Unfortunately, Tl+ is almost always accompanied by Pb2+ having very close E1/2 to that of Tl+ in all the supporting electrolytes causing peaks overlapping interfering thus the Tl+ quantification. The Tl+ and Pb2+ chemical separation could be achieved by some pretreatment procedure application (precipitation, extraction, etc.), but it will make the analysis long, cost ineffective and less precise. A better alternative is the application of some second order voltammetric technique possessing high resolution allowing their simultaneous quantification without any sample pretreatment.
As known, the second order voltammetric technique DAPV introduced by the authors earlier [30] yields curves shaped as second derivative of the voltammetric wave consisting of consecutive anodic and cathodic peaks having small half-width for any of the quantified specie. Thus, in case of species determination having small E1/2 difference resulting in peaks overlapping, one of the species can be determined by its anodic peak, while the other of the species, by its cathodic peak remained on the voltammogram after the overlapping, as illustrated by the authors in [30, 31]. Unfortunately, the DAPV cathodic current response in anodic stripping mode and the anodic current response in cathodic stripping mode respectively are negligible, similar to the other second order techniques when applied in stripping mode for trace concentrations measurements. As a result, the shape of the registered DAPV voltammogram and hence its resolution degrades to that of the DPV [32-35], a first order voltammetric technique, losing the resolution advantage of DAPV.
2. EXPERIMENTAL
2.1. Instrumentation
EG&G PARC model 303A electrode stand was employed in HMDE mode in all the experiments. The mercury was chosen as electrode material because of its easily renewable surface. Ag/AgCl/ KClsat and a Pt wire served as reference and auxiliary electrode respectively, both part of the EG&G 303A electrode stand. Two minutes purging with N2 and 120 s deposition time at -1 V were applied in all the experiments.
Potentiostat CompactStat.h 20250 (Ivium Technologies, Netherlands) controlled by IviumPulse software in mode “Voltammetric Pulse Builder” was employed for the ASDAPV voltammograms registration. The EG&G 303A electrode stand was also controlled by this software through a special homemade interface connected to the potentiostat peripheral port.
2.2. Reagents
Standard Tl+ and Pb2+ solutions of 1000 µg mL-1 (ULTRA Scientific, USA) and HCl (Merck, Germany) diluted to 0.1 mol L-1 serving as supporting electrolyte, both of analytical grade were applied in all the experiments.
3. RESULTS AND DISCUSSION
3.1. Potential-Time waveform and the signal processing modification
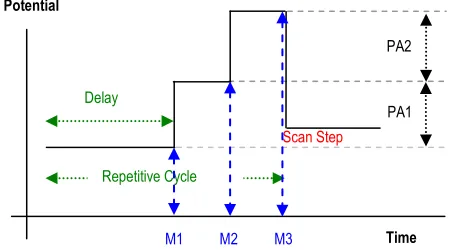
The DAPV potential-time waveform was modified as presented in Fig. 1, where the repetitive cycle consists of two consecutive pulses of same polarity but different amplitudes. Both pulses are anodic in case of anodic striping mode (ASDAPV) or both are cathodic for the cathodic striping mode (CSDAPV) respectively, applied without pause between them a delay time after the scan step.
Figure 1. Potential-Time waveform diagram of ASDAPV/CSDAPV: PA1 and PA2 are the pulse
amplitudes and M1, M2, M3 are the measured currents responses. M1 M2 M3 Time Potential
PA1 PA2
Delay
Repetitive Cycle
[image:3.596.176.402.576.701.2]
The PA1 is the basic value for the repetitive cycle of this potential-time waveform in respect to which the first pulse can be considered “cathodic” and the second “anodic” (in case of ASDAPV). Thus, modifying the DAPV response equation derived by the authors in [29], one can obtain for the ASDAPV/CSDAPV current response ΔIp (see also Fig. 1):
ΔIp = M1 + M3 – 2M2 (1)
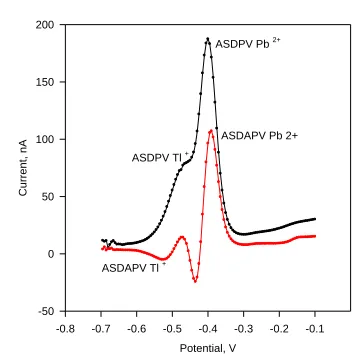
Here the pulse faradaic current component M2 resulting from the first pulse application serves as a basic value for the “cathodic” and the “anodic” pulse current components determination, the sum of which yields the ASDAPV/CSDAPV current response ΔI. A typical ASDAPV curve registered by the modified potential-time waveform diagram and signal processing application is presented in Fig. 2 in comparison with the corresponding DPV curve registered in stripping mode (ASDPV) at the same conditions. Completely free of overlapping Tl+ cathodic and Pb2+ anodic peak appear on the ASDAPV curve while the Tl+ peak is completely overlapped by that of Pb2+ in the ASDPV curve registered at the same conditions.
Potential, V
-0.8 -0.7 -0.6 -0.5 -0.4 -0.3 -0.2 -0.1
Cu
rr
en
t,
nA
-50 0 50 100 150 200
ASDPV Pb 2+
ASDAPV Pb 2+
ASDPV Tl +
[image:4.596.200.376.308.485.2]ASDAPV Tl +
Figure 2. ASDAPV and ASDPV curves of 100 ppb Tl+ and 100 ppb Pb2+ in 0.1 mol L-1 HCl registered
at the same conditions. Deposition time = 120 s at -1 V, PA1 = PA2 = 25 mV.
The potential-time waveform and the signal processing timing synchronization with the power line frequency of 60 (50) Hz together with signal integration for a full power line cycle period are powerful tools applied in all the experiments to suppress the electrical noise at the low currents measurement.
3.2. Supporting electrolyte selection
conditions in HCl with different concentration. It was found that the E1/2 difference is about 75 mV in 0.1 mol L-1 HCl decreasing with the HCl concentration increase. The DPV was chosen because of the more easily determination of the peak potential than the E1/2.
3.3. Pulse widths optimization for maximal sensitivity
As known, a rectangular pulse superimposition causes capacitive and faradaic pulse current components appearance. While the capacitive pulse current component decays according to an exponential law (rapidly), the faradic one dIp decays much more slowly according to Eq. 2, where the time t is the pulse width [30]. Any of the two faradaic pulse current components M2 and M3 resulting from the PA1 and PA1 superimposition can be calculated by Eq. 2 valid for reversible systems, the sum of which determines the peak height ΔIp (the modified technique sensitivity):
M2(3) = dIp = (n2F2/RT)AC dE (D/πt)1/2/P/(1+P)2 (2)
with: P = exp[(E – E1/2 + dE/2) nF/RT], R is the gas constant, T is the absolute temperature, n is the number of transferred electrons, F is the Faraday constant, A is the electrode area, C is the ion concentration, dE is the pulse amplitude, D is the diffusion coefficient, t is the current measurement delay time (the time between the pulse front edge and the moment of the current sampling), E is the electrode potential and E1/2 is the half-wave potential.
As seen from the Eq. 2, longer pulses result in lower pulse faradaic current responses dIp and as a result lower ΔIp, e.g. lower sensitivity. Thus, the minimal pulse width will result in maximal sensitivity and two power line periods long pulse equals to 33.33 ms at 60 Hz and 40 ms at 50 Hz is the optimal value. During the first power line period the pulse capacitive current decays to negligible value and along the second one an integration of the current signal is done.
3.4. Tl+ quantification in presence of prevailed Pb2+ concentration
Figure 3. Left: ASDAPV curves of 100 ppb Tl+ in 0.1 mol L-1 HCl in presence of increasing Pb2+
concentration from 200 to 600 ppb. (The entire plot is shown in Fig. 5) Deposition time = 120 s at –1 V, PA1 = PA2 = 25 mV; purging time 30 s, HMDE. Right: The 100 ppb Tl+ peak height as a function of the increased Pb2+ concentration together with the 95% confidential interval.
Potential, V
-0.7 -0.6 -0.5 -0.4 -0.3 -0.2
Cu rr ent , nA -80 -60 -40 -20 0 20 40 60 80
100 ppb Tl +
Pb2+
Pb2+ concentration, ppb
0 100 200 300 400 500 600 700
10 0 pp b T l
+ p
[image:5.596.125.477.506.691.2]
The Tl+ quantification precision was evaluated applying two approaches: 1) increasing the Pb2+ excess keeping the Tl+ concentration constant and 2) increasing the Tl+ concentration keeping the Pb2+ excess constant. For this purpose: 1) ASDAPV curves of 100 ppb Tl+ were registered at increasing Pb2+ concentration up to 600 ppb in 0.1 mol L-1 supporting electrolyte (see Fig. 3). The Tl+ cathodic peak keeps its height intact up to 6-fold excess of Pb2+ The further Pb2+ concentration increase causes a progressive Tl+ cathodic peak overlapping, decreasing the precision of its quantification. For comparison a complete overlapping of the Tl+ peak occurs even at Tl+ to Pb2+ concentration ratio as low as 1 to 1, applying in stripping mode the most common voltammetric technique, the Differential Pulse Voltammetry, as shown in Fig. 1.
The variations of the Tl+ peak height in presence of up to 6-fold excess of Pb2+ are presented in Fig. 3 right. The 100 ppb Tl+ peak heights relative standard deviation RSD was found to be 2.92 % in presence of Pb2+ excess up to 600 ppb. The further (up to 10-fold) Pb2+ excess increase causes progressive Tl+ quantification precision (RSD) degradation up to 4.87 % because of the progressive overlapping of the Tl+ and Pb2+ cathodic peaks.
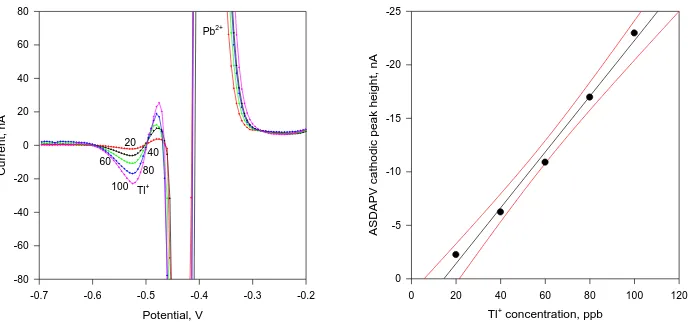
2) The Pb2+ excess of 1 ppm was kept constant while the Tl+ concentrations was varied in the range from 20 to 100 ppb in 0.1 mol L-1 HCl and the registered ASDAPV curves are presented in Fig. 4 left. The increased Tl+ concentration causes proportional Tl + cathodic peak height rising measured in respect to the blank curve registered in 0.1 mol L-1 HCl supporting electrolyte. As seen in the Fig. 4 left the Tl+ concentrations augmentation results in the Tl+ anodic peak increases too. This peak can be used for analytical purpose too but only in case of constant Pb2+ concentration only (constant peak height).
[image:6.596.114.458.519.680.2]The corresponding calibration curve built by the data obtained from Fig. 4 left presented in Fig. 4 right together with the 95% confidential interval is characterized with r2 = 0.991, slope (sensitivity) of 3.79 nA ppb-1 and intercept of -0.26 nA. A linear concentration range for Tl+ quantification up to 2.2 ppm was achieved in presence of 1 ppm Pb2+.
Figure 4. Left: ASDAPV curves of Tl+ in 0.1 mol L-1 HCl in presence of 1 ppm Pb2+ concentration
(the entire curves are presented in Fig. 5). Deposition time = 120 s at –1 V, PA1 = PA 2 = 25 mV; purging time = 30 s, HMDE. Right: The calibration plot for Tl+ together with the 95% confidential interval in the concentration range from 20 to 100 ppb in presence of 1 ppm Pb2+.
Potential, V
-0.7 -0.6 -0.5 -0.4 -0.3 -0.2
Cur ren t, nA -80 -60 -40 -20 0 20 40 60 80 Tl+ Pb2+ 20 40 60 80 100
Tl+ concentration, ppb
0 20 40 60 80 100 120
3.5. Pb2+ quantification in presence of inferior Tl+ concentration
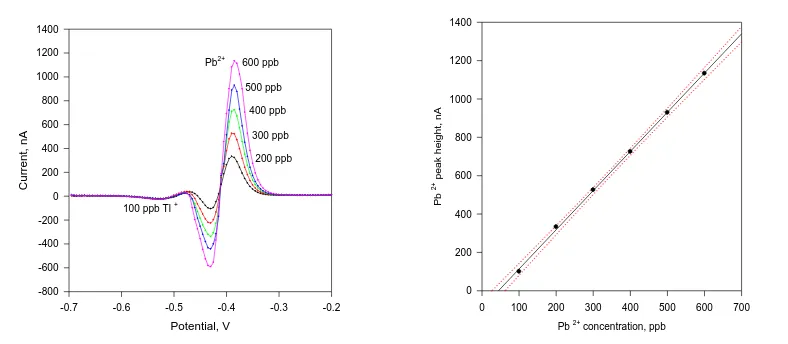
Separate and overlapping free anodic Pb2+ peaks were registered up to Pb2+ concentrations of 2 ppm (partly presented in the Fig, 5 left). The Pb2+ calibration plot (Fig. 5 right) build from the data obtained from the curves presented in Fig. 5 left possesses r2 = 0.999, slope (sensitivity) of 2.04 ppb nA-1, and intercept of -90.6 nA.
The overlapping of the Pb2+ cathodic peak and the Tl + anodic one in the central part of the Figs 3 and 4 results in a mixed peak which shape, polarity and height depend on the concentrations ratio and the determined species E1/2 difference. In general, this peak is not utilizable for analytical purpose, but all the other cathodic and anodic peaks remained intact after the overlapping and can serve for simultaneous concentration evaluation of both species.
Figure 5.Left: ASDAPV curves of increasing Pb 2+ concentration from 200 to 600 ppb in presence of
100 ppb Tl+ in 0.1 mol L-1 HCl. Deposition time = 120 s at –1 V, PA1 = PA 2 = 25 mV; purging time 30 s, HMDE; Right: Pb2+ calibration plot together with its confidential interval built from the data obtained from the curves presented in Fig. 3 Left.
3.5. Simultaneous Cu2+, Tl+, Pb2+, Cd2+ and Zn2+ quantification in real samples by ASDAPV
[image:7.596.97.491.267.439.2]The optimized ASDAPV values of pulses widths (33.33 ms at 60 Hz power line frequency) and pulses heights (PA1 = PA2 = 25 mV) determined by the application of model solutions were applied for traces of Tl+ quantification simultaneously with other heavy metals in real samples taken from industrial waste water purification station. The ASDAPV results were compared with those obtained by Thermo Scientific iCAP Q ICP-MS with integrated ESI prepFAST Auto-dilution System used in the purification station for concentration monitoring (see Table 1).
Table 1, Results comparison obtained with ASDAPV and ICP-MS application
Cu2+, ppb Pb2+, ppb Tl+, ppb Cd2+, ppb Zn2+, ppb
12.3 18.4 4.4 22.5 89.9 ASDAPV
11.9 19.0 4.7 23.3 88.1 ICP-MS
3.36 3.1 6.3 3.4 2.0 Error, %
Potential, V
-0.7 -0.6 -0.5 -0.4 -0.3 -0.2
Cu
rr
ent
,
nA
-800 -600 -400 -200 0 200 400 600 800 1000 1200 1400
100 ppb Tl +
Pb2+
200 ppb 300 ppb 400 ppb 500 ppb 600 ppb
Pb 2+ concentration, ppb
0 100 200 300 400 500 600 700
Pb
2+ p
ea
k h
eig
ht
, n
A
5 mL of the waste water sample having a pH of 7.6 ± 0.2 were added to the voltammetric cell and 5 mL 0.2 mol L-1 HCl was added to adjust the pH to about 0.1 serving as a supporting electrolyte as well. The measuring procedure described in the Experimental section was applied. The ASDAPV results are in good agreement with those obtained by ICP-MS.
4. CONCLUSION
The second order voltammetric technique DAPV performance in anodic stripping mode was improved by its potential-time waveform and signal processing modification. The ASDAPV was applied for Tl+ direct quantification in up to 10-fold excess of Pb2+ without any sample pretreatment employing 0.1 mol L-1 HCl as supporting electrolyte. Separate peaks for any of the two species were registered in spite that their E1/2 difference is only 75 mV, while complete peak overlapping occurs applying the most common voltammetric technique, the ASDPV.
ACKNOWLEDGEMENT
Тhe publishing fees were funded by PFCE 2017 program to Universidad Autonoma de Baja California, Instituto de Ingenieria.
References
1. M. Sturini, F. Maraschi, L. Cucca, G. Spini, A. Profumo, Analytical Sciences, 25 (2009) 121. 2. Database of statistics and information on the worldwide supply of, demand for, and flow of
minerals and materials essential to the U. S. economy, the national security, and protection of the environment Accessed at: http://minerals.usgs.gov/minerals/pubs/commodity/thallium
3. L. Zou, Y. Zhang, H. Qin, B. Ye. Electroanalysis, 21 (2009) 2563.
4. T.F. Xiao, D. Boyle, J. Guha, A. Rouleau, Y.T. Hong, B.S. Zheng, Appl. Geochem., 18 (2003) 675. 5. T.F. Xiao, J. Guha, D. Boyle, C.Q. Liu, B.S. Zheng, G.C. Wilson, A. Rouleau, J.G. Chen, Environ.
Int., 30 (2004) 501.
6. M.M. Storelli, Food Chem. Toxicol., 46 (2008) 2782. 7. A.L. J. Peter, T. Viraraghavan, Environ. Int., 31 (2005) 493.
8. L. Ralph, M.R. Twiss, Bull. Environ. Contam. Toxicol., 68 (2002) 261.
9. L.F. Dias, G.R. Miranda, T.D. Saint-Pierre, S.M. Maia, V.L. A. Frescura, A.J. Curtius, Spectrochim. Acta B, 60 (2005) 117.
10.P.J. Clarkson, D.J. Poole, C.K. Ryu, V N. Sharifi, J. Swithenbank, H.J. Waarlo, D. Ardelt, H. Falk, Anal. Bioanal. Chem., 377 (2003) 39.
11.A. Nolan, D. Schaumloffel, E. Lombi, L. Ouerdane, R. Lobinski, M. Laughlin, J. Anal. At. Spectrom., 19 (2004) 757.
12.H. Parham, N. Pourreza, N. Rahbar, J. Hazardeous Mater., 163 (2009) 588. 13.N. Velitchkova, E.N. Pentcheva, N. Daskalova, Spectrochim. Acta, 59 (2004) 871. 14.M. Ezer, S.A. Elwood, B.T. Jones, J. B. Simeonsson, Anal. Chim. Acta, 571 (2006) 136.
15.J. Kucera, M. Vobecky, L. Soukal, D. Zakoucky, D. Venos, J. Radioanal. Nucl. Chem., 217 (1997) 131.
17. O.A. Farghaly, R S. Abdel Hameed, A-A. H. Abu-Nawwas, Int. J. Electrochem. Sci., 9 (2014) 3287
18. A. M. Ashrafi, K. Vytřas, Int. J. Electrochem. Sci., 8 (2013)2095
19.R.Y.A. Hassan* , I. H.I. Habib and H. N.A Hassan, Int. J. Electrochem. Sci., 3 (2008)935 20. S. H. Mnyipika, P. N. Nomngongo, Int. J. Electrochem. Sci., 12 (2017)4811, doi:
10.20964/2017.06.36
21.M. Strouhal, R. Kizek, J. Vacek, L. Trnkova, M. Nemec, Bioelectrochemistry, 60 (2003) 10. 22.R. Gell, G. Aragay, C. Fontas, E. Antico, A. Merkoçi, Anal. Chim. Acta, 27 (2008) 219. 23.E.A. McGaw, G.M. Swain, Anal. Chim. Acta, 575 (2006) 180.
24.G.H. Hwang, W.K. Han, J.S. Park, S.G. Kang, Sens. Actuators B, Chem., 135 (2008) 309. 25.S.H. Mnyipika, P.N. Nomngongo, Int. J. Electrochem. Sci., 12 (2017) 4811.
26.O.A. Farghaly, R.S. Abdel Hameed, Abd-Alhakeem H. Abu-Nawwas, Int. J. Electrochem. Sci., 9 (2014) 3287.
27.A.M. Ashrafi, K. Vytřas, Int. J. Electrochem. Sci., 8 (2013) 2095.
28.H. Bagheri, A. Afkhami, H. Khoshsafar, M. Rezaei, S. J. Sabounchei, M. Sarlakifar, Anal. Chim. Acta, 870 (2015) 56.
29.E.O. Jorge, M.M.M. Neto, M.M. Rocha, Talanta 72 (2007) 1392
30.R. Zlatev, M. Stoytcheva, B. Valdez, J-P. Magnin, P. Ozil, Electrochem. Commun., 8 (2006) 1699. 31.R. Zlatev, M. Stoytcheva, B. Valdez, Electroanalysis, 22 (2010) 1671.
32.G. Barker, Anal. Chim. Acta, 18, (1958) 118.
33.G.C. Barker, A.W. Gardner, M.J. Williams, J. Electroanal. Chem., 42, (1973) 21. 34.G.C. Barker, A.W. Gardner, Z. Anal. Chem., 173, (1960) 79.
35.J. Osteryoung, J. Chem. Educ., 60, (1983) 296.
36.Y. Kuta, A. Trifinov, Introduction to Polarography, Ed. Science and Art, Sofia, 1955, p 295. 37.B. Krasnodêbska-Ostrêga, J. Padyna, J. Golimowski, M. Kania, Chem. Anal. (Warsaw), 54 (2009)
109.
38.R.G. Dhaneshwar, L. R. Zarapkar, Analyst, 105 (1980) 386.