Int. J. Electrochem. Sci., 12 (2017) 1829 – 1845, doi: 10.20964/2017.03.18
International Journal of
ELECTROCHEMICAL
SCIENCE
www.electrochemsci.org
Effects of Stray AC Interference on Corrosion Behavior of X70
Pipeline Steel in a Simulated Marine Soil Solution
Yingchao Li, Cheng Xu, Ronghua Zhang, Qiang Liu, Xinhua Wang*, Yingchun Chen**
College of Mechanical Engineering and Applied Electronics Technology, Beijing University of Technology, 100 Ping Le Yuan, Chaoyang District, Beijing 100124, China
*
E-mail: [email protected]
**
E-mail: [email protected]
Received: 7 December 2016 / Accepted: 12 January 2017 / Published: 12 February 2017
The effects of stray alternating current (AC) on the corrosion behavior of X70 high strength pipeline steel in a marine soil simulated solution was investigated. For a comparison, the study was operated in 3.5% NaCl solution and with an application of 150 MPa tensile stress as well. The electrochemical measurements of open circuit potential (OCP) and potentiodynamic polarization were used to exam the electrochemical process on the X70 steel surface under AC interference. A digital camera and scanning electron microscope (SEM) were used to analysis the corrosion morphology. The results show that a 30 A/m2 AC interference slightly shifted the corrosion potential -0.03 V, while a 300 A/m2 AC signal changed the value as much as -0.2 V. It was well explained with a mathematic model of AC interference. The corrosion rate increased with the AC current density in all test conditions. A corrosion mechanism was proposed to describe the occurrence of AC corrosion on the X70 steel sample surface. A net anodic current, implying an anodic dissolution, was resulted from a complete cycle of AC interference. The corrosion morphology changed from uniform corrosion to pitting corrosion under the AC interference. Thus, stray AC promoted the localized corrosion.
Keywords: Stray alternating current corrosion, X70 pipeline steel, corrosion mechanism, corrosion morphology, simulated marine soil solution
1. INTRODUCTION
structures have been suffered from the stray current induced corrosion damage for decades in all over the world [4]. Not only metallic materials, stray current puts concrete reinforcements and other contractures in danger as well [5]. Regarding corrosion mechanisms, scientists have proposed mechanisms and mathematical models to explain souring corrosion [6,7], sweet corrosion [8,9], and microbiologically influenced corrosion (MIC) [10,11]. Appropriate and accurate models are necessary to define the damage process caused by stray current.
Stray current is defined as the current which deviates from the designed paths because of alternative routes with lower resistance [12–15]. For instance, the rails have a resistance about 40-80 mΩ/km, while a poor isolation between earth and rails is up to 100 mΩ/km [16]. Therefore, a proportion of the traction current leaks to earth and flows along the parallel pipelines, reinforcements, or other metallic structures before returning back to the rail system. Stray current is generated in multiple scenarios. Depending on different sources, stray current is divided to stray direct current (DC) and stray alternating current (AC). While the buried pipeline picks up current strayed from an urban subway, high-speed railway, or other electric traction systems, stray DC is generated [13]. In some cases, the electric transportation network in oil depots generates stray DC as well [17]. A high voltage alternating electric transportation brings stray AC. Additionally, the application of cathodic protection introduces stray current leaking at unavoidable defects existed in the pipeline coatings [18–20].
Stray current is an inevitable adverse factor to the pipeline system for causing severe corrosion. More construction of electrical facilities, particularly high-voltage AC electric transmit systems and AC-powered transmission systems are built in the newly developing urban area. Due to the limitation of available space, there is an increasing tendency to install these AC facilities overhead the underground steel pipelines, which had been installed in prior. For instance, at southern Beijing in China, pipelines which were away from the urban area are under compound threats of stray current nowadays due to the construction of urban subway and high-speed railways. In Shanghai China, corrosion failure occurred many times on the buried gas pipeline which was parallel to the electric rail transit powered by DC [21]. A stray current corrosion model was proposed to predict the metal materials corrosion in the metro line in Nanjing China [22]. Subway systems in Chicago (IL, USA) and Morgantown (WV, USA) have been repaired multiple times because of the stray current corrosion [23,24]. Therefore, the research to minimize the possibilities of stray current corrosion is desirable.
corrosion process. Stray AC decreased corrosion potential and increased the corrosion rate in the corrosion of X60 steel [28]. The increase in AC frequency caused a positive shift of the corrosion potential of X80 steel [29]. It was believed that a 100 A/m2 stray AC is a threshold to judge the stray AC corrosion. Even given a cathodic protection, mild steel was still corroded by stray AC in marine environments [30]. Hence, to understand the AC corrosion, more studies of the mechanism of stray AC corrosion are much favorable [31].
In this research, the corrosion behavior of X70 high strength pipeline steel under a load of AC signal with various current densities was investigated. The test solution was a simulated marine soil solution. A NaCl solution was used as a comparison. A tensile stress was applied to simulate the serving condition. The electrochemical measurements such as open circuit potential (OCP) and potentiodynamic polarization were used to study the electrochemical process on the X70 steel surface. The corrosion morphology was analyzed using a digital camera and scanning electron microscope (SEM). This study is systematic and detailed on the electrochemical process of the stray AC corrosion on the X70 steel surface.
2. EXPERIMENTAL
2.1 Materials and test solution
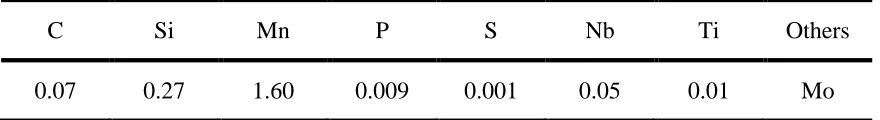
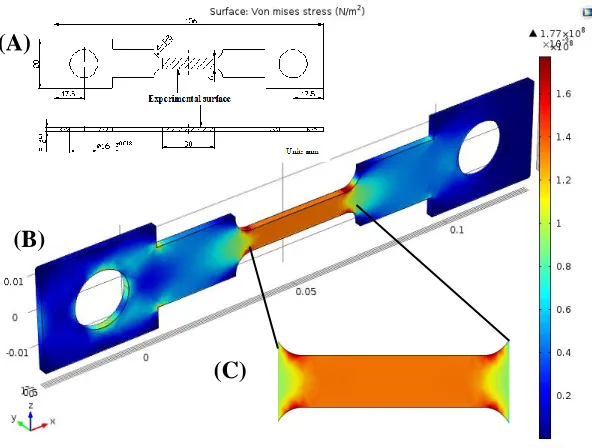
[image:3.596.80.520.672.732.2]In this work, X70 high strength pipeline steel was used. The chemical composition of X70 steel is shown in Table 1. The mechanical properties of X70 at 25 oC are tensile strength of 610 PMa, and yield strength of 503 MPa. Two types of samples were used in this research, disk-shaped samples with an open surface area of 1 cm2 and strain stress samples shown in Figure 1(A). The tensile stress was considered in this research. It was applied using a slow stress tensile test machine (Reger RGM 6050, Guangzhou, China) according to ASTM G129. The Von Mises stress distribution was simulated using COMSOL software to obtain the stress distribution on X70 sample surface. The values of Von Mises stress in the middle of the sample are the highest, which is represented by orange color in Figures 1(B) and 1(C). Therefore, the exposed test area in the electrochemistry measurement was the center of the sample with a surface area of 1 cm2. Other surfaces of the sample were painted with silicone rubber, which had an excellent water resistance. The test surface was polished using 60#, 200#, and 600# grit papers and then washed using deionized water and degreased with acetone.
Table 1. Chemical composition of X70 pipeline steel (wt.%)
C Si Mn P S Nb Ti Others
Figure 1. The test sample and the simulation of stress distribution. (A) Sample dimension, (B) Von Mises stress simulation, and (C) Detailed distribution of Von Mises stress on the test surface.
The test solution used in this research is Dagang simulated soil solution, which is a typical acidic soil solution in the marine environment. The ionic concentration and chemical composition of Dagang simulated solution are shown in Tables 2 and 3. As a comparison, tests were operated in 3.5% NaCl solution as well, which is a common electrolyte solution in laboratory tests.
Table 2. Ionic concentration of Dagang simulated soil solution (g/L)
NO3- Cl- SO42- HCO3- Ca2+ Mg2+ K+ Na+
0.188 15.854 2.040 0.181 0.378 0.643 0.225 9.982
Table 3. Chemical composition of Dagang simulated soil solution (g/L)
CaCl2 NaCl MgSO4•7H2O KNO3 NaHCO3
1.049 25.02 5.227 0.306 0.249
2.2 Immersion test
The immersion test was carried out to study stray AC corrosion. The AC current density instead of AC voltage was chosen as a key factor in this research. Because the prediction of the degree of stray AC corrosion is reliable based on the stray current density [32]. A large stray AC voltage may results into a relatively small current density due to the environment resistance. Thus, no absolute threshold value can be adopted [20]. The immersion tests were carried out under AC signals with various current densities and under the combination of AC signals and a 150 MPa tensile stress. The
(B)
[image:4.596.149.445.70.294.2]
overall test matrix is listed in Table 4. After the immersion test, samples were washed and de-rust using Clark’s solution following standard procedures [33]. The microstructure of the corroded surface was observed using a high-resolution digital camera and SEM (S-3400, Hitachi, Tokyo, Japan).
Table 4. Test matrix of stray AC corrosion on X70 steel
Sample materials X70
Test solution Dagang simulated soil solution and 3.5% NaCl solution
Temperature 25 oC
Morphology interpretation Digital images and SEM images
Research conditions Stray AC signal (0 A/m2, 30 A/m2, 100 A/m2, 200 A/m2, 300 A/m2) and stray AC signal + a fixed
stress (150 MPa) Test duration of immersion
test
24 hours
[image:5.596.210.382.381.594.2]2.3 Electrochemical test
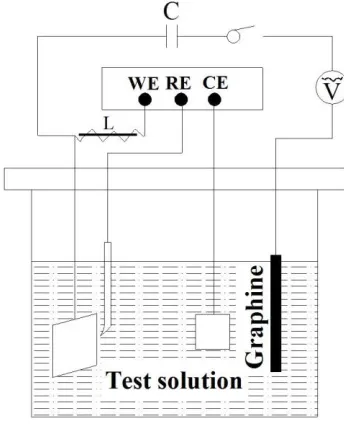
Figure 2. Schematic diagram of the electrochemical test setup.
signal to the electrochemical workstation. The purpose of the capacitor was to prevent the direct current from flowing into the AC mesh. The AC current density in this study was measured with a multimeter. Ahead of the measurement, electrodes were maintained in the test solution for 30 minutes to achieve an electrochemical steady state on the sample surface. The open circle potential (OCP) was recorded for 30 minutes. Afterward, the measurement of potentiodynamic polarization curve was carried out at a potential sweeping rate of 0.5 mV/s starting from -500 mV (vs. OCP) and ending at 700 mV (vs. OCP).
3. RESULTS AND DISCUSSION
3.1 OCP results of X70 samples at various AC current densities
0 200 400 600 800 1000 1200 1400 1600 1800 -0.90 -0.85 -0.80 -0.75 -0.70 -0.65 -0.60 -0.55 OCP ( V, SCE) Times (s)
0 A/m2 30 A/m2 100 A/m2 200 A/m2 300 A/m2
0 200 400 600 800 1000 1200 1400 1600 1800 -0.78 -0.77 -0.76 -0.75 -0.74 -0.73 -0.72 -0.71 -0.70 -0.69 -0.68 -0.67 -0.66
-0.65 0 A/m2
30 A/m2 100 A/m2 200 A/m2 300 A/m2
OCP
(V, SCE)
Time (s)
0 200 400 600 800 1000 1200 1400 1600 1800 -0.80
-0.75 -0.70 -0.65 -0.60
-0.55 0 A/m
2
30 A/m2
100 A/m2
200 A/m2
300 A/m2
O
CP (V
.SCE)
Time (s)
0 200 400 600 800 1000 1200 1400 1600 1800 -0.76 -0.74 -0.72 -0.70 -0.68 -0.66 -0.64 -0.62 -0.60 -0.58 -0.56
0 A/m2
30 A/m2
100 A/m2
200 A/m2
300 A/m2
OCP (
Vs. SCE
)
Time (s)
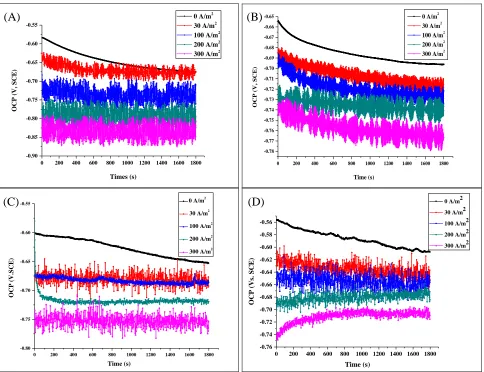
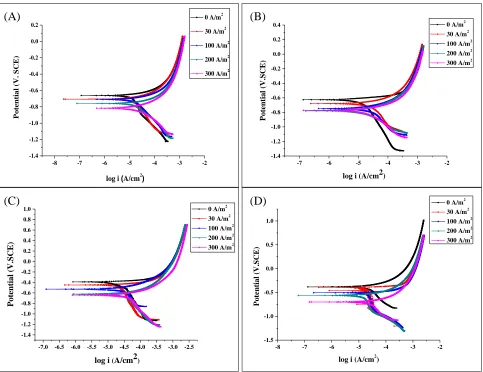
Figure 3. OCP vs. time curves of X70 samples at various AC current densities in (A) Dagang simulated soil solution, (B) 3.5% NaCl solution, (C) Dagang simulated soil solution with a 150 MPa tensile stress, and (D) 3.5% NaCl solution with a 150 MPa tensile stress.
Figure 3 shows the OCP curves of X70 samples at different AC current densities in Dagang simulated soil solution and 3.5% NaCl solution. Firstly, fluctuations are observed on each OCP curve with an AC signal applied. It is believed that the interference of AC signal caused these fluctuations.
(C) (D)
[image:6.596.58.542.269.641.2]
Secondly, it is noticed that the AC signals shift the OCP value to the negative direction at each AC signal level in both solutions. As the AC current density increases, the shifted value is ascendant. At all four conditions, a 30 A/m2 AC slightly shifts the OCP values up to -0.03 V, while a 300 A/m2 AC signal shifts the OCP values -0.2 V in general. It is an good agreement with other researchers [34].
The application of an increasing current density of AC signal shifted the OCP and corrosion potential negatively. Lalvani and Lin [35] proposed a mathematical model (Equations 1 and 2) to explain the AC interference on the electrochemical process on the carbon steel surface.
α E
Ecorr,AC corr (1)
1 2k a p 2 1 2k c p 2 c a a 1 2β E ! 1 1 2β E ! 1 ln 1 β β β α k k k k (2)where Ecorr, AC and Ecorr are the corrosion potentials with and without AC signal, βa and βc are
the anodic and cathodic Tafel slopes, Ep is the peak voltage value of the AC signal, and k is an integral
number. According to Equations 1 and 2, Ecorr, AC is a function of βa/βc and Ep. The value of Ecorr,AC is
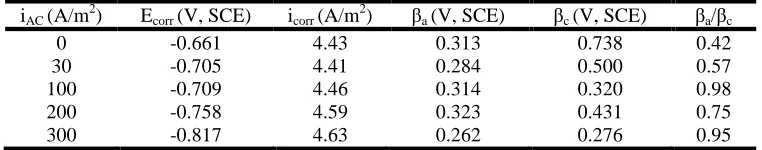
inversely proportional to the value of α based on Equation 1. The values of βa/βc are listed in Tables 5
to 8. These four tables are obtained according to the fitting results of polarization curves and are discussed detailedly in Section 3.2. It was found that the value of βa/βc is smaller than one in all
conditions. It implies that the value of α is positive in all circumstances since the β calculation term and logarithmic term are both negative in Equation 2. The value of α is proportional to the value of Ep.
Table 5. Electrochemical parameters of X70 samples at various AC current density without tensile stress application in Dagang simulated soil solutions
iAC (A/m2) Ecorr (V, SCE) icorr (A/m2) βa (V, SCE) βc (V, SCE) βa/βc
0 -0.661 4.43 0.313 0.738 0.42
30 -0.705 4.41 0.284 0.500 0.57
100 -0.709 4.46 0.314 0.320 0.98
200 -0.758 4.59 0.323 0.431 0.75
300 -0.817 4.63 0.262 0.276 0.95
Obviously, the value of Ep is proportional to the AC current density due to a constant surface
area and fixed test solution. Thus, the Ecorr, AC shifts negatively while the AC current density increases.
This model explains the negative shift of the corrosion potential of X70 steel samples with AC interference. Furthermore, the anodic and cathodic reactions on X70 steel sample surface are shown as Reactions 1 and 2. A more negative corrosion potential means a larger value of △E against the same oxidant. It results in a larger Gibbs free energy change based on Equation 3, in which △G is the Gibbs free energy change, F is the Faraday constant, n is the number of moles of electrons transferred in the reaction, and △E is the cell potential (ECathodic – Ecorr, AC). In this case, a large positive Gibbs free
[image:7.596.108.489.501.576.2]
favorable. Therefore, the stray AC puts the pipeline steel in great danger for decreasing the corrosion potential.
Anodic reactions: FeFe2 2e EAnodic=Ecorr, AC (1)
Cathodic reactions: O2 2H2O 4e 4OH ECathodic (2)
△G=-nF△E (3)
Table 6. Electrochemical parameters of X70 samples at various AC current density without tensile stress application in 3.5% NaCl solution
iAC (A/m2) Ecorr (V, SCE) icorr (A/m2) βa (V, SCE) βc (V, SCE) βa/βc
0 -0.626 4.39 0.41 0.577 0.71
30 -0.68 4.27 0.296 0.552 0.54
100 -0.747 4.43 0.538 0.634 0.85
200 -0.773 4.48 0.283 0.304 0.93
300 -0.78 4.54 0.243 0.307 0.79
Table 7. Electrochemical parameters of X70 samples at various AC current density with a 150 MPa tensile stress application in Dagang simulated soil solutions
iAC (A/m2) Ecorr (V, SCE) icorr (A/m2) βa (V, SCE) βc (V, SCE) βa/βc
0 -0.389 4.35 0.198 0.733 0.27
30 -0.449 4.39 0.395 0.854 0.46
100 -0.527 4.37 0.276 1.02 0.27
200 -0.623 4.49 0.337 0.773 0.44
300 -0.642 4.45 0.303 0.696 0.43
Table 8. Electrochemical parameters of X70 samples at various AC current density with a 150 MPa tensile stress application in 3.5% NaCl solution
iAC (A/m2) Ecorr (V, SCE) icorr (A/m2) βa (V, SCE) βc (V, SCE) βa/βc
0 -0.383 4.08 0.287 0.671 0.42
30 -0.392 4.40 0.778 0.817 0.95
100 -0.504 4.43 0.44 1.815 0.24
200 -0.560 4.48 0.293 1.315 0.22
300 -0.701 4.52 0.315 0.618 0.50
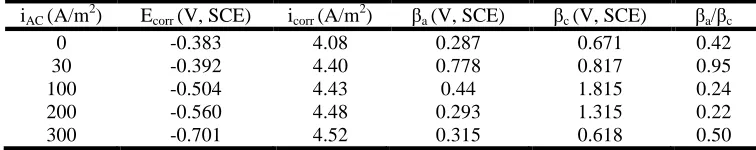
3.2 Polarization curves of X70 samples at various AC current densities
[image:8.596.110.487.227.302.2] [image:8.596.109.487.374.449.2] [image:8.596.108.486.523.598.2]
shapes of polarization curves. The polarization curve fitting of Figure 4 is summarized in Tables 5 to 8, respectively. The corrosion potential (Ecorr), corrosion current density (iCorr), and Tafel slopes (βa and
βc) are included. The fitting process was followed by literature illustrations [36–38]. It is seen that with
the increase of AC current density, the corrosion potentials decreased, which is consistent with the OCP measurement. Meanwhile, the corrosion current density increased slightly.
-8 -7 -6 -5 -4 -3 -2
-1.4 -1.2 -1.0 -0.8 -0.6 -0.4 -0.2 0.0 0.2 Po tenti al (V. SC E)
log i (A/cm2)
0 A/m2
30 A/m2
100 A/m2
200 A/m2
300 A/m2
-7 -6 -5 -4 -3 -2
-1.4 -1.2 -1.0 -0.8 -0.6 -0.4 -0.2 0.0 0.2
0.4 0 A/m2
30 A/m2 100 A/m2 200 A/m2 300 A/m2
Potent ial ( V .SC E )
log i (A/cm2)
-7.0 -6.5 -6.0 -5.5 -5.0 -4.5 -4.0 -3.5 -3.0 -2.5 -1.4 -1.2 -1.0 -0.8 -0.6 -0.4 -0.2 0.0 0.2 0.4 0.6 0.8
1.0 0 A/m2
30 A/m2 100 A/m2 200 A/m2 300 A/m2
Pot en tial (V .S CE)
log i (A/cm2)
-8 -7 -6 -5 -4 -3 -2
-1.5 -1.0 -0.5 0.0 0.5 1.0 Potential (V.SCE)
log i (A/cm2)
0 A/m2 30 A/m2 100 A/m2 200 A/m2 300 A/m2
Figure 4. Polarization curves of X70 samples at various stray AC current density in (A) Dagang simulated soil solution, (B) 3.5% NaCl solution, (C) Dagang simulated soil solution with a 150 MPa tensile stress, and (D) 3.5% NaCl solution with a 150 MPa tensile stress.
The corrosion rate of X70 steel raised with increasing AC current densities. Thermodynamically, the AC interference made the corrosion occurring easily. Kinetically, the corrosion rate increased slightly. The corrosion rates at all conditions are at the same order of magnitude in Tables 5 to 8. The corrosion rate of metal is determined by the anodic dissolution, which means the corrosion rate is correlated to the anodic current density. Under the interference of AC signal, the anodic process was affected, particularly at the high current density.
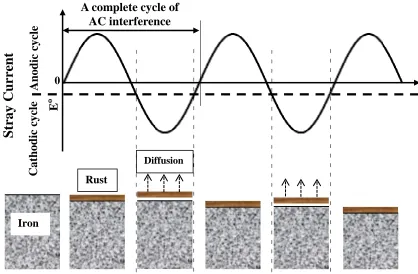
A mechanism was proposed by Buchler in 2009 to explain stray AC corrosion [18,32]. In an AC interference, the anodic reaction and the cathodic reaction on the X70 surface were alternated by
(A) (B)
[image:9.596.58.541.180.552.2]
the time since the applied AC signal were sinusoidal. In the anodic cycle, the steel is oxidized, and the anodic reaction occurs. While in the cathodic cycle, a passive film forms. A modified mechanism based on Buchler’s theory is proposed and shown in Figure 5 to explain this electrochemical process. When applying a potential larger than the equilibrium potential of the electrode, the electrode is anodic polarized, and the anodic reaction is accelerated. Otherwise, the cathodic reaction is accelerated. In the anodic cycle of AC interference, the accelerated anodic reaction results in an increasing anodic current density. While on the cathodic cycle of AC interference, the anodic reaction is hindered and the cathodic reaction becomes dominant, however, not the same degree of the anodic reaction. In the most of a complete cycle of AC interference, the anodic reaction is accelerated. A net anodic current, implying an anodic dissolution, was resulted from a complete cycle of AC interference. Overall, the corrosion process of the X70 steel surface was accelerated in a complete cycle of AC interference. Furthermore, in the same electrolyte condition, a higher AC current density indicates a higher AC voltage, which means a more rapidly anodic polarization reaction occurs on the X70 steel surface. Therefore, the corrosion rate raised as the increase of the AC current density.
Figure 5. Schematic mechanistic diagram of the electrochemical process of the stray AC induced corrosion.
Tensile stress had a limited effect on the corrosion behavior under the AC interference in this work. It is noticed that no significant difference is observed between results of OCP and corrosion rate with and without applying a 150 MPa tensile stress. Wang found that tensile stress had a significant influence on the stray DC corrosion of X80 steel [27]. In stray AC damage, tensile stress has more contribution to stress corrosion cracking (SCC), but less to the corrosion damage. Liu had claimed that even under a stray AC with low current density, the SCC susceptibility of pipeline steel increased [39–
Diffusion
A
n
od
ic
c
yc
le
C
at
h
od
ic
c
yc
le
Iron
Rust
E
o
A complete cycle of AC interference
0
Stra
y
Cu
[image:10.596.83.501.320.594.2]
41]. No significant difference was observed between the results of Dagang simulated soil solution and 3.5% NaCl solution either. A potential reason is that the oxygen reduction is the dominant cathodic reaction in this research. The oxygen concentration of both solutions is similar since the experimental setup is an open system.
3.3 Corrosion morphology at various AC current densities
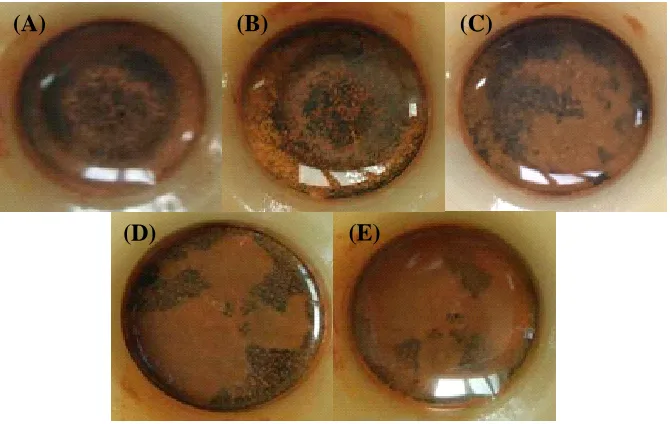
Figure 6. Images of X70 disk samples at various stray AC current densities of (A) 0 A/m2, (B) 30 A/m2, (C) 100 A/m2, (D) 200 A/m2, and (E) 300 A/m2 in Dagang simulated soil solution.
Figure 7. Images of X70 disk samples at various stray AC current densities of (A) 0 A/m2, (B) 30 A/m2, (C) 100 A/m2, (D) 200 A/m2, and (E) 300 A/m2 in 3.5% NaCl solution.
(A) (B) (C)
(D) (E)
(A) (B) (C)
[image:11.596.134.462.191.402.2] [image:11.596.130.465.464.676.2]
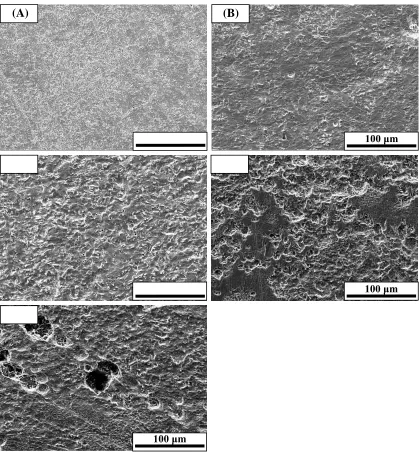
Figure 8. SEM images of X70 samples at various stray AC current densities of (A) 0 A/m2, (B) 30 A/m2, (C) 100 A/m2, (D) 200 A/m2, and (E) 300 A/m2 in Dagang simulated soil solution.
Figures 6 and 7 are corrosion morphology images of X70 samples under AC interference with various current densities in Dagang simulated soil solution and 3.5% NaCl solution. After 24-hour immersion test, the shining sample surfaces were covered with brownish corrosion products little by little. In both solutions, with an augment of AC density, more brownish floccule rusts were observed. The whole sample surfaces were covered by thick corrosion products completely when applying 300 A/cm2 AC interference. It implies that the AC brings severe corrosion in both test solutions. In the stray AC corrosion process, the chemical process of rust accumulation is shown in Reactions 3 to 5. Because the iron dissolution is irreversible, the iron ion would either remain as ion form or react with OH- to form corrosion product on the sample surface [42]. The brownish rust products noticed on the
(C) (D)
(E)
100 μm
100 μm
100 μm
100 μm
100 μm
[image:12.596.89.508.67.519.2]
coupon surface were mainly the mixture of Fe(OH)2, FeOOH, and Fe3O4. Fe2O3 is rarely due to its
high activation energy [43].
Figure 9. SEM images of X70 samples at various stray AC current densities of (A) 0 A/m2, (B) 30 A/m2, (C) 100 A/m2, (D) 200 A/m2, and (E) 300 A/m2 in 3.5% NaCl solution.
In Figure 5, after the corrosion product defused away, a new layer of iron corroded and formed corrosion product layer with OH-.
2
-2
Fe(OH) 2OH
Fe (3) O
2H 4FeOOH O
4Fe(OH)2 2 2 (4)
O 4H O
3Fe 2e
Fe
8FeOOH 3 4 2
-2
(5)
(C) (D)
(E)
100 μm
100 μm
(A) (B)
100 μm
100 μm
[image:13.596.88.511.118.571.2]
Figure 10. SEM images of X70 samples with 150 MPa tensile stress at various stray AC current densities of (A) 0 A/m2, (B) 30 A/m2, (C) 100 A/m2, (D) 200 A/m2, and (E) 300 A/m2 in Dagang simulated soil solution.
Figures 8 to 11 are SEM images of the corrosion morphologies of X70 steel samples under AC interference with various current densities in Dagang simulated soil solution and 3.5% NaCl solution. The sample surfaces were less corroded after 24-hour tests in the absence of AC signal than samples under AC interference. Without tensile stress, X70 steel samples under 30 and 100 A/m2 AC signals experienced a uniform corrosion. While the AC current density was increased to 200 and 300 A/m2, pits were observed on the sample surface and X70 steel samples undergone a localized corrosion in both solutions, as seen in Figures 8 and 9. Zhu observed a pitting corrosion on X80 steel under various AC current densities in high pH carbonate/bicarbonate solution [41]. Guo noticed that the X60 steel corrosion morphology under AC interference changed from uniform corrosion to pitting corrosion in a simulated soil solution [28]. With tensile stress, a uniform corrosion was observed on sample surfaces
(C) (D)
(E)
100 μm
100 μm 100 μm
(A) (B)
100 μm
[image:14.596.86.511.68.523.2]
under 30 and 100 A/m2 AC interference in both solutions. Although pits were found on the sample surface under 200 and 300 A/m2 AC interference, both pit amount and pit depth were not at the same level like that without tensile stress. To sum up, it is safe to say that stray AC promotes localized corrosion.
Figure 11. SEM images of X70 samples with 150 MPa tensile stress at various stray AC densities of (A) 0 A/m2, (B) 30 A/m2, (C) 100 A/m2, (D) 200 A/m2, and (E) 300 A/m2 in 3.5% NaCl solution.
4. CONCLUSIONS
The corrosion behavior of X70 high strength pipeline steel under stray AC with various current densities in Dagang simulated marine soil solution was investigated. The main findings are as follows:
(C) (D)
(E)
100 μm
100 μm 100 μm
(A) (B)
100 μm
[image:15.596.89.511.148.601.2]
(1) The AC interference negatively shifted the value of OCP and corrosion potential. It results in a higher cell potential and Gibbs free energy change, which means a tendency toward a metal corrosion. The corrosion potential shifted more negatively under stray AC interference with higher current density. This phenomenon was well explained using an electrochemical mathematic model.
(2) The AC interference increased the corrosion current and thus, the corrosion rate. Stray AC with a higher current density caused more severe corrosion. A mechanism was proposed to describe the electrochemical process of stray AC corrosion. In the most of an AC cycle, the steel sample was under anodic polarization (corrosion occurs). Although in the rest of an AC cycle, the steel sample was under cathodic polarization (being protected), it was not to the same degree as the anodic polarization. A net corrosion current was generated during a complete AC cycle. Tensile stress had a limited contribution to the stray AC corrosion.
(3) The AC corrosion morphology changed from uniform corrosion with low AC current density to pitting corrosion with high AC current density in both test solutions. The threshold is above 100 A/m2. Pits were observed in the combination of AC interference and tensile stress. Tensile stress reduced the pit amount and pit depth on the sample surface. The AC interference promoted the localized corrosion of X70 steel in both solutions.
ACKNOWLEDGEMENTS
The authors appreciate the financial supports from National Natural Science Foundation of China Project Number: NSFS 51471011, China Postdoctoral Research Foundation, and Beijing Postdoctoral Science Foundation.
References
1. S. Nesic, Corros. Sci., 49 (2007) 4308.
2. G. Jacobson, Mater. Perform., 46 (2007) 26–34.
3. X. Wang, X. Tang, L. Wang, C. Wang and W. Zhou, J. Nat. Gas Sci. Eng., 21 (2014) 474. 4. Y. Tzeng and C. Lee, IEEE Trans. Power Deliv., 25 (2010) 1516.
5. A. Aghajani, M. Urgen and L. Bertolini, J. Mater. Civ. Eng., 28 (2016) 4015177. 6. J. Ning, Y. Zheng, D. Young, B. Brown and S. Nesic, Corrosion., 70 (2013) 375. 7. Y. Zheng, B. Brown and S. Nesic, Corrosion., 70 (2013) 351.
8. S. Nesic, J. Postlethwaite and S. Olsen, Corrosion., 52 (1996) 280.
9. Y. Sun and S. Nesic, A parametric study and modeling on localized CO2 corrosion in horizontal
wet gas flow, NACE Corrosion/2004, New Orleans LA, USA, 2004, Paper No. 04380. 10. D. Enning and J. Appl. Environ. Microbiol., 80 (2014) 1226.
11. T. Gu, J. Microb. Biochem. Technol., 4 (2012) 3.
12. A. Cao, Q. Zhu, S. Zhang and B. Hou, Anti-Corros. Methods Mater., 57 (2010) 234.
13. S. Allahkaram, M. Isakhani-Zakaria, M. Derakhshani, M. Samadian, H. Sharifi-Rasaey and A. Razmjoo, J. Nat. Gas Sci. Eng., 26 (2015) 453.
14. L. Bertolini, M. Carsana and P. Pedeferri, Corros. Sci., 49 (2007) 1056.
15. A. Solgaard, M. Carsana, M. Geiker, A. Küter and L. Bertolini, Corros. Sci., 74 (2013) 1. 16. I. Cotton, C. Charalambous, P. Aylott and P. Ernst, IEEE Trans. Veh. Technol., 54 (2005) 722. 17. J. Yu, Electric explosion ptotection, 4 (2009) 8.
18. M. Buchler and H. Schöneich, Corrosion., 65 (2009) 578.
2005, Paper No. 05132.
20. M. Ormellese, S. Goidanich and L. Lazzari, Corros. Eng. Sci. Technol., 46 (2011) 618. 21. Z. Chen, C. Qin, J. Tang and Y. Zhou, J. Nat. Gas Sci. Eng., 15 (2013) 76.
22. Y. Wang, W. Li, S. Xu and X. Yang, Int. J. Electrochem. Sci., 8 (2013) 5314.
23. K. Wang, Q. Wu, M. Chen and L. Xie, Corrosion fatigue of reinforced concrete in the presence of stray current, International Conference on Electric Technology and Civil Engineering, Lushan, China, 2011, 1133.
24. West Virginia University, Appalachian underground corrosion short course (AUCSC), Morgantown, WV, 2009.
25. S. Eliassen and S. Hesjevik, Corrosion management of buried pipelines under difficult operational and environmental conditions, NACE Corrosion/2000,Orlando FL, USA, 2000, Paper No. 00724. 26. R. Wakelin and C. Sheldon, Investigation and Mitigation of AC Corrosion on a 300 MM Natural
Gas Pipeline, NACE Corrosion/2004, New Orleans LA, USA, 2004, Paper No. 04205. 27. X. Wang, X. Tang, L. Wang, C. Wang and Z. Guo, Int. J. Electrochem. Sci., 9 (2014) 4574. 28. Y. Guo, C. Liu, D. Wang and S. Liu, Pet. Sci., 12 (2015) 316.
29. A. Fu and Y. Cheng, Corros. Sci., 52 (2010) 612.
30. D. Kim, S. Muralidharan, T. Ha, J. Bae, Y. Ha, H. Lee and J. Scantlebury, Electrochimica Acta., 51 (2006) 5259.
31. M. Zhu, C. Du, X. Li, Z. Liu, H. Li and D. Zhang, Corros. Sci., 87 (2014) 224.
32. M. Zhu, C. Du, X. Li, Z. Liu, S. Wang, J. Li and D. Zhang, Electrochimica Acta., 117 (2014) 351. 33. C. Wen, J. Li, S. Wang and Y. Yang, J. Nat. Gas Sci. Eng., 27 (2015) 1555.
34. M. Büchler, Mater. Corros., 63 (2012) 1181.
35. G01 Committee, ASTM G1-03 solution for corrosion specimen preparation, 2003. 36. Y. Li, X. Li, G. Cai and L. Yang, Corros. Eng. Sci. Technol., 48 (2013) 322.
37. S. Lalvani and X. Lin, Corros. Sci., 36 (1994) 1039. 38. F. Mansfeld, Corros. Sci., 47 (2005) 3178.
39. M. Stern and A. Geaby, J. Electrochem. Soc., 104 (1957) 56.
40. X. Zhang, Z. Jiang, Z. Yao, Y. Song and Z. Wu, Corros. Sci., 51 (2009) 581. 41. Z. Liu, Z. Cui, X. Li, C. Du and Y. Xing, Electrochem. Commun., 48 (2014) 127.
42. S. Goidanich, L. Lazzari, M. Ormellese and M. Pedeferri, Influence of AC on corrosion kinetics for carbon steel, zinc and copper, NACE Corrosion/2005, Houston TX, USA, 2005, Paper No. 05189.
43. N. Dai, J. Zhang, Q. Chen, B. Yi, F. Cao and J. Zhang, Corros. Sci., 99 (2015) 295.