Fuel Cells for Power Generation and Organic Waste
Treatment on the Island of Mull
M. Duerr1, S. Gair1, A. Cruden1, J. McDonald1, T. Hegarty2, M. Chesshire3
1 Institute for Energy & Environment, University of Strathclyde 204, George Street, Glasgow, G1 1XW, Scotland, UK. phone: +44 548 4651, fax:+44 4651 4872, e-mail: s.gair@eee.strath.ac.uk
2. Mull and Iona Community Trust
Royal Buildings, Main Street, Tobermory, Isle of Mull, PA75 6NU, Scotland, UK. phone: +44 548 4651, fax:+44 4651 4872, e-mail: terry@mull.ndo.co.uk
3. Greenfinch Ltd The Business Park,
Coder Road, Ludlow, Shropshire, SY8 1XE, England, UK. phone: +44 548 4651, fax:+44 4651 4872, Web: www.greenfinch.co.uk
Abstract. In-situ use of biomass and organic waste streams
have the potential to provide the key to energy self sustainability for islands and remote communities. Traditionally biogas fuels have been used in combustion engines for electric power generation. However, fuel cells offer the prospect of achieving higher generating efficiencies, and additionally, important environmental benefits can be achieved by way of mitigating greenhouse gas emissions, whilst providing a carbon sink. This paper presents the design details of a biogas gas plant and fuel cell installation that will provide a practical solution on an island (and be applicable in other remote and rural areas) where connection to the grid can be expensive, and where biofuels can be produced on site at no significant extra cost.
Keywords
Biomass, Biofuels, Organic waste, Anaerobic Digestion, Fuel Cells, Reformers.
1. Introduction
Community interests on the Isle of Mull, an Island off the West Coast of Scotland are collaborating with specialists to assess the feasibility and implications of local biogas production with a view to reforming the methane produced to provide hydrogen to power a fuel cell installation.
The Mull and Iona Community Trust is a community led partnership and is supported by funding from Shell Better Britain Campaign to promote practical alternatives to landfill disposal of local waste. A successful outcome will achieve social, environmental and economic benefits for the Island.
Mull is Scotland’s fourth largest island, sparsely populated by fewer than 3000, but with hundreds of thousands of visitors every year. Seasonal tourism is increasingly central to the islands economy, and the high quality of the natural environment is also vital to local fishing, aquaculture and agriculture interests.
Practical arrangements for diversion and recovery of value from the estimated 3,500 tonnes of material annually land-filled are, as yet, poorly developed. Whilst
mainland approaches tend not to be readily transferable to remote islands, local solutions may be more readily applicable elsewhere.
Mull’s abattoir helps to sustain the livelihoods of local farmers and crofters, but costly overheads, associated with regulatory compliance, may threaten the future viability of operations. With increasingly stringent conditions being applied to the disposal of animal by-products to landfill, early implementation of environmentally benign alternatives are essential. This project also aims to take a holistic view of the cost effective disposal arrangements for other non-municipal organic wastes, including particularly slurry, sewage sludge and aquaculture wastes.
The project will demonstrate that a biogas plant producing methane for applications such as (i) boiler heating, (ii) combustion engine electricity generation, and (iii) methane reforming for use in a fuel cell represents a solution. The methane/hydrogen fuel cell will operate in CHP mode alongside a cheese making facility on the island. The main regulatory drivers and technical details of the scheme are now presented, together with the waste analysis audit on which the project has been designed [1].
2. Impending EU Regulations
In the UK, biogas biotechnology for the treatment of organic wastes meets the strategic objectives of both existing and impending legislation, mostly emanating from the European Union (EU).
A. EU Landfill Directive
increasing pressure for alternative means of disposal which are neither landfill nor incineration.
B. EU Animal By-Products Regulation
The EU Animal By-Products Regulation became law in Scotland in 2003. This regulation specifies how certain materials may be safely disposed, i.e. with minimum risk to animal health. The regulation defines three categories of materials:
1. Category 1 Material is high-risk and must be incinerated; this includes specified risk material from abattoirs and catering waste from international transport;
2. Category 2 Material is medium risk and must be incinerated or rendered; this includes fallen stock and animals which have failed inspections at the abattoir;
3. Category 3 Material is low risk and may be transformed in a composting or biogas plant; this includes some products from abattoirs (e.g. blood and soft offal), factory food waste, supermarket food waste and catering waste from domestic and commercial kitchens.
The regulation specifies exacting parameters for composting and biogas plants which transform category 3 materials, in particular:
• The process must be in vessel;
• Particle size of all material must be reduced to less than 12 mm;
• There must be a pasteurisation stage, with no by-pass, where all material is held at a minimum temperature of 70oC for a minimum period of one hour;
• Procedures must be adopted to prevent recontamination of the final product with raw material;
• Salmonella must be eradicated, and enterobacteriaceae substantially absent.
Note: Any biogas plant will need the approval of the state veterinary service, who will scrutinise the designs, operating procedures and HACCP (hazard analysis and critical control points) prior to construction, and then supervise verification procedures after the commissioning phase. After final approval the biogas plant will be subject to inspections by the local trading standards office. The fuel cell installation will require separate regulatory compliance.
C. Draft EU Biowaste Directive
The directive was due to be prepared by the end of 2004, and if adopted in its current draft which was prepared in 2001, local authorities will be forced to collect food waste separately. This being so in order that it may be safely and beneficially utilised for improving the quality of soil across Europe; this is being depleted of organic material by the widespread use of “artificial” fertilisers. Biogas technology, as well as composting, is able to safely (i.e. with the eradication of pathogenic organisms
through pasteurisation) transform biowaste into fertiliser and soil conditioner.
In summary, these three key pieces of legislation, when linked to the strategy to develop a low-carbon economy, present a significant opportunity to biogas and fuel cell technology.
3. Waste Audit
The design of the biogas plant and fuel cell installation was based upon the waste audit carried out on the Island [1,2]. Table 1 lists the amount of waste available and the resulting dry solids (DS) and volatile solids (VS) available on an annual basis.
[image:2.595.321.542.367.533.2]Because of the uncertainties arising from the waste audit, it was considered advisable to include the potential of “wet” energy crops. In Germany farmers are growing maize, fodder beet and ryegrass specifically as a feedstock for their biogas plants. Using figures achieved to date, and verified by research work from Germany, one hectare will yield 12 tonnes of dry matter per year, producing 7,500 m3 of biogas. The study assumes that 20 hectares could be made available for wet energy crops, e.g. rye grass, Figure 1.
Figure 1. Ryegrass grown specifically as an energy crop.
The use of energy crops has a number of additional benefits for the project:
• The biofertiliser can be used specifically to grow the energy crops.
• As farming economics become more
challenging it is inevitable that more land will be taken out of food production.
• If ryegrass is grown as a non-food crop then the landscape, which is so important to the area, will have the appearance of traditional farms.
• It makes a significant further contribution to sustainability.
4. Mass & Energy Balance
D. Digestate Storage
[image:3.595.372.491.78.232.2]resulting energy and heat balance breakdowns are shown in Tables 2 and 3.
Table 1. Mass Balance.
Total Feedstock Delivery
Total Feedstock
Delivery 8,262 tonnes per year Dry Solids
Concentration 9.9 % Volatile Solids
Concentration
84.5 %
Dry Solids 821 tonnes per year
Volatile Solids 694 tonnes per year
Volatile Solids
Destruction 59.8 % Volatile Solids
Destroyed 415 tonnes per year
[image:3.595.73.254.92.296.2]Figure 3. Separated solids from slurry at Sgriob-Ruadh farm.
Table 3. Annual heat and electricity production.
Combined Heat & Power
Biogas Fuel Value 282 kW (fuel)
Efficiency of Electricity Production
35 %
Electricity Production 99 kW(elec)
“ “ 2,367 kWh per day
Efficiency of Heat
Production 50 % Heat Production 141
kW(heat)
“ “ 3,381 kWh per day
“ “ 12,171 MJ per day
Number of Days
Maintenance 20 days per year CHP availability 95 % Annual Electricity
[image:3.595.342.520.263.515.2]Production 816 MWh per year Table 2. Energy Balance.
Energy Production
Biogas Production 1,136 m3 per day
“ “ 47 m3 per hour
Biogas % Methane 60.0 % Biogas Calorific Value
(LCV)
21.4 MJ per m3
Biogas Fuel Value 24,343 MJ per day
“ “ “ 1,014 MJ per hour
“ “ “ 282 kW(fuel)
5. The Biogas Plant
The core process of biogas technology (Figure 2) is anaerobic digestion, which is a natural biological process by which organic material is stabilised and transformed into valuable biofertiliser and biogas; the composition of biogas is normally about 60% CH4 and 40% CO2, with traces of H2S, which makes it a valuable source of renewable energy.
Digested and pasteurised digestate is pumped to an enclosed storage tank, capacity 470 m3, where it is held before further storage and utilisation. The gas space is connected to the gas holder. There may be a need for further storage comprising a lagoon or slurry-store; the decision on this will depend on how it is planned to make beneficial use of the biofertiliser. For example, it might be transferred to the farm where it is to be used for further storage, Figure 3.
[image:3.595.75.254.294.455.2]E. Value of Energy
Table 4 itemises the value of the energy produced by the biogas plant.
6. The Fuel Cell System
The alkaline based FC (AFC) combined heat and power (CHP) unit will be field trialled at Sgriob-Ruadh cheese making facility, Tobermory, Mull [4]. The FC unit will be installed external to the cheese making house at Sgriob-Ruadh farm, and will be capable of supplying a Figure 2. Biogas Plant (Anaerobic digester and waste storage
[image:3.595.68.268.580.729.2]portion of the electricity and heat energy demand of part of the manufacturing process. We consider AFC technology to offer significant advantages over other fuel cell types such as proton exchange membrane (PEM) technology for external use due to the very low freezing point of the potassium hydroxide electrolyte (~-500C). Alkaline fuel cells are suitable for stationary and mobile power applications, as are Proton Exchange Membrane Fuel Cells (PEFC) and Direct Methanol Fuel Cells (DMFC). However, the AFC uses less noble materials and has a simpler design. AFC stack units are available at a lower cost/kW of FC stack, and they are forecast to remain the cheapest FC technology due to the lack of expensive platinum catalyst (PEM), or high temperature ceramic materials - as used in solid oxide fuel cells (SOFC). The inherent performance and cost advantages of an alkaline electrolyte can be ascribed to two key factors. The higher kinetics involved in the oxygen reduction reaction (ORR) in alkaline solutions over acidic media, permits the use of a reduced quantity of precious metals for a given over-potential. This results in a greater efficiency for the AFC when compared to PEM as well as a large margin for cost reduction. Secondly, the alkaline media (i.e. KOH) is less aggressive/corrosive to metal and carbon than acid. The less-corrosive nature of an alkaline environment ensures a potential greater longevity and allows the implementation of non-noble catalysts, both for the cathode and the anode. Low cost structural materials such as nickel current collectors and plastic composite frames are also stable in contact with KOH.
Table 4. Value of energy.
Value of Energy
Gross Electricity Output 816 MWh/yr Process Electricity
Consumption (8%) MWh/yr 66 Surplus Electricity Production 751
MWh/yr Unit Value of Renewable
Electricity 65 £ per MWh Value of Electricity 53,072 £ per
year Gross Heat Output 1,234
MWh/yr Process Heat Consumption 610
MWh/yr Surplus Heat Production 624
MWh/yr Unit Value of Renewable Gas 14 pence per m3 Value of Surplus Heat 20,496 £ per
year
Total Value of Surplus Energy
73,568 £ per year
The FC unit will be fuelled by hydrogen gas produced by reforming a portion of the biogas output from the plant [3,5]. The 2.4kWe alkaline fuel cell CHP system, complete with a lead acid battery storage system, is arranged schematically as shown in Figure 7. Additionally, the fuel cell/battery hybrid unit will operate as a grid connected renewable power generator, via a suitable inverter, with a dedicated load controller to
off-set electricity demand. The thermal energy produced by this unit will be used to augment the cheese process existing heating system.
F. Alkaline Fuel Cell Operation
A basic individual alkaline fuel cell (as shown in Figure 4) is composed of anode (negative electrode) and cathode compartments with an alkaline electrolyte sandwiched in the middle. Gaseous hydrogen fuel is fed into the anode while an oxidant enters the cathode. The electrochemical reactions take place on the interface areas of anode and cathode where the dissolved gases and the electrolyte (KOH) come in contact in the presence of a catalyst (typically platinum for PEMFC’s). Furthermore, because the electrolyte is liquid the interface area within the catalyst area is much larger than in a PEFC. This in turn results in higher power output compared to PEFC units of the same active area and reaction conditions (pressure, temperature). The energy generated is in the form of electricity and heat with water produced as a by-product.
Hy
drogen
Gas C
h
ann
el
Ai
r
Gas C
h
ann
el
Gas Dif
fusion Laye
r
Gas Dif
fusion Laye
r
KOH
OH -K+
Air in Water out Hydrogen in
Water out
Air out
Hydrogen out KOH in
KOH out
Anode Cathode
Catalyst Lay
er
Catalyst Lay
er
Nickel Current collector mesh
Load
e
-Figure 4 Basic Alkaline Fuel Cell (AFC) module.
In an oxidation process on the anode the hydroxide ions react with the hydrogen and as a result water is generated and electrons are delivered to an external electric circuit:
−
− ⇔ +
+2OH 2H O 2e
H2 2 (1)
In a reduction process on the cathode side the oxygen combines with electrons from the external electric circuit and water to form hydroxide ions:
− − ⇔
+
+H O 2e 2OH
O 5 .
0 2 2 (2)
Hence the overall reaction of the hydrogen/oxygen AFC can be expressed as:
O H 2 O 5 . 0
H2+ 2⇔ 2 (3)
G. The equilibrium or reversible potential
[image:4.595.61.267.430.677.2] [image:4.595.64.266.434.680.2]R Universal gas constant [8.314 J mol-1 K-1]
important parameter in the calculation of the cell maximum efficiency.
zi Number of moles of product species i [/]
In a fuel cell the chemical energy of the reactant species is directly transformed into electrical energy. Because of thermodynamic limitations, only a part of this chemical energy can be theoretically transformed into electrical energy, (similar to the enthalpy). The part that is transferable into electrical energy is called the Gibbs reaction enthalpy ∆G. For many species both values, the reaction enthalpy ∆H and the Gibbs reaction enthalpy
∆G, are experimentally determined and available form thermodynamic textbooks.
zj Number of moles of reactant species j [/]
Π[…]prod Product of parameter of product species
Π[…]react Product of parameter of reactant species
The Gibbs enthalpy for standard conditions ∆G0 for a hydrogen/oxygen generation to react to water at standard conditions is given as:
∆G0= -237.3kJ mol-1
Which in turn leads to the standard cell potential E0: E0 = 237300 J mol-1 / (2*96487 C mol-1)
E0 = 1.229V The relationship between this energy and the equilibrium
or open circuit voltage is given by the following
equation: For a general hydrogen-oxygen reaction the Nernst
equation can now be defined as: OCV
nFE
G=−
∆ (4)
where: − = 5 . 0 O H O H 0 2 2 2 p p p ln F 2 RT ) T ( E
E (8)
∆G Gibbs enthalpy of reaction [J]
n Number of electrons exchanged in
reaction [/]
F Faradaic constant [96487 C mol-1]
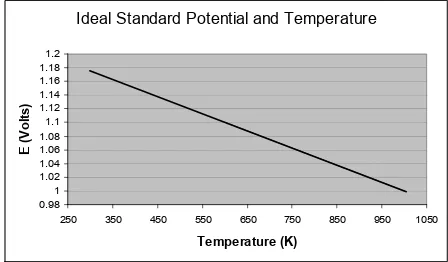
The open circuit potential is thus an approximate linear function of temperature, as shown in Figure 5.
EOCV Equilibrium potential or Open Circuit Voltage [V]
When the reactants and products exist under standard conditions, (ambient pressure (p0=1.01325bar) and standard temperature (298.15K)), the equilibrium potential is referred to as the standard equilibrium potential, and is related to the standard Gibbs enthalpy for the reaction as follows:
Ideal Standard Potential and Temperature
0.98 1 1.02 1.04 1.06 1.08 1.1 1.12 1.14 1.16 1.18 1.2
250 350 450 550 650 750 850 950 1050
Temperature (K) E ( V o lt s ) (5) 0 OCV 0 nFE
G =−
∆
where:
∆G0 Standard Gibbs enthalpy of reaction [J] E0
OCV Standard Equilibrium potential or
Standard Open Circuit Voltage [V] Figure 5.Ideal standard potential vs. Temperature.
H. AFC Electrical Losses
Further, to calculate the Gibbs energy of reaction and the equilibrium potential, the Nernst relationship is introduced, eq.6. This combines the Standard Gibbs enthalpy with the Gibbs enthalpy under different conditions, i.e. temperature and pressure.
The theoretical EMF, which is achievable by a fuel cell, as determined by the Nernst Equation, is not achievable in reality. There are several sources of irreversible losses, which contribute to this, and they are commonly categorised as (i) activation losses, (ii) ohmic losses, and (iii) concentration losses. The ohmic losses are present at all current levels and are linear unlike the other two, which are logarithmic. Furthermore, the reaction rate losses are only present at low current densities while the gas transport loss is present at high current densities. These losses are illustrated in Figure 6.
[ ]
∏
∏
+ ∆ = ∆ react zj j prod zi i 0 p p ln RT GG (6)
or expressed using the equilibrium potential the Nernst equation can be re-written as:
The losses, referred to as overpotential η, are defined as the deviation of the theoretical potential Eth and the cell potential E:
[ ]
∏
∏
+ = react zj j prod zi i 0 OCV OCV p p ln nF RT EE (7)
FC
OCV E
E −
=
η (9)
where: where:
pI Partial pressure of species I [bar]
C iR A +η +η
η =
[image:5.595.332.556.375.506.2]Diffusion of products away from the electrode. The equation for the fuel cell therefore becomes:
At high current densities, mass transport limitations of reactants and products occur, principally due to the geometric design of the electrodes. This makes it difficult at high current densities, to provide enough reactants to the electrode surface which in turn limits the reaction rate.
C iR A OCV FC E
E = −η −η −η (11) where:
EFC Fuel cell potential [V]
EVOC Theoretical fuel cell potential [V]
ηA Activation losses [V]
ηiR Ohmic losses [V]
ηC Concentration losses [V] I. Schematic arrangement of FC Layout
The schematic arrangement of the fuel cell battery hybrid system is illustrated in Figure 7. The battery fraction is chosen to minimise the size and cost of the fuel cell element whilst supplying the variable load demand of part of the cheese factory process. The control emulators for the fuel cell unit and the overall fc/battery hybrid system are shown in Figures 8(a) and (b).
Cathode Activation
Cell Resistance
Anode Activation
Mass Transport
Cell Performance
FC Power [W/cm2]
Current density [mA/cm2]
Cel
l po
tent
ia
l [V]
1.4 1.2 1.0 0.8 0.6 0.4 0.2 0.0
0 200 400 600 800 1000 1200 1400
Theoretical Cell Potential [E0=1.229V]
3 1
2
4 Actual Open Circuit Potential
Theoretical Open Circuit Potential [EOCV = 1.229V] 0 Parasitic losses
7. Summary
The biogas plant and fuel cell system proposed is viewed as the key solution to promote a practical alternative to landfill disposal of local organic waste. It is anticipated that the successful outcome will achieve social, environmental and economic benefits for the Island. 6. Figure Ideal and actual fuel cell voltage-current
characteristics for a single cell.
This graphically illustrates the fact that the performance of a FC is mainly driven by the oxygen reduction limitations on the cathode. For a single cell the fuel cell potential can be expressed as:
elec , iR ano cat
FC E E
E = − −η (12)
It is recognised however that a biogas reformer/direct hydrogen fuelled low temperature FC CHP unit leads to expensive capital costs compared to other units. However, this trial will assist the partners to investigate the true costs of supplying reformed biogas hydrogen as a fuel (and not a chemical feedstock). This trial, the first in the UK operating on a reformed biogas hydrogen supply, will help to stimulate this demand and, with an order of magnitude cost reduction, will help achieve commercial competitiveness whilst delivering CO2 savings. It will also inform UK energy fiscal policy of the need to ensure hydrogen as a fuel remains zero-rated for duty purposes. where:
Ecat Cathode potential [V] Eano Anode potential [V]
ηiR,elec Ohmic losses within the electrolyte [V]
Where:
ano , C ano , iR ano , A ano , VOC ano E
E = −η −η −η (13)
and Additionally the trial will also offer the Mull and Iona
Community Trust a showcase demonstration unit from which other proposed schemes may benefit. The data from this trial will offer new substantive comparative information for power generation planning.
cat , C cat , iR cat , A cat , VOC cat E
E = −η −η −η (14)
The inherent electric resistance within the fuel cell causes ohmic losses, which arise from the ionic resistance of the electrolyte and electron resistance in the electrodes, and
in the current collector and terminal connections. References
[1] Terry Hegarty, Michael Chesshire, Sinclair Gair: Organic Electricity for Mull – a Feasibility Study. MICT, Royal Buildings, Tobermory, Isle of Mull, PA75 6NU.
Activation losses dominate at low current densities, caused by the kinetics of the charge transfer reaction across the electrode-electrolyte interface. Concentration losses within the fuel cell reaction takes place on the surface of the electrodes and within the catalyst layer. These are accounted for in terms of:
[2] Gair, S., Cruden, A., McDonald, I., Hegarty, T., and Chesshire, M.:’Organic Electricity Via Hydrogen’. 15th
Annual U.S. Hydrogen Conference and Hydrogen Expo USA. Los Angeles, California, April 26–30, 2004.
[3] R.J. Spiegel and J.L. Preston:’ Test results for fuel cell operation on anaerobic digester gas’. Journal of Power Sources, 2000. 86: p. 283-288.
Diffusion of reactants to the electrode
[4] Jeff Reade, www.isleofmullcheese.co.uk.
Absorption of reactants on the electrode [5] J. Vanherie, F. Marechal, S. Leuenberger, and D. Favrat: ‘Energy balance model of a SOFC cogenerator operated with biogas’. Journal of Power Sources, 2003. 118: p. 375-383. Transfer of electrons to or from the absorbed
reactant species
Hot water
H2 Thermal
output
Topology of FC CHP System
230V 60Hz
1φ
144V
Air
(O2 component)
Fuel
Fuel Conditioning
Electrical energy, consumer and grid
connection
Rechargeable Battery Pack DC/AC DC/DC
Electrical Output
Fuel Cell
[image:7.595.151.434.85.336.2]Hot Water Storage Heat Exchanger
Figure 7. Schematic arrangement of the fuel cell battery hybrid system.
[image:7.595.274.483.377.542.2] [image:7.595.107.227.378.542.2]