Heath, M.R. and Astthorsson, O.S. and Dunn, J. and Ellertsen, B. and Gaard, E. and Gislason, A.
and Gurney, W.S.C. and Hind, A.T. and Irigoien, X. and Melle, W. and Niehoff, B. and Olsen, K.
and Skreslet, S. and Tande, K.S. (2004) Comparative analysis of Calanus finmarchicus demography
at locations around the Northeast Atlantic. ICES Journal of Marine Science, 61 (4). pp. 698-708.
ISSN 1054-3139
http://strathprints.strath.ac.uk/18579/
This is an author produced version of a paper published in ICES Journal of Marine Science, 61 (4).
pp. 698-708. ISSN 1054-3139. This version has been peer-reviewed but does not
include the final publisher proof corrections, published layout or pagination.
Strathprints is designed to allow users to access the research output of the University
of Strathclyde. Copyright © and Moral Rights for the papers on this site are retained
by the individual authors and/or other copyright owners. You may not engage in
further distribution of the material for any profitmaking activities or any commercial
gain. You may freely distribute both the url (
http://strathprints.strath.ac.uk
) and the
content of this paper for research or study, educational, or not-for-profit purposes
without prior permission or charge. You may freely distribute the url
(
http://strathprints.strath.ac.uk
) of the Strathprints website.
Comparative analysis of
Calanus finmarchicus
demography at
locations around the Northeast Atlantic
M. R. Heath, O. S. Astthorsson, J. Dunn, B. Ellertsen,
E. Gaard, A. Gislason, W. S. C. Gurney, A. T. Hind,
X. Irigoien, W. Melle, B. Nieho
ff
, K. Olsen, S. Skreslet,
and K. S. Tande
Heath, M. R., Astthorsson, O. S., Dunn, J., Ellertsen, B., Gaard, E., Gislason, A., Gurney, W. S. C., Hind, A. T., Irigoien, X., Melle, W., Niehoff, B., Olsen, K., Skreslet, S., and Tande, K. S. 2000. Comparative analysis ofCalanus finmarchicusdemography at locations around the Northeast Atlantic.
Standardized time-series sampling was carried out throughout 1997 at seven locations around the Northeast Atlantic to investigate regional variations in the seasonal demography ofCalanus finmarchicus. Sites ranged from an inshore location in the North Sea, whereC. finmarchicusformed only a small component of the zooplankton (<10 mgC m2during spring and early summer), to the shelf south of Iceland, and Weathership M in the Norwegian Sea, where the species dominated the zooplankton (>2000 mgC m2 during spring and summer). The internal consistency of the demographic time series from each site was investigated by three partial models of life-cycle processes. In general, the demography of late copepodites could be accounted for by a relatively simple forecast model of stage development and diapause. However, there was a large discrepancy between nowcast estimates of egg production based on female abundance, temperature, and chlorophyll, and hindcast simulations of the egg production required to account for the observed abundance of early copepodite stages. The results point to a gap in our understanding of seasonal variations in rates of egg production and/or survival of nauplii. Overall, the population sampled at Weathership M appeared to be reasonably self-contained, but all other sites were reliant on invasion of overwintered stock in spring. At least two generations were observed at all but one site, but the extent to which these were generated by discrete bursts of egg production varied between sites and seemed to be partly dependent on the proximity to an overwintering location.
Key words: Atlantic, egg production, modelling stage development, time-series sam-pling, zooplankton.
Introduction
The boreal copepod Calanus finmarchicus is widely
distributed in the North Atlantic Ocean, where it is usually by far the most abundant zooplankton species (Marshall and Orr, 1957; Matthews, 1969; Conover, 1988; Longhurst and Williams, 1992). At the northern limits of its distribution, e.g. north of Iceland, it occurs
along with the Arctic speciesC. glacialisandC.
hyper-boreus, while in the northeastern North Atlantic, in the North Sea, and in the southern part of the Norwegian
Sea it co-occurs with the southern formC. helgolandicus
(Conover, 1988). Based on CPR data, the distribution
area ofC. finmarchicusmay be divided into three large
subareas, each with its characteristic pattern of seasonal
development in surface waters (Planque et al., 1997).
These are south of Newfoundland, south of Greenland, and the northern and northeastern North Atlantic, including the Norwegian Sea. In the Northeastern Atlantic its abundance is generally low during winter (November–February), increases in March to a maxi-mum in May/June, and returns to low winter values by
September–November (Planqueet al., 1997).
Although the seasonal pattern of C. finmarchicus
biomass is generally similar on a large scale, available information indicates that on a smaller spatial scale the seasonal demography may vary considerably. Therefore the duration of the life cycle (and the number of
generations thatC. finmarchicusis able to produce in a
year) has traditionally been considered to be a function of latitude (i.e. temperature). In the southern parts of its distribution range (e.g. in the Iceland Basin or North
Sea), C. finmarchicusmay complete two or even three
generations per year (Gislason and Astthorsson, 1996; Irigoien, 1999), whereas in the northern parts (north of Iceland, northern Norway) it may achieve only one
generation (Tande, 1982; Falkenhaug et al., 1997;
Gislason and Astthorsson, 1998). This may depend on a number of factors, the most important probably being temperature and/or feeding conditions during reproduc-tion and cohort development. The tradireproduc-tional
interpret-ation of one generinterpret-ation of C. finmarchicus at the
northern limits of the distribution area and two or even three in the southern parts has recently been disputed by Irigoien (1999), who presents results from weather
sta-tion India (59N, 19W), which indicate that interannual
variations in local conditions, temperature, and
phyto-plankton may alter the number of generations thatC.
finmarchicusis able to produce per year.
There are few time series available that describe the
full annual cycle ofC. finmarchicuswith temporal
reso-lution in sampling of less than a month. Because of this, important events in the life history of the animals may have gone undetected. The Comparative Time-Series Sampling Programme in TASC sought to remedy this by increasing the frequency of sampling and by conducting
parallel programmes at a number of disparate sites throughout 1997. Comparing those data, and diagnos-ing the demography, is a formidable task, and to aid the process we have applied a number of models designed to highlight internal consistency within each time series, to test our hypotheses regarding the life-cycle dynamics and indicate the key features of the demography.
Material and methods
Field sampling
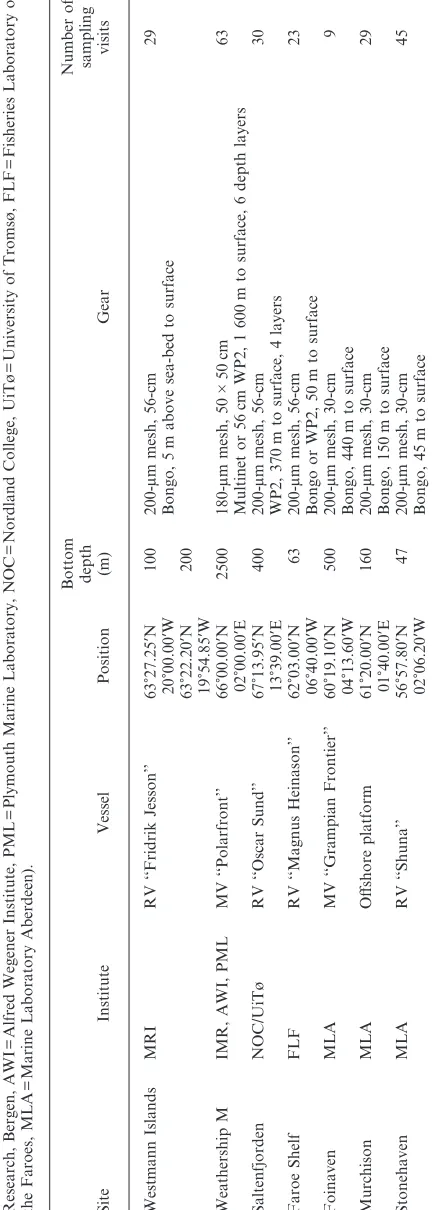
A coordinated programme of sampling was carried out at seven locations covering a latitudinal range from
57N to 67N during 1997 and extending into 1998
(Table 1, Fig. 1). The sampling interval varied between 1 and 14 d, depending on time of year and location, but averaged 12.5 d over all sites. At one site (Saltenfjorden), sampling did not commence until 1 April 1997, but continued until 20 April 1998. The 1998 data were therefore folded back into the beginning of the 1997 time series to obtain an annual series comparable with the other sites.
At each site, zooplankton were sampled with 180–
200m mesh netting fitted to 0.07 m2
(30 cm diameter)
or 0.25 m2
(56 cm diameter) mouth area WP2 nets, Bongo nets or opening and closing multinets (Table 1).
A mesh aperture of 200m retains >95% of Calanus
finmarchicuscopepodite stage CI and 100% of CII and
later stages, but retains only a small proportion of naupliar stages (Nichols and Thompson, 1991). The nets were towed vertically from around 10 m above the
sea-bed to the surface at a speed of 30–40 m min1
, except at Weathership M, where sampling was confined to the upper 1600 m. The zooplankton samples were preserved in 4% neutralized formalin until later analysis in the laboratory ashore. Subsamples of at least 200
Calanusspp. specimens were sorted from aliquots of the
preserved samples and identified to copepodite moult
stage (CI–CV, and sex for CVI). At five sites, C.
finmarchicusco-occurred with C. helgolandicus, and in
those cases the two species were discriminated for stages CV and CVI, but could not be routinely distinguished
for CI–CIV. CV and female CVIC. finmarchicus were
distinguished from C. helgolandicus by microscopic
examination of the head shape and the curvature of the inner edge of the basal segment of the 5th leg. Male CVI of the two species were discriminated on the basis of the relative lengths of the endopod and exopod of the 5th leg. In samples that contained a mixture of C.
finmar-chicusandC. helgolandicusas CV–CVI, the abundances
of CI–CIV were apportioned between the two species
according to the ratio in the older stages.C. glacialiswas
present but scarce in samples from one site (Weathership
M), and this was treated in the same way as for C.
Table 1. Details of sampling locations, institutes responsible for sampling, and numbers of sampling occasions. (MRI = Marine Research Institute Ic eland, IMR = Institute of Marine Research, Bergen, AWI = Alfred Wegener Institute, PML = Plymouth Marine Laboratory, NOC = Nordland College, UiT ø = University of Troms ø , FLF = Fisheries Laboratory of the Faroes, MLA = Marine Laboratory Aberdeen). Site Institute Vessel Position
Bottom depth (m)
Gear Number of sampling visits Westmann Islands MRI RV ‘‘ Fridrik Jesson ’’ 63 27.25 N 20 00.00 W 100 m mesh, 56-cm Bongo, 5 m above sea-bed to surface 29 63 22.20 N 19 54.85 W 200 Weathership M IMR, AWI, PML MV ‘‘ Polarfront ’’ 66 00.00 N 02 00.00 E 2500 m mesh, 50 50 cm Multinet or 56 cm WP2, 1 600 m to surface, 6 depth layers 63 Saltenfjorden NOC/UiT ø RV ‘‘ Oscar Sund ’’ 67 13.95 N 13 39.00 E 400 m mesh, 56-cm WP2, 370 m to surface, 4 layers 30 Faroe Shelf FLF RV ‘‘ Magnus Heinason ’’ 62 03.00 N 06 40.00 W 63 m mesh, 56-cm Bongo or WP2, 50 m to surface 23 Foinaven MLA MV ‘‘ Grampian Frontier ’’ 60 19.10 N 04 13.60 W 500 m mesh, 30-cm Bongo, 440 m to surface 9 Murchison MLA O ff shore platform 61 20.00 N 01 40.00 E 160 m mesh, 30-cm Bongo, 150 m to surface 29 Stonehaven MLA RV ‘‘ Shuna ’’ 56 57.80 N 02 06.20 W 47 m mesh, 30-cm Bongo, 45 m to surface 45
[image:4.595.156.376.175.780.2]on the basis of carapace length according to Hirche (1991). The numbers of copepodite stages in each sample
were transformed to abundance (m2
) by reference to the volume filtered during each haul. At the two sites where depth-stratified sampling was carried out (Weath-ership M and Saltenfjorden), the abundances were cal-culated for the upper 100 m and for the whole sampled water column. Copepodite stage abundances were con-verted to population carbon biomass by reference to mean values of carbon content per stage (Table 2).
Water samples for analysis of chlorophyll a were
collected at the same date and location as the zooplank-ton samples. At the Westmann Islands, Faroe, and Weathership M, samples were collected at 10-m intervals between the surface and 50 m with water bottles. At Stonehaven, where the water column was well mixed
throughout the year, samples were collected at a depth of 5 m only. At Saltenfjorden, a single integrated sample from the upper 40 m was collected with a hose sampler. In each case, the samples were filtered onto either GF/C or GF/F glass fibre filters, pigments extracted in acetone,
and analysed spectrophotometrically. Data from
samples collected in the upper 50 m were averaged on each occasion. At two locations (Murchison Platform in the northern North Sea and the Foinaven site west of Shetland), it was not possible to collect water samples owing to the logistics of the programme. For those sites, long-term monthly average chlorophyll concentrations were calculated from archive data held at the Marine Laboratory, Aberdeen. The data used were from samples collected in the upper 50 m of the water column within a 60 km radius of each site between 1960 and 1998. A set of month-specific deviations from these long-term mean values was then applied for 1997 and 1998. The deviations were based on widespread sam-pling throughout the northern North Sea in 1997 and
1998 and hence reflected regional year-specific diff
er-ences in the timing and abundance of phytoplankton abundance.
Vertical profiles of salinity and temperature were obtained on each sampling date with a CTD or water bottles and reversing thermometers. The data were aver-aged over the upper 50 m for each sampling occasion. Only limited hydrographic data were obtained at three sites (Murchison Platform in the northern North Sea,
[image:5.595.63.490.172.418.2]Faroe-ShetlandChannel 4 365 14 Julian day T emperature ( ° C) 0 8 12 6 10 304 243 183 122 61 Foinaven 4 365 14 Julian day T emperature ( ° C) 0 8 12 6 10 304 243 183 122 61 Westmann Islands 4 365 14 Julian day T emperature ( ° C) 0 8 12 6 10 304 243 183 122 61 Faroe shelf 4 365 14 Julian day T emperature ( ° C) 0 8 12 6 10 304 243 183 122 61 Murchison 4 365 14 Julian day T emperature ( ° C) 0 8 12 6 10 304 243 183 122 61 Saltenfjorden 4 365 14 Julian day T emperature ( ° C) 0 8 12 6 10 304 243 183 122 61 Weathership M 4 365 14 Julian day T emperature ( ° C) 0 8 12 6 10 304 243 183 122 61 Stonehaven 60° 20° 70° N Longitude Latitude –20°W 65° 10° 0° –10° –200 –2000 –1000 –1000 –3000 –1000 –200 –200 North Sea Norwegian Sea 2000 Iceland Atlantic Ocean –2000 Norw ay –200
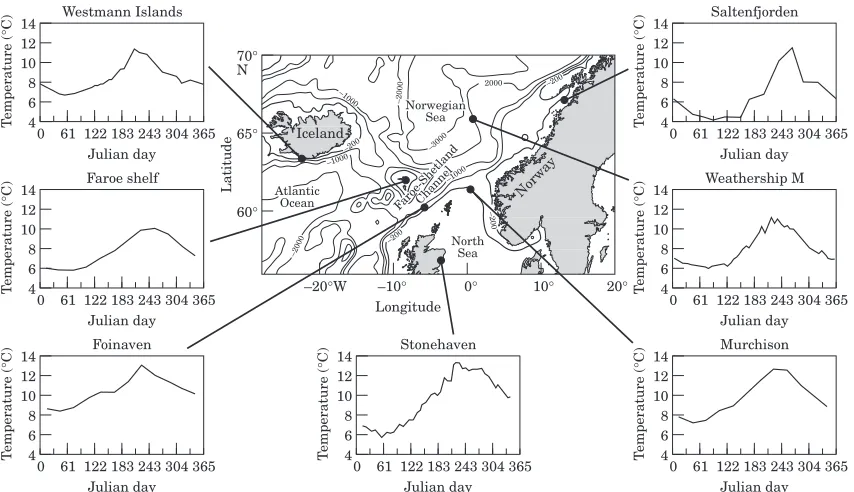
Figure 1. Locations of study sites and seasonal cycles of mean temperature in the upper 100 m (or surface to sea-bed where shallower).
Table 2. Mean carbon weights of copepodite stages used to convert stage abundances to biomass. Values assembled from data present by Hayet al.(1991) and Ingvarsdo´ttir (1998).
Copepodite stage gC individual1
[image:5.595.53.269.693.782.2]the Foinaven site west of Shetland, and the Faroe Islands). As in the case of chlorophyll data, temperature time series for those sites were constructed by reference to long-term archive data. Monthly deviations from the long-term mean temperature were then derived by refer-ence to the limited data collected during the programme, and to regional temperature anomalies from more widespread sampling.
Models
Three different models were applied to investigate diff
er-ent aspects of the time-series data from each site. The first model was designed to forecast the timing and abundances of copepodite stages CVI, CV, and CVI from the observations of CI, CII, and CIII. The second model hindcast the timing and abundance of the eggs that must have produced the observed abundances of stages CI, CII, and CIII. Both models used temperature-dependent rates of stage development. Some additional rules involving chlorophyll concentrations were incor-porated into the forecast model to represent factors triggering the onset of the resting state in CIV and CV. Finally, an egg production model was applied to nowcast the changes in daily population egg production over the year, from concurrent data on temperature, chlorophyll, and female abundance. Those results were compared with the results from the hindcast model to investigate the internal consistency of the data and models.
Hindcast and forecast models
The forecast and hindcast models were based on the
cohort model of Hind and Gurney (1998) and Hindet
al. (2000). The model represents the development and
changes in abundance of a group of identical copepods having the same birthdate and experiencing the same conditions of temperature and food. Stage development was represented by the continuous variable, c, whose value started at zero for newly spawned eggs and increased by 1 with each naupliar (NI–NVI) and cope-podite (CI–CVI) moult stage to a maximum of 13. The rate of change of c with time was described by a sequence of stage-specific temperature-dependent rates
of development (day1
), as derived from the data of
Tande (1988) and Campbell (pers. comm.) by Hindet al.
(2000). The model equations and parameters are given in the Appendix.
For CIV, CV, and CVI, two modes of development were invoked to represent either active growth and development to adult, or suppressed development repre-senting diapause. Development in the suppressed state proceeded as a fixed fraction of the
temperature-dependent rate at 5C, with a Q10relationship describing
the effects of temperature on development during
dia-pause. Entry to the suppressed development mode was
triggered by encountering food concentration below a
given threshold (FG) at any time between two
develop-ment points (ct1and ct2) that were located between the
start of CIV and the end of CV (10.0#ce1<ce2<12.0). An
option in the model allowed for diapause copepodites to
experience a different (lower) water temperature than
that in the upper 100 m. This facility was enacted at sites where hydrographic data indicated the presence of ther-mal stratification and where diapause copepodites were distributed in the deep.
Rate of development in diapause and sensitivity to temperature were parameterized from data presented by
Ingvarsdo´ttir (1998) and Ingvarsdo´ttiret al. (1999), who
measured the difference in respiration rate between
diapause and non-diapause stage CV copepodites at the
same temperature, and the effects of temperature on
respiration in diapause animals. These data indicated that metabolism was reduced by a factor of
approxi-mately 11 in diapause animals at 5C, and that diapause
respiration responded with a Q10of 2.1 over the range
0–7C.
The abundance of copepods in a cohort was simulated by assuming constant instantaneous daily mortality rates, and extrapolating the observed abundances of CI, CII, and CIII upwards in the case of the hindcast, and
downwards in the case of forecasts. Different rates of
mortality were assumed for eggs and nauplii, and for copepodites. A mortality penalty was imposed on
dia-pause stages at temperatures >4C, and a mortality
benefit at <4C, to represent the reduced predation rate
on overwintering animals in cold water.
For each study site, the observed abundances (m2)
of copepodite stages CI, CII, and CIII, and the tempera-ture and chlorophyll concentrations, were first interpo-lated lineally to daily resolution. Each daily incidence of CI, CII, or CIII was then treated as a separate cohort, and the hindcast or forecast models applied to each cohort in turn, with a time step of 1 h until the cohort attained the state of either the maximum lifespan of CVI (forecast model) or newly spawned eggs. Cohorts which extended forwards into 1998 (forecast model) or back-wards into 1996 (hindcast model) were ‘‘wrapped around’’ to the opposite end of the year and reintro-duced in the appropriate month of 1997. The cohorts were assumed to begin in mid-stage (c=7.5, 8.5, and 9.5 for CI, CII, and CIII, respectively), and the initial abundances were taken as the (interpolated) observed daily abundance at stage divided by the residence time in stage on that day, to take account of multiple represen-tation of copepodites from the same cohort in successive days of observed data. Stage residence time was esti-mated from the stage duration and the mortality rate (z;
residence time=stage durationez
). Simultaneous daily predictions of target stage abundance (eggs in the hindcast model, stages CIV, CV, and CVI in the forecast
source stage (CI, CII, or CIII) were then integrated. By this means, each of the three source stages provided independent estimates of daily target stage abundance, which were then averaged. Finally, the resulting daily resolution hindcasts or forecasts of target stage abun-dances were averaged over successive 14-d intervals through the year, corresponding to the typical sampling resolution of the original observations. Field observa-tions of target stage abundances for comparison with the model results were also averaged over 14-d intervals.
In use, the forecast model was applied to the CI–CIII abundance data from each site, with a simple optimiza-tion of the mortality rate applied to active state CI–CV. The mortality rate was adjusted within limits to mini-mize the sum of the root-mean-squared residuals of the forecast abundances of each of the target stages CIV, CV, and CVI, from the observed values. Similarly, the hindcast model was applied to the CI–CIII abundance data from each site, allowing only the mortality rate of eggs and nauplii to be adjusted within limits, to equili-brate the annual mean egg abundance with that esti-mated from the nowcast model (see below). Mortality
rate of CI–CIII was fixed at 0.005 d1
for the hindcast model runs, corresponding to the typical results of the forecast model.
Egg production nowcast model
Daily rate of population egg production was estimated from the observed time series of female abundance, chlorophyll, and temperature, after interpolation to daily resolution. Egg production was then converted to estimated egg abundance by multiplying by the egg stage residence time.
Hindet al. (2000) derived a relationship between rate
of egg production (adult1
d1
) and chlorophyll
con-centration from data presented by Hircheet al. (1998).
However, this was a simplified relationship that ignored temperature dependency and did not recognize any threshold chlorophyll concentration for the onset of egg production. Various authors have suggested that the onset of egg production requires a chlorophyll
concen-tration of between 0.2 and 2 mg m3
(8–80 mgC m3
, assuming carbon:chlorophyll=40). Laboratory
exper-iments in whichCalanushave been fed unialgal cultures
usually indicate a high threshold (>60 mgC m3
; e.g. Runge, 1985), but the majority of field observations
suggest a considerably lower threshold (<20 mgC m3
;
e.g., Richardsonet al., 1999). In part, the field results
may reflect the fact that Calanus is not exclusively
herbivorous. Based on the data of Richardson et al.
(1999), a food threshold of 0.2 mg chlorophyll m3
(8 mgC m3
) was incorporated into the functional
relationship of Hindet al.(2000), and the model refitted
to the data presented by Hircheet al.(1998).
In terms of temperature dependency of egg
produc-tion, data from Hircheet al.(1998) indicate a high Q10
value for egg production of between 4 and 5 for
tem-peratures in the range 0–8C. There are also laboratory
data which indicate that egg production is still possible
at temperatures as high as 15C, even though the species
is rarely found in the sea at temperatures in excess of
12–13C (e.g. Runge, 1985). Unfortunately, it is difficult
to merge all available laboratory information into a coherent data set to assess the temperature response over the full tolerance range.
An additional complication is that there appears to be a seasonal component to the rate of egg production of
females. Hircheet al.(1998) noted that females collected
during summer, which may have been first or second generation, produced markedly fewer eggs (<25%) under equivalent experimental conditions than females collected in spring, which were probably survivors of the overwintering stock. They suggested that endogenous factors may be involved. Alternatively, the composition of natural food consumed prior to the experimental incubations of summer-caught copepods may have
inhibited egg production. Similarly, Niehoffet al.(1999)
found that egg production per female during the days following the 1997 spring phytoplankton bloom at Weathership M was substantially less than would have been expected on the basis of laboratory-based relation-ships with temperature and algal biomass. To
summa-rize both the seasonal effect and the poorly quantified
upper temperature limit for egg production, temperature dependency was represented in the nowcast model by a
parabolic function which approximated to a Q10
response fitted to the data of Hirche et al. (1998)
between 4 and 6C, but decreased rather than increased
at higher temperatures, approaching zero at 13C
(Appendix and Table 6). The performances of the Q10
and parabolic response functions were evaluated by simulating the 1997 time series of rate of egg production at Weathership M from observed temperature and chlo-rophyll data, and comparing the results from both
models with the data presented by Niehoffet al.(1999).
In use, the nowcast model was applied to the observed female CVI abundance, temperature and chlorophyll data from each site, with no site-specific adjustment of
parameters. A fixed rate of egg mortality of 0.1 d1
was applied to estimate the stage residence time, the results being relatively insensitive to variations in this par-ameter compared to variations in stage duration as a result of the seasonal variations in temperature.
Results
Temperature and chlorophyll
Table
3.
Summary
details
of
Calanus
biomass
and
environmental
conditions
at
each
site.
Site
Annual
mean
temperature (C,
0
–
50
m)
Annual
geometric
mean
chlorophyll
(mg
m
3,0
–
50
m)
April
–
June,
mean
biomass
of
CI
–
CVI
Calanus
fi
nmarchicus
,
surface-maximum
sampling
depth,
0
–
100
m
in
parentheses
(mgC
m
2)
December
–
February,
mean
biomass
of
CI
–
CVI
Calanus
fi
nmarchicus
,
surface-maximum
sampling
depth,
0
–
100
m
in
parentheses
(mgC
m
2)
CV
–
CVI,
annual
mean
Calanus
helgolandicus
biomass
as
fraction
of
C.
fi
nmarchicus
+
C.
helgolandicus
Westmann
Islands
8.53
1
2617.8
138.4
0
Weathership
M
7.89
0.37
3157.1
(2218.3)
2248.0
(21.9)
0
Saltenfjorden
6.61
1.43
1086.7
(437.9)
1397.1
(38.7)
0.003
Faroe
Shelf
7.74
0.62
201.3
10.9
0.022
Foinaven
10.39
0.49
482.4
107.8*
0.013
Murchison
9.72
0.36
369
47.9
0.199
Stonehaven
9.58
0.94
6.5
0
0.708
*Based
on
sampling
in
January
and
February
1998.
The Murchison site, on the northern slope of the North
Sea, and the Weathership M site were also affected by
this inflow, but the sites at the Westmann Islands were
affected by Atlantic Water flowing onto the south
Ice-landic Shelf. The Faroe Shelf and Saltenfjorden sites experienced the coldest mean temperatures, the former being located within the tidal circulation around the Faroe Islands, and the latter receiving quantities of cold
snow-melt water from land run-off. In general, the
coastal sites showed the largest amplitude of seasonal
variation in temperature, and the offshore sites the
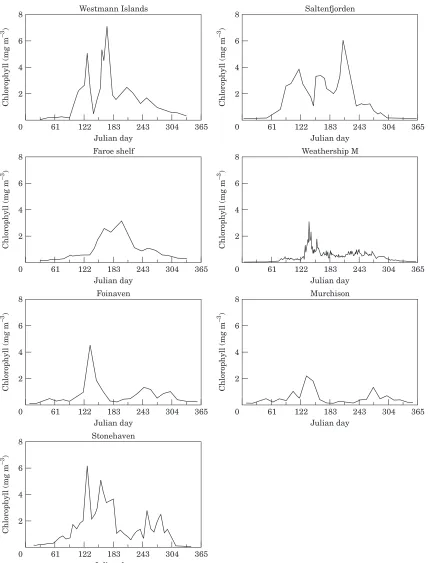
smallest (Fig. 1). Annual mean chlorophyll
concen-tration was in general lowest at the most offshore sites
and highest at the coastal sites (Table 3). There was strong coherence in the timing of the spring
phytoplank-ton bloom across the offshore and open shelf sites
(Westmann Islands, Foinaven, Weathership M and
Murchison), but a different seasonal pattern was
observed at the inshore sites (Saltenfjorden and
Stonehaven) and at the Faroe Shelf site (Fig. 2).
Calanusspp. biomass and stage abundances
At the northern edge of the study area, off the
Westmann Islands and at Weathership M, Calanus
finmarchicusand other Calanusspecies were the
domi-nant copepods in the 200-m mesh plankton catch.
During spring and early summer (April–June) at those
sites, the mean biomass ofC. finmarchicusin the upper
100 m exceeded 2 gC m3
(Fig. 3, Table 3). However,
off Stonehaven, at the southern edge of the study,
Calanus sp. accounted for only 2% of all copepods
averaged over the year, with a maximum contribution of
18%. Of the Calanus spp. present at Stonehaven, the
majority (70%) were C. helgolandicus, which was
especially abundant in autumn and early winter. The
spring/summer mean biomass of C. finmarchicus off
Stonehaven was <0.01 gC m3
(Fig. 3, Table 3). The
proportion ofC. helgolandicuswas highest in the North
Sea, and low (<3%) elsewhere (Table 3).C. hyperboreus
was caught at the Foinaven and Weathership M sites,
andC. glacialis at Weathership M, but data on those
species are not considered here.
At Weathership M and Saltenfjorden, where
depth-resolved sampling was carried out, the biomass of C.
finmarchicuscopepodites was concentrated in the upper
100 m in spring and early summer (April–June), and in the deeper layers (>100 m) during winter (December– February; Fig. 3, Table 3). The winter biomass at these sites, integrated to the maximum sampling depth, was comparable to that present during spring and summer (Table 3). However, the winter population consisted mainly of CV stages, whereas the spring/summer popu-lation contained a high proportion of juvenile copep-odite stages (CI–CIII; Figs 4, 5). In contrast, the depth-integrated winter biomass at each of the other sites was
small (0–20%) in comparison to that present during spring and summer (Fig. 3, Table 3), and there was no evidence of accumulating abundances of CV in winter (Figs 4–7). On the basis of these results, it is concluded that retention or accumulation of overwinter resting
stages of C. finmarchicusat the end of the productive
summer season occurred only at Weathership M and Saltenfjorden. At the other sites, summer production was presumably either exported or consumed by predators.
Forecast model
The fitted CI–CV mortality rates for each site from the forecast model are given in Table 4; they vary by a factor of 10 between extremes. Qualitatively good agreement was obtained between the forecast model and observa-tions of CIV and CV at the open shelf sites (Westmann Islands, Faroe Shelf, Foinaven, and Murchison; Fig. 8). The pattern of progression, from domination by CIV in early summer to domination by CV in autumn and winter, was successfully reproduced. However, the model systematically failed to reproduce the observed abundances of CVI copepodites in spring (fortnights 5–11). In other words, such abundances cannot be explained by internal dynamics from the incidences of CI–CIII. The conclusion is that those sites were sus-tained by spring invasion of CVI from remote overwin-tering abundances not represented in the samples. The forecast propagation of stage abundance at Foinaven suggested a single generation originating from a short burst of egg production in spring, but at the other shelf sites the pattern appeared to be one of prolonged production through spring and summer. Also at Foinaven, the observations suggested a secondary peak in CV and CVI abundance during fortnights 17 and 18 that cannot be explained by earlier abundances of CI–CIII. Presumably, these also were immigrants to the sampling site, possibly from Atlantic Water to the southwest.
A different pattern was observed at the open ocean
Weathership M site (Fig. 9). Here, the forecast model predicted low abundance of CVI during fortnights 3–9, arising from moulting of overwintered CV. The observed data on CVI and CV in the upper 1600 m through the year were variable, but it was clear that, in contrast to the shelf sites, high abundances of mainly CV remained at the end of the year. These were located at
depth in cold waters (<1C). By assuming a temperature
of 0.5C for diapause stages, the model was successful in
evi-0 365 8
Julian day
Chlorophyll (mg m
–
3 )
304 243 183 122 61 6
4
2
Stonehaven
0 365
8
Julian day
Chlorophyll (mg m
–
3 )
304 243 183 122 61 6
4
2
Foinaven
0 365
8
Julian day
Chlorophyll (mg m
–
3 )
304 243 183 122 61 6
4
2
Faroe shelf
0 365
8
Julian day
Chlorophyll (mg m
–
3 )
304 243 183 122 61 6
4
2
Westmann Islands
0 365
8
Julian day
Chlorophyll (mg m
–
3 )
304 243 183 122 61 6
4
2
Murchison
0 365
8
Julian day
Chlorophyll (mg m
–
3 )
304 243 183 122 61 6
4
2
Weathership M
0 365
8
Julian day
Chlorophyll (mg m
–
3 )
304 243 183 122 61 6
4
2
[image:10.595.51.479.185.748.2]Saltenfjorden
0
365 60
Julian day
C
. finmarc
hicus
mg C m
–
2
0 61 122 183 243 304
40
20
Stonehaven 0
365 2000
Julian day
C
. finmarc
hicus
mg C m
–
2
0 61 122 183 243 304
1500
1000
500
Foinaven 0
365 1000
Julian day
C
. finmarc
hicus
mg C m
–
2
0 61 122 183 243 304
800
600
200
Faroe shelf 0
365 10 000
Julian day
C
. finmarc
hicus
mg C m
–
2
0 61 122 183 243 304
8000
6000
4000
Westmann Islands
0
365 2000
Julian day
C
. finmarc
hicus
mg C m
–
2
0 61 122 183 243 304
1500
1000
500
Murchison 0
365 10 000
Julian day
C
. finmarc
hicus
mg C m
–
2
0 61 122 183 243 304
8000
6000
2000
Weathership M 0
365 10 000
Julian day
C
. finmarc
hicus
mg C m
–
2
0 61 122 183 243 304
8000
6000
2000
Saltenfjorden
400 4000
[image:11.595.63.490.179.737.2]4000 6000
dence was less clear from the observations. The second generation, which appeared in the model results as CIV between fortnights 17 and 21, was around an order of magnitude less abundant than the first.
The forecast model met with mixed success in explain-ing the population dynamics at the inshore sites (Saltenfjorden and Stonehaven; Fig. 9). At Saltenfjor-den, it was clear that the abundances of CV in winter were far higher than could be explained by the incidence of CI–CIII in summer, suggesting that the site was accumulating overwintering copepodites from a wide area. To represent this crudely in the forecast model, the
mortality rate of CI–CV (zc) was inverted to become an
accumulation rate. With this modification, the model produced a qualitatively respectable account of the observations and suggested the occurrence of two
dis-crete generations and a persistent overwintering stock of mainly CV. There were also two generations at Stonehaven, but the model failed to reproduce their relative magnitudes. This must have been either because of seasonal variability in mortality characteristics, or because the two generations were not internally con-nected and reflected production advected onto the site from elsewhere. Other factors point to the latter interpretation.
Nowcast and hindcast models
Comparison of Q10and parabolic temperature response
versions of the nowcast model, with the observed rates of egg production at Weathership M during March– May 1997 (Fig. 10) indicated that neither completely 365
20 000
Julian day
CVIm
Stage abundance (m
–
2 )
10 000
0 61 122 182 243 304
365
20 000 CVIf
10 000
0 61 122 182 243 304
365 40 000
CV 20 000
0 61 122 182 243 304
365 40 000
CIV 20 000
0 61 122 182 243 304
365
2000 CIII
1000
0 61 122 182 243 304
365
20 000 CII
10 000
0 61 122 182 243 304
365
20 000 CI
10 000
0 61 122 182 243 304
365 2000
Julian day
CVIm
Stage abundance (m
–
2 )
0 61 122 182 243 304
365
2000 CVIf
1000
0 61 122 182 243 304
365
40 000 CV
0 61 122 182 243 304
365
20 000 CIV
10 000
0 61 122 182 243 304
365 10000
CIII 5000
0 61 122 182 243 304
365
10 000 CII
0 61 122 182 243 304
365 10 000
CI 5000
0 61 122 182 243 304
[image:12.595.52.480.171.558.2]Westmann Islands Saltenfjorden
explained the near cessation of egg production following the algal bloom in mid-May. However, the parabolic response model was qualitatively superior in that it correctly predicted declining egg production following
peak chlorophyll concentration, whereas the Q10model
predicted the maintenance of rates >20 eggs female1
d1
.
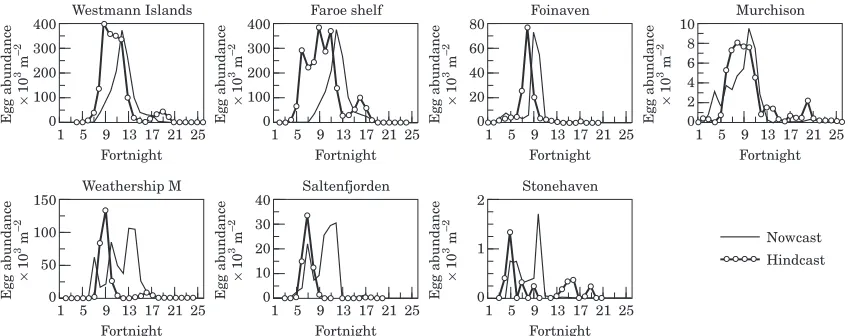
Results from the open shelf sites indicated moderate agreement between the hindcast and nowcast models, with approximately a factor of 3 variation in fitted rates of mortality between sites (Table 5). As with the forecast model, the overall conclusion was that an intense burst of spawning occurred at Foinaven in April/May,
whereas prolonged spawning occurred throughout
spring and early summer at the Westmann Islands, over the Faroe Shelf and at Murchison (Fig. 11). At all open
shelf sites, the nowcast egg abundance appeared to lag the hindcast abundance by around one month. This suggests inappropriate parameterization of the hindcast model leading to excessive stage durations, or enhanced survival of the early temporal components of the annual egg production, or that the sampled CI–CIII originated
from different geographical areas where seasonal profiles
of egg production differed significantly from those at the
sampling sites.
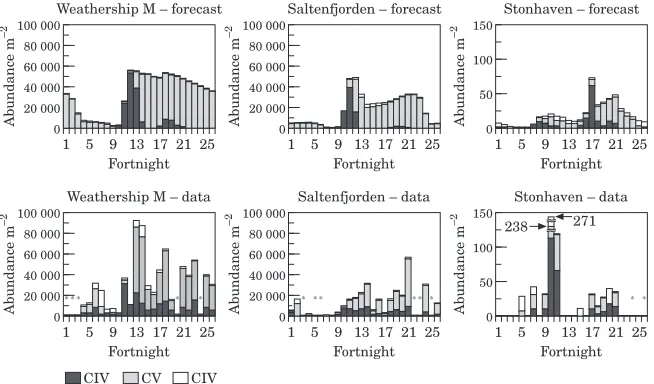
In contrast, at Weathership M there was a large discrepancy between the nowcast and hindcast model results (Fig. 11). The pattern of incidence of CI–CIII implied the production of two discrete generations with peak production during fortnights 9 and 16, the first more abundant than the second, and with very low production during midsummer (fortnights 11–14). The 365
2000
Julian day
CVIm
Stage abundance (m
–
2)
1000
0 61 122 182 243 304
365
4000 CVIf
2000
0 61 122 182 243 304
365
2000 CV
1000
0 61 122 182 243 304
365
2000 CIV
1000
0 61 122 182 243 304
365
2000 CIII
1000
0 61 122 182 243 304
365
2000 CII
1000
0 61 122 182 243 304
365
2000 CI
1000
0 61 122 182 243 304
365 20 000
Julian day
CVIm
Stage abundance (m
–
2 )
10 000
0 61 122 182 243 304
365
20 000 CVIf
10 000
0 61 122 182 243 304
365
50 000 CV
0 61 122 182 243 304
365 40 000
CIV 20 000
0 61 122 182 243 304
365 40 000
CIII 20 000
0 61 122 182 243 304
365
20 000 CII
10 000
0 61 122 182 243 304
365
20 000 CI
10 000
0 61 122 182 243 304
[image:13.595.66.490.173.560.2]Faroe shelf Weathership M
first peak (week 9) coincided with the onset of the spring phytoplankton bloom. In fact, females were abundant through summer and, according to the nowcast model, they should have been producing significant numbers of eggs, especially during fortnights 12–15.
As at Weathership M, there was a large discrepancy between the hindcast and nowcast model results at Saltenfjorden (Fig. 11). The hindcast model indicated two discrete generations, the second much less abundant than the first, with peak productions at fortnight 7, coinciding with the spring phytoplankton bloom, and fortnight 17. The nowcast model also indicated peaks in egg abundance of similar relative magnitudes at the same times, but also a large peak in egg abundance around fortnights 10–12. At Stonehaven, both the hind-cast and nowhind-cast models were in agreement that there were two extended periods of production during
fort-nights 5–10 and 14–19, but the relative magnitudes were
different from the two models.
Discussion
Overall distribution
The generic pattern of Calanus finmarchicus seasonal
abundance in the Northeast Atlantic identified by
Planque et al. (1997) differed in detail from that
observed at almost every site in the comparative pro-gramme. The spring invasion of shelf and surface waters by overwintered CVI resulted in peaks of population biomass at the sites fringing the Faroe–Shetland Channel, and those with indigenous overwintering stocks, namely Weathership M and Saltenfjorden. There, some of the highest values of water-column-365
2000
Julian day
CVIm
Stage abundance (m
–
2 )
1000
0 61 122 182 243 304
365
6000 CVIf
3000
0 61 122 182 243 304
365
6000 CV
3000
0 61 122 182 243 304
365
2000 CIV
1000
0 61 122 182 243 304
365
2000 CIII
1000
0 61 122 182 243 304
365
2000 CII
1000
0 61 122 182 243 304
365
2000 CI
1000
0 61 122 182 243 304
365 2000
Julian day
CVIm
Stage abundance (m
–
2 )
1000
0 61 122 182 243 304
365
2000 CVIf
1000
0 61 122 182 243 304
365
10 000 CV
5000
0 61 122 182 243 304
365
2000 CIV
1000
0 61 122 182 243 304
365
2000 CIII
1000
0 61 122 182 243 304
365
2000 CII
1000
0 61 122 182 243 304
365
2000 CI
1000
0 61 122 182 243 304
[image:14.595.54.480.174.554.2]Foinaven Murchison
integrated biomass were obtained in late summer and early winter owing to the accumulation of overwintering stock.
There was a clear latitudinal trend in both the biomass
of C. finmarchicus and its dominance over the sibling
speciesC. helgolandicus. However, there was no simple
relationship betweenC. finmarchicusbiomass and
chlo-rophyll or temperature, either on an annual mean basis, or within the annual cycle. This raises the question of exactly what factors determine latitudinal range of a species. The models applied in this study indicate that coupling between the life cycle and seasonal cycles of food and temperature, together with the proximity
of overwintering habitats, largely determine the
demography and productivity of C. finmarchicus at a
given site.
Forecast model
The central feature of the forecast model was a simple representation of diapause entry and duration,
elabo-rated slightly from that of Hindet al.(2000). Despite the
vital importance of diapause in the life cycle of C.
finmarchicus, understanding the regulating processes remains elusive. Hirche (1996) reviewed the information on diapause and identified a number of physiologically distinct phases, but was unable to identify the cues for
entry or emergence. Hindet al. (2000) summarized the
main hypotheses on factors governing diapause, and showed by application of simple models that environ-mental cueing of emergence date is not a prerequisite for synchronization of the life cycle to seasonal cycles in the environment. Plausible seasonal patterns of reproduc-tion can be obtained simply by assuming suppression of normal development rates while in diapause. Similarly, the factors determining whether an individual copep-odite accumulates lipid in readiness for overwintering, or proceeds to develop into a mature adult, remain obscure.
Most previous attempts at modelling the life cycle have ‘‘hardwired’’ the fraction of each generation entering diapause at a given developmental stage.
Following from Hindet al. (2000), we invoked diapause
entry by means of threshold food level encountered during a developmental window. As each cohort in the model has a unique phase relationship to the seasonal cycles of temperature and chlorophyll, the proportion entering diapause in a given period is an entirely dynamic property of the model. This representation of diapause entry rules by no means indicates that we
believe food concentration per se to be the key
factor, but it is logical that a copepodite should respond to food levels that may not support gonad development and maturation by initiating overwintering.
Undoubt-ably, the process is considerably more complex
than this. 365
20
Julian day
CVIm
Stage abundance (m
–
2 )
10
304 243 182 122 61
0 365
100
CVIf 50
304 243 182 122 61
0 365
CV
304 243 182 122 61
0 365
200 CIV
100
304 243 182 122 61
0 365
100
CIII 50
304 243 182 122 61
0 365
200
CII 10
304 243 182 122 61
0 365
20 CI
10
304 243 182 122 61
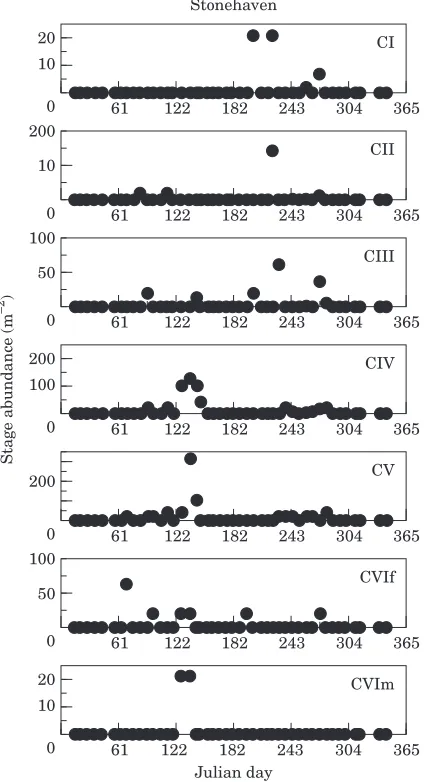
0 200
Stonehaven
[image:15.595.58.271.176.567.2]Figure 7. Measured abundances (surface to maximum sampling depth) of C. finmarchicus copepodite stages during 1997 at Stonehaven.
Table 4. Site-specific parameter values used in the forecast model.
Site
‘‘Best fit’’ CI–CV mortality rate zc
(d1)
Temperature for diapause stages
Westmann Islands
0.006 As for surface population
Weathership M 0.004 0.5C Saltenfjorden 0.004 4C
Despite the simplistic portrayal of diapause processes, the forecast model was in general successful in predicting the demography of stages CIV–CVI at the range of sites with only a minimum of site-specific parameter fitting. The range of mortality rates required to obtain semi-quantitative fits to the observations was comparatively small, with the exception of Saltenfjorden, where the demography was clearly dislocated by advective pro-cesses. From this we can conclude that the model was an adequate representation of the processes given the resolution of the observations.
Hindcast and nowcast models
There was a clear failure of the hindcast and nowcast models to agree in detail at most sites, especially at
Weathership M and Saltenfjorden. It is difficult to
interpret these discrepancies, which may be due to a
number of different causes. At open shelf sites the lag
between hindcast and nowcast model results may be suggestive of advective influence, the CI–CIII having been spawned at distant locations where the seasonal
profile of population egg production was different from
CIV CV CIV
0
25
50 000
Westmann Islands – data
Abundance m – 2 1 40 000 30 000 20 000 10 000
5 9 13 17 21
Fortnight
** * * * **
0
25
8000
Murchison – data
Abundance m – 2 1 6000 4000 2000
5 9 13 17 21
Fortnight
*** ** ***
0
25
4000
Faroe shelf – data
Abundance m – 2 1 3000 2000 1000
5 9 13 17 21
Fortnight
** * * * * *
0
25
6000
Foinaven – data
Abundance m – 2 1 4000 2000
5 9 13 17 21
Fortnight
** *** * *** * ** *****
0
25
50 000
Westmann Islands – forecast
Abundance m – 2 1 40 000 30 000 20 000 10 000
5 9 13 17 21
Fortnight
0
25
8000
Murchison – forecast
Abundance m – 2 1 6000 4000 2000
5 9 13 17 21
Fortnight
0
25
4000
Faroe shelf – forecast
Abundance m – 2 1 3000 2000 1000
5 9 13 17 21
Fortnight
0
25
6000
Foinaven – forecast
Abundance m – 2 1 4000 2000
5 9 13 17 21
Fortnight
[image:16.595.50.478.173.362.2]12696
Figure 8. Comparison of fortnightly averaged forecast model results and observed abundances of CIV, CV, and CVI at the Westmann Islands, over the Faroe Shelf, at Foinaven and at Murchison. Asterisks in the observation series indicate no sampling in a given fortnight period.
CIV CV CIV
0
25
100 000
Weathership M – data
Abundance m – 2 1 80 000 60 000 40 000 20 000
5 9 13 17 21
Fortnight
*** * *
0
25
100 000
Saltenfjorden – data
Abundance m – 2 1 80 000 40 000 20 000
5 9 13 17 21
Fortnight * * * * * * 0 25 150
Stonhaven – data
Abundance m – 2 1 100 50
5 9 13 17 21
Fortnight * * 0 25 100 000
Weathership M – forecast
Abundance m – 2 1 80 000 60 000 40 000 20 000
5 9 13 17 21
Fortnight
0
25
100 000
Saltenfjorden – forecast
Abundance m – 2 1 80 000 60 000 20 000
5 9 13 17 21
Fortnight
0
25
150
Stonhaven – forecast
Abundance m – 2 1 100 50
5 9 13 17 21
Fortnight
40 000
60 000
271 238
[image:16.595.102.429.415.607.2]that at the sampling sites. However, this is unlikely to be the case at Weathership M, which by all other measures appears to be relatively self-contained. We must there-fore conclude that the representation of some aspects of biology in the models is flawed.
The processes involved in the hindcast model govern only the rates of development and mortality. Although development rate is unlikely to be solely a function of temperature, the likely variability attributable to other
factors such as food does not seem sufficient to account
for the discrepancies between the models. However, it is conceivable that variation in the mortality rates of eggs and nauplii, which were assumed to be constant in the hindcast model, could have generated the discrepancies. Such variations could result in the survivors to stage CI being drawn selectively from discrete temporal compo-nents of annual egg production. This interpretation would be consistent with data on egg and nauplius
abundance collected at Weathership M (Hirche et al.,
1999), which indicate that, although adultC.
finmarchi-cusproduced eggs even at low concentrations of food
prior to the spring phytoplankton bloom, the survivors to late nauplii and CI stages arose mainly from eggs
produced during the onset of the bloom.
Turning to the nowcast model, the parabolic tempera-ture response function is a crude representation of both true temperature dependency and a documented, but poorly defined, food quality, seasonal or generation-based component to the potential egg production of females. The midsummer temperature in the upper
100 m at Weathership M is less than 10C, too low to
force cessation of egg production by the parabolic response function, but at the warmer open shelf sites, where the two models are in better agreement, the parabolic response does force a reduction in production. We conclude that there is a major gap in our under-standing of seasonal variations in rate of egg produc-tion. Lack of knowledge of the extent of carnivorous feeding may be partly responsible, but this does not help explain the gross discrepancies in rates of egg production during and after the spring bloom at, for example, Weathership M. We might expect carnivorous feeding to become more important after the spring phytoplankton bloom and thereby to increase egg production relative to chlorophyll in the post-bloom period; in fact, the reverse is the case. Simple relationships with food and tempera-ture seem not to be applicable over the whole spring and summer productive season, and some endogenous
fac-tors may be involved. The simple
temperature-dependent parabolic response form used here, though
successful in mimicking this effect at some sites, is not a
satisfactory basis for modelling, and cannot be applied in a standard form across all locations without the undesirable feature of site-specific parameterization.
Regional variations in demographic pattern
As well as testing hypotheses regarding life-cycle pro-cesses, the sampling programme was intended to inves-tigate regional variations in demography. The main conclusion in this regard is that proximity to overwin-tering sites is a key factor in determining whether discrete generations are produced at a site. Two discrete generations were observed at both Weathership M and Saltenfjorden, where high concentrations of overwinter-ing stages were sampled in the subsurface layers. The Foinaven site was close to, but not actually within, the overwintering site in the Faroe–Shetland Channel (Heath and Jo´nasdo´ttir, 1999), and a single discrete generation was observed there following the intense
spring invasion of overwintering stock onto the
continental slope region.
There was no significant overwintering at the open
shelf sites (Westmann Islands, Faroe Shelf, and
Murchison). There, production of eggs was continuous during spring and summer, with no clear temporal separation of generations. The reasons may be related to remoteness from overwintering aggregations leading to temporal ‘‘smearing’’ of the invasion of females in spring 0
160 50
Days from 1 January 1997
Eggs
–
1 da
y
–
1
80 40
140 120
100 30
20
10
OWS M data Parabolic model
Q10 model
Figure 10. Time series of observed rate of egg production (eggs female1d1) at Weathership M from Niehoffet al.(1998), together with nowcast model results incorporating the Q10 temperature response and parabolic temperature response.
Table 5. Site-specific parameter values used in the hindcast model (zc=0.005 d1;0.005 d1at Saltenfjorden).
Site
‘‘Best fit’’ egg – NVI mortality rate zj(d
1)
Westmann Islands 0.13
Weathership M 0.04
Saltenfjorden 0.01
Faroe Shelf 0.27
Foinaven 0.275
Murchison 0.08
as a result of advective and diffusive processes, and/or to the seasonal pattern of primary production in shelf waters. Two, or possibly three, generations were achieved at each of the open shelf sites. The lack of overwintering at the shelf sites must largely be due to hydrodynamic factors preventing physical retention, but it can also be linked to the temperature regimes. The forecast model predicted that copepodites attempting to overwinter in warm shelf water should emerge too early to contribute to the first generation of the following
year, so suffering high mortality. The implication
is that access to low temperature habitat is an
advan-tageous condition for colonization of a region by C.
finmarchicus.
The inshore sites (Saltenfjorden and Stonehaven) were
the most affected by advection. Saltenfjorden was clearly
an accumulating site, collecting overwintering stages from a much wider area than the immediate vicinity of the sampling site. Stonehaven was at the southerly limit
of the latitudinal range ofC. finmarchicus, and though
there were two clear periods of production, one in spring
and one in autumn, it was difficult to ascertain a
demographic connection rather than attribute it to advection of females into the area, because the species was almost absent through summer. Nevertheless, the pattern of production in 1997 was repeated in 1998 and 1999 (data not shown here), suggesting that, even if the two generations are not linked at the site, they do reflect
persistent demographic processes offshore.
Acknowledgements
Many personnel at all our Institutes provided essential support for this coordinated programme of sampling, both in the laboratory and in the field. These include
Robert Head (PML), Signe Johannessen (IMR), Ulrike Klenke (AWI), Morten Krogstad (NOC), Hildur Petursdo´ttir (MRI), Susan Robinson (MLA), Ian Watson (coxwain of the RV ‘‘Shuna’’), Ian Napier (North Atlantic Fisheries College, Shetland), and A. Timonin and T. Semenova from the Shirshov Institute of Oceanology, Russian Academy of Science. We are also grateful to the research vessel crews, to Oryx UK
Ltd and their safety officers on the Murchison Platform
for support with sampling in the North Sea, to Golar Nor Ltd, British Petroleum and the crews of the MV ‘‘Grampian Frontier’’ for support with sampling at the Foinaven oil-field west of the Shetland Isles, and the crew of MV ‘‘Polarfront’’ for support with sampling in the Norwegian Sea. The programme was partly sup-ported by European Union TASC project (MAS3-CT95-0039).
References
Conover, R. J. 1988. Comparative life histories in the genera
Calanus and Neocalanus in high latitudes of the northern hemisphere. Hydrobiologia, 167/168: 127–142.
Falkenhaug, T., Tande, K. S., and Timonin, A. 1997. Spatio-temporal patterns in the copepod community in Malangen, northern Norway. Journal of Plankton Research, 19: 449– 464.
Gislason, A., and Astthorsson, O. S. 1996. Seasonal develop-ment of Calanus finmarchicus along an inshore–offshore gradient southwest of Iceland. Ophelia, 44: 71–84.
Gislason, A., and Astthorsson, O. S. 1998. Seasonal variations in biomass, abundance and composition of zooplankton in the subarctic waters north of Iceland. Polar Biology, 20: 85–94.
Hay, S. J., Kiørboe, T., and Matthews, A. 1991. Zooplankton biomass and production in the North Sea during the Autumn Circulation Experiment, October 1987 to March 1988. Con-tinental Shelf Research, 11: 1453–1476.
0
25 150
Fortnight
Egg abundance
×
10
3 m
–
2
1 100
50
21 17 13 9 5
Weathership M
0
25 40
Fortnight
Egg abundance
×
10
3 m
–
2
1 20
10
21 17 13 9 5
Saltenfjorden
0
25 2
Fortnight
Egg abundance
×
10
3 m
–
2
1 1
21 17 13 9 5
Stonehaven 0
25 400
Fortnight
Egg abundance
×
10
3 m
–
2
1 200
100
21 17 13 9 5
Westmann Islands
0
25 10
Fortnight
Egg abundance
×
10
3 m
–
2
1 6
2
21 17 13 9 5
Murchison
0
25 400
Fortnight
Egg abundance
×
10
3 m
–
2
1 200
100
21 17 13 9 5
Faroe shelf
0
25 80
Fortnight
Egg abundance
×
10
3 m
–
2
1 40
20
21 17 13 9 5
Foinaven
30
300 300 60 8
4
Nowcast
[image:18.595.52.476.172.340.2]Hindcast
Heath, M. R., and Jo´nasdo´ttir, S. H. 1999. Distribution and abundance of overwintering Calanus finmarchicus in the Faroe–Shetland Channel. Fisheries Oceanography, 8: 40–60.
Hind, A. T., and Gurney, W. S. G. 1998. Life-cycle synchrony in a marine copepod. Archive fu¨r Hydrobiologie. Special Issue on Advances in Limnology, 52: 327–337.
Hind, A. T., Gurney, W. S. C., Heath, M. R., and Bryant, A. 2000. Overwintering strategies in Calanus finmarchicus. Marine Ecology Progress Series, 193: 95–107.
Hirche, H.-J. 1991. Distribution of dominant calanoid copepod species in the Greenland Sea during late fall. Polar Biology, 11: 351–362.
Hirche, H-J. 1996. Diapause in the marine copepod,Calanus finmarchicus– a review. Ophelia, 44: 129–143.
Hirche, H.-J., Brey, T., and Niehoff, B. 1999. A high frequency time series at Weathership M, Norwegian Sea. Population dynamics of Calanus finmarchicus. InTASC Final Report November 1999 (EU-MAS3-CT95-0039), Task 2.2, Annex 6, 18 pp.. Ed. by E. Halvorsen, and K. Tande. University of Tromsø, Norwegian College of Fishery Science. 74 pp. Hirche, H.-J., and Kwasniewski, S. 1997. Distribution,
repro-duction and development ofCalanusspecies in the northeast Atlantic in relation to environmental conditions. Journal of Marine Systems, 10: 299–317.
Hirche, H.-J., Meyer, U., and Niehoff, B. 1998. Egg production of Calanus finmarchicus: effects of temperature, food and season. Marine Biology, 127: 609–620.
Ingvarsdo´ttir, A. 1998. Seasonal changes in physiology and chemical composition of Calanus finmarchicus late copep-odite stages. PhD thesis, University of Aberdeen. 152 pp. Ingvarsdo´ttir, A., Houlihan, D. F., Heath, M. R., and Hay, S.
J. 1999. Seasonal changes in respiration rates of copepodite stage VCalanus finmarchicus(Gunnerus). Fisheries Ocean-ography, 8(Suppl. 1): 73–83.
Irigoien, X. 1999. Vertical distribution and population dynam-ics of Calanus finmarchicus at station India (5N, 19W) during the passage of the great salinity anomaly, 1971–1975. Deep-Sea Research I, 47: 1–26.
Longhurst, A., and Williams, R. 1992. Carbon flux by seasonal vertical migrant copepods is a small number. Journal of Plankton Research, 14: 1495–1509.
Marshall, S. M., and Orr, A. P. 1957. The life history of the copepodCalanus finmarchicusin different latitudes. Annales Biologiques, 33: 43–47.
Matthews, J. B. L. 1969. Continuous plankton records: the geographical and seasonal distribution ofCalanus finmarchi-cuss.l. in the north Atlantic. Bulletin of Marine Ecology, 6: 251–273.
Nichols, J. H., and Thompson, A. B. 1991. Mesh selection of copepodite and nauplius stages of four calanoid copepod species. Journal of Plankton Research, 13: 661–171. Niehoff, B., Klenke, U., Hirche, H.-J., Irigoien, X., Head, R.,
and Harris, R. 1999. A high frequency time series at Weath-ership M, Norwegian Sea, during the 1997 spring bloom: the reproductive biology ofCalanus finmarchicus. Marine Ecol-ogy Progress Series, 176: 81–92.
Planque, B., Hays, G., Ibanez, F., and Gamble, J. C. 1997. Large-scale spatial variations in the seasonal abundance of
Calanus finmarchicus. Deep-Sea Research, 44: 315–326. Richardson, K., Jo´nasdo´ttir, S. H., Hay, S. J., and Christoff
er-sen, A. 1999.Calanus finmarchicusegg production and food availability in the Faroe–Shetland Channel and northern North Sea: October–March. Fisheries Oceanography, 8: 153– 162.
Runge, J. A. 1985. Egg production rates ofCalanus finmarchi-cusin the sea offNova Scotia. Archiv fu¨r Hydrobiologie, 21: 33–40.
Tande, K. S. 1982. Ecological investigations on the zooplank-ton community of Balsfjorden, northern Norway: generation cycles, and variations in body weight and body content of carbon and nitrogen related to overwintering and reproduc-tion in the copepodCalanus finmarchicus(Gunnerus). Jour-nal of Experimental Marine Biology and Ecology, 62: 129– 142.
Tande, K. S. 1988. Aspects of developmental and mortality rates in Calanus finmarchicus related to equiproportional development. Marine Ecology Progress Series, 44: 51–58.
Appendix
Equations governing the forecast, hindcast, and nowcast models are given below. Values of the various par-ameters are given in Table 6.
Driving variables:
Tt=temperature at time t
Ct=chlorophyll (mg m
3
) at time t Derived variables:
ct=Development index at time t (0#ct#13)
st=Moult stage, st=int(ct) (st=0, eggs; st=1, NI; st=6,
NVI; st=7, CI; st=12, CVI)
d(s)t=development rate at time t=reciprocal of the stage
duration
Ft=food (mg m
3
) at time t
F,T=egg production rate (female
1
d1
) at food
con-centration Ftand temperature Ttat time t
Food concentration at time t,
Ft=r · Ct
Developmental equations:
Developmental index at time t (according to Hindet al.,
2000),
For c<11,
d(s)t=as(Tt)
bs
For cE11,
d(s)t=(as+(Tt)bs)
1
During resting in CIV or CV (cEce1#cx),
Equations describing reproductive output:
Egg production rate at 10C
F,10=p1· (FtFh)
Egg production rate at temperature Tt using a Q10
relationship,
Egg production rate at temperature Ttusing a parabolic