Vol.28 No.2, pp.23-29.
Overview of the labour
market
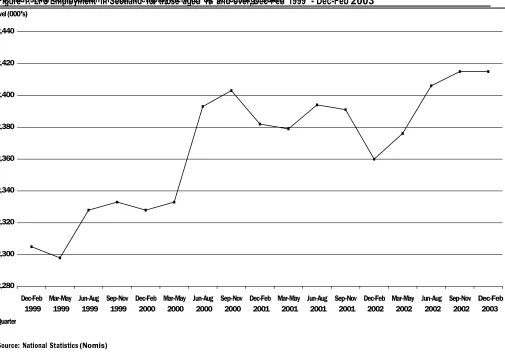
The latest figures on the labour market1 in Scotland are summarised in Table 1. Over the last quarter, Labour Force Survey (LFS) data show that the level of employment remained unchanged in the three months to Februar y 2003, at 2,415 thousand. Over the year to Februar y 2003, employment increased by 55 thousand. The employment rate - as a percentage of the working age population in employment - fell to 74.2 per cent, down 0.3 percentage points on the previous quar ter. Figure 1 provides an account of quarterly LFS employment over a two-year period to Februar y 2003.
The preferred measure of unemployment by the Interna- tional Labour Organisation (ILO) fell to 153 thousand during the period December to Februar y 20032. The ILO unemploy-
ment rate in the three months to February 2003 fell to 6.0 per cent. This represents a fall of 0.5 percentage points on the same period a year earlier (6.5 per cent).
Economic activity includes those individuals actively seeking employment and currently in employment (i.e. self-
employed, government employed, unpaid family workers, and those on training programmes). Table 1 shows that the level of those engaged in economic activity fell over the last quar ter. There were 2,568 thousand economically active people in Scotland during December to February 2002. This comprised 2,415 thousand in employment and 153 thousand ILO unemployed. Hence, taking account of the fall in ILO unemployment of 3 thousand and no change in the number of employed, the total number of economically active people in Scotland fell by 3 thousand between December to February 2003. The corresponding level for those economically inactive increased to 665 thousand, up 11 thousand on the previous quar ter.
Overall, the latest figures on the labour market suggest that the fall in economic activity may be partly attributed to the increase in economic inactivity, where less individuals may be actively looking for work, or available for work.
The traditional measure of Scottish claimant count unem- ployment - a count of claimants on unemployment related benefits - is detailed in Table 23. The most recent (season-
ally adjusted) claimant count figure for April 2003 stood at 98.8 thousand, which represents a fall of 300 on the previous month. The claimant count rate in April 2003 remained unchanged at 3.8 per cent for the fourth con- secutive month. This represents a marginal fall of 0.2 percentage points on the same period a year earlier.
Figure 2 plots ILO and claimant count unemployment as an index for the period Januar y 1999 to March 2003. Claim- ant count unemployment has been generally falling since
Januar y 1999, though remaining relatively steady over the year so far. By comparison, ILO unemployment has fluctu- ated more widely, but still on a downward trend, and most likely reflects movements between the level of employment and the number of people economically active at any one time. Hence, the difference between the ILO and claimant count definitions mirror the distinction between those actively seeking work (but are jobless) and those who are eligible for unemployment benefit payments.
Figure 3 illustrates the gap between Scottish claimant count unemployment against the level of unfilled vacan- cies, using data up until May 2002. By multiplying the number of vacancies by three - to account for under- reporting by job centres - it is evident from Figure 3 that the level of unfilled vacancies against claimant count unem- ployment
increased steadily between July 2000 and
Januar y 2001. This suggests a continued tightening of the labour market between this period, with some easing between January and June 2001 where the gap appears to narrow slightly.
The release of job centre vacancy statistics is still unfortu- nately delayed. National Statistics have deferred their release of updated figures due to distortions in the data since May 2001, resulting mainly from the introduction of Employer Direct4.
Labour Force Survey (LFS) data provides the industrial composition of the total number of individuals in employ- ment within Scotland. Table 3 shows that between March to May 2003, the percentage share of employment within manufacturing has fallen to 12.9 per cent. This figure represents a fall of 1 percent on the previous quarter - down from 13.9 percent in December to Februar y 2003. The share of employment within service industries in- creased to 74.9 per cent between March to May 2003, which represents an increase of 1 percent over the year so far.5 The percentage share of employment within the
Banking and Finance sector fell to 13.9 per cent between March to May 2003. These figures suggest that the share of employment over the last quarter have moved slightly away from the manufacturing sector and Banking and Finance, and towards the Services sector.
Vol.28 No.2, pp.23-29.
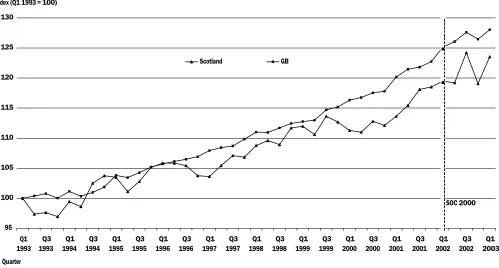
Table 5 and Figure 4 show the proportion of workers employed as managers and senior officials, professionals, associated professionals, and technical occupations. These professions can be grouped together under the classification ‘highly skilled jobs’. The most recent data (refer to Table 5) show that during December to February 2003 the share of highly skilled employment within Scot- land and Great Britain stood at 38 per cent and 40 per cent respectively. Figure 4 illustrates that the share of Scottish employment within highly skilled jobs has been rising steadily over recent years, but on the whole, continues to lag slightly behind Great Britain. However, more recently, the number of highly skilled jobs in Scotland increased by 6.1 per cent between December to February 2002 on the same period a year earlier, whilst increased slightly less by 3.5 per cent in Great Britain respectively.
Outlook
Scotland’s labour market continues to remain relatively stable in light of recent global uncer tainty. Overall, Scot- land’s employment performance continues to improve, and the number of people unemployed in Scotland is around its lowest level since records began. The employment rate has remained close to historically high levels at 74.2 per cent in the three months to February 2003. The claimant count rate remained unchanged at 3.8 per cent in April 2003, and current levels of claimant count unemployment remain low by historical standards. ILO unemployment fell slightly in the three months to Februar y 2003, with the unemploy- ment rate remaining relatively stable at 6.0 per cent over the same period. While there have been sings of some weakening in the Scottish labour market over the second half of 2001, continuing into 2002, the outlook remains healthy relative to historical standards. Overall, labour market sentiments are mainly optimistic, with expectations for relatively low unemployment over the next few years.
Endnotes
1. The Census 2001-consistent population figures at local authority level were released in Februar y 2003. This has allowed the production of interim regional LFS estimates. The population data only covers the periods up to mid-2001. The data presented here are taken mainly from NOMIS and are consistent with the na- tional LFS data currently being published in the Labour Market Integrated First Release (National Statistics).
2. All the seasonally adjusted claimant count series have been revised back three years (to January 2000), following the latest ONS annual review. The denomina- tors used to estimate the workplace-based regional and national claimant count rates have been updated and revised back to 1996. These workplace-based denomi- nators, which are no longer used to calculate rates for sub-regional areas, relate to the sum of claimants and workforce jobs for the corresponding mid-year (National Statistics).
3. The Labour Force Survey definition of ILO unemploy- ment takes precedence over the claimant count measure. ILO unemployment is much less sensitive to changes in the regulations governing unemployment benefit, and conforms to a widely accepted standard to allow for more meaningful cross-country comparisons.
4. Employer Direct involves transferring the vacancy- taking process from local Jobcentres, to regional Customer Service Centres (National Statistics).
5. Highly skilled jobs include sections 1-3 of the Standard Occupational Classification (SOC). Figure 4 illustrates the trend in the number of workers in highly skilled jobs between Q1 1993 and Q1 2003, as an index
(1993=100). However, pre-2001 data relates to SOC 1990, and post-2001 data relates to SOC 2000, therefore, the absolute levels of highly skilled jobs over this period should be interpreted with slight caution.
Vol.28 No.2, pp.23-29.
Table 1: Recent developments in the Scottish labour market
Employment* Sep-Nov 2001
Level (000s)
2,391
Rate (%)
73.7
Dec 2001-Feb 2002 2,360 72.6
Mar-May 2002 2,376 73.1
Jun-Aug 2002 2,406 74.1
Sep-Nov 2002 2,415 74.5
Dec 2002-Feb 2003 2,415 74.2
ILO Unemployment** Sep-Nov 2001 167 6.5
Dec 2001-Feb 2002 163 6.5
Mar-May 2002 173 6.8
Jun-Aug 2002 176 6.8
Sep-Nov 2002 156 6.1
Dec 2002-Feb 2003 153 6.0
Economically active* Sep-Nov 2001 2,558 78.9
Dec 2001-Feb 2002 2,523 77.7
Mar-May 2002 2,549 78.5
Jun-Aug 2002 2,582 79.6
Sep-Nov 2002 2,571 79.4
Dec 2002-Feb 2003 2,568 79.0
Economically inactive*** Sep-Nov 2001 667 21.1
Dec 2001-Feb 2002 706 22.3
Mar-May 2002 682 21.5
Jun-Aug 2002 646 20.4
Sep-Nov 2002 654 20.6
Dec 2002-Feb 2003 665 21.0
Source: National Statistics, Nomis (Labour Force Sur vey)
Notes:
(1) Interim LFS data taken from Nomis are in line with Census 2001-consistent population estimates at local authority level, and are comparable with the data in ONS UK Labour Market First Release.
(2) Data available up until 9 June 2003
Vol.28 No.2, pp.23-29.
Table 2: Claimant count unemployment*
(000’s) Claimant count
(seasonally adjusted)
Claimant flows (seasonally adjusted)
Claimant count (unadjusted)
Level Rate Off-flow On-flow Level Rate
2000 Januar y 123.2 5.0 27.5 27.5 134.0 5.2
February 122.6 5.0 29.3 28.5 133.5 5.2
March 122.4 4.9 29.0 28.3 130.6 5.1
April 119.0 4.8 29.1 26.4 123.6 4.8
May 118.4 4.8 29.4 28.7 120.6 4.7
June 116.5 4.8 29.1 26.7 117.3 4.6
July 115.1 4.8 29.2 27.4 121.9 4.8
August 113.5 4.8 29.1 27.2 120.8 4.7
September 112.1 4.7 27.7 27.1 109.7 4.3
October 111.7 4.6 27.6 27.1 106.5 4.2
November 110.7 4.6 27.8 26.8 106.4 4.2
December 110.4 4.5 26.9 27.2 108.0 4.2
2001 Januar y 108.8 4.4 27.1 27.1 119.3 4.5
February 108.1 4.4 27.9 27.1 118.9 4.5
March 107.6 4.4 27.6 26.7 115.8 4.4
April 104.9 4.3 27.9 25.4 109.7 4.1
May 104.7 4.3 26.4 25.7 106.7 4.0
June 104.2 4.1 27.0 26.6 104.7 4.0
July 102.4 4.1 26.7 26.0 108.2 4.1
August 103.2 4.1 26.4 27.2 109.4 4.1
September 103.5 4.0 26.3 26.8 100.5 3.8
October 104.6 4.0 26.9 28.1 99.2 3.7
November 105.6 3.9 26.7 28.0 101.2 3.8
December 105.3 3.9 27.3 27.3 102.5 3.9
2002 Januar y 104.0 3.9 27.2 27.2 113.6 4.3
February 103.1 3.9 26.9 26.3 113.1 4.3
March 102.6 4.0 27.3 27.1 110.2 4.2
April 104.1 4.0 26.8 28.1 108.4 4.1
May 102.7 4.0 29.4 27.8 104.7 4.0
June 102.4 3.9 27.2 27.3 102.9 3.9
July 101.5 3.9 26.8 26.6 106.8 4.1
August 101.1 3.9 27.0 26.7 106.9 4.1
September 101.3 4.0 26.6 27.0 98.1 3.7
October 100.8 3.9 26.8 26.3 95.5 3.6
November 100.6 3.9 26.4 26.3 96.6 3.7
December 99.7 3.9 26.8 26.6 97.5 3.7
2003 Januar y 99.6 3.8 25.0 26.7 109.8 4.2
February 99.7 3.8 26.4 26.5 110.7 4.2
March 99.1 3.8 27.0 26.2 107.2 4.1
April 98.8 3.8 26.8 26.3 103.4 3.9
Source: National Statistics, Nomis (Benefits Agency administration system)
Note:
QUAR TERLY ECONOMIC COMMENTARY
Table 3: Industrial composition of total in employment (LFS), percentage share
Vol.28 No.2, pp.23-29. Sep-Nov 2001
Manufacturing (%)
14.1
Banking & Finance (%)
13.5
All services (%)
73.8
Dec 2001 - Feb 2002 14.1 13.8 73.9
Mar-May 2002 14.1 13.8 73.9
Jun-Aug 2002 13.3 14.6 75
Sep-Nov 2002 13.7 14.5 74.5
Dec 2002 - Feb 2003 13.9 14.1 74.3
Mar-May 2003 12.9 13.9 74.9
Source: National Statistics, Nomis (Labour Force Sur vey)
Notes:
Where manufacturing covers SIC section D, banking and finance covers sections J and K and all services covers section G-Q
Table 4: Employee jobs by industry (000s)
All jobs (seasonally adjusted)
Agriculture Water Energy &
Forestry & Supplies Manufacturing Service Other
SIC92 All jobs
Fishing A-Q
Mining A,B
Industries C,E
Industries D
Construction F
Industries G-K
Industries L-Q
Dec-99 2,172 2,172 37 41 314 133 961 686
Dec-00 2,232 2,231 37 38 303 131 1004 718
Dec-01 2,282 2,288 35 45 295 116 1067 730
Mar-02 2,284 2,272 35 45 287 119 1050 735
Jun-02 2,261 2,262 35 44 286 113 1049 735
Sep-02 2,252 2,260 34 44 282 115 1,051 735
Dec-02 2,262 2,263 31 43 275 114 1,057 743
Source: National Statistics: Labour Market Statistics, Scotland (First Release, May 2003)
Table 5: Proportion of employment in highly skilled jobs
Scotland
Level (000’s) Rate (%)
Great Britain
Level (000’s) Rate (%)
Sep-Nov 2001 892,000 37 10,960,000 40
Dec 2001-Feb 2002 855,000 36 10,861,000 39
Mar-May 2002 887,000 37 10,995,000 40
Jun-Aug 2002 898,000 37 11,041,000 40
Sep-Nov 2002 896,000 37 11,182,000 40
Dec 2002-Feb 2003 907,000 38 11,239,000 40
Source: National Statistics, Nomis (Labour Force Sur vey)
Notes:
QUAR TERLY ECONOMIC COMMENTARY
Table 3: Industrial composition of total in employment (LFS), percentage share
Vol.28 No.2, pp.23-29.
Figure 1: LFS Employment in Scotland for those aged 16 and over, Dec-Feb 1999 - Dec-Feb 2003
Level (000's)
2,440
2,420
2,400
2,380
2,360
2,340
2,320
2,300
2,280
Quarter Dec-Feb
1999 Mar-May
1999 Jun-Aug
1999 Sep-Nov
1999 Dec-Feb
2000 Mar-May
2000 Jun-Aug
2000 Sep-Nov
2000 Dec-Feb
2001 Mar-May
2001 Jun-Aug
2001 Sep-Nov
2001 Dec-Feb
2002 Mar-May
2002 Jun-Aug
2002 Sep-Nov
2002 Dec-Feb
2003
[image:6.595.54.559.66.428.2]Source: National Statistics (Nomis)
Figure 2: Claimant Count and ILO unemployment in Scotland, January 1999 - March 2003
Index (January 1999 = 100)
110
105
CC Index ILO Index
100
95
90
85
80
75
70
Jan Mar May Jul Sep Nov Jan Mar May Jul Sep Nov Jan Mar May Jul Sep Nov Jan Mar May Jul Sep Nov Jan Mar
1999 2000 2001 2002
Month/Year
Source: National Statistics (Nomis)
QUAR TERLY ECONOMIC COMMENTARY
Table 3: Industrial composition of total in employment (LFS), percentage share
Vol.28 No.2, pp.23-29.
QUAR TERLY ECONOMIC COMMENTARY
[image:8.595.40.544.80.382.2]Vol.28 No.2, pp.23-29.
Figure 3: Scottish unemployment (claimant count) against the level of Scottish Vacancies*
Level (000's)
150
140
Unfilled Vacancies (000's) Claimant Count (000's)
130
120
110
100
90
80
70
Jan Feb Mar Apr May Jun Jul Aug Sep Oct Nov Dec Jan Feb Mar Apr May Jun Jul Aug Sep Oct Nov Dec Jan Feb Mar Apr May Jun
1999 2000 2001
Month/Year
Source: National Statistics (Nomis)
*Vacancies notified to job centres multiplied by three (latest figures available)
Figure 4: Employment in highly skilled jobs*, Scotland and Great Britain
Index (Q1 1993 = 100)
130
125
Scotland GB
120
115
110
105
100
SOC 2000
95 Q1 1993
Q3 1993
Q1 1994
Q3 1994
Q1 1995
Q3 1995
Q1 1996
Q3 1996
Q1 1997
Q3 1997
Q1 1998
Q3 1998
Q1 1999
Q3 1999
Q1 2000
Q3 2000
Q1 2001
Q3 2001
Q1 2002
Q3 2002
Q1 2003 Quarter
Source: National Statistics (Nomis)
[image:8.595.35.534.464.732.2]QUAR TERLY ECONOMIC COMMENTARY
![Overview of the labour market [February 2009]](data:image/gif;base64,R0lGODlhAQABAIAAAP///wAAACH5BAEAAAAALAAAAAABAAEAAAICRAEAOw==)