City, University of London Institutional Repository
Citation: Abdel-hay, A. (2018). Colour vision in diabetes. (Unpublished Doctoral thesis, City, Universtiy of London)
This is the accepted version of the paper.
This version of the publication may differ from the final published version.
Permanent repository link: http://openaccess.city.ac.uk/19699/
Link to published version:
Copyright and reuse: City Research Online aims to make research outputs of City, University of London available to a wider audience. Copyright and Moral Rights remain with the author(s) and/or copyright holders. URLs from City Research Online may be freely distributed and linked to.
City Research Online: http://openaccess.city.ac.uk/ [email protected]
COLOUR VISION IN DIABETES
Ahmed Abdel-hay
Doctor of Philosophy
City, University of London
Applied Vision Research Centre
Division of Optometry and Visual Science
2 CONTENTS
LIST OF FIGURES 5
LIST OF TABLES 7
ACKNOWLEDGMENT 8
DECLARATION 9
ABSTRACT 10
ABBREVIATIONS 11
1 THE VISUAL SYSTEM 1.1 ANATOMY OF THE EYE 1.2 PHOTORECEPTORS
1.3 INTRA-RETINAL PATHWAYS 1.4 POST-RETINAL PATHWAYS
1.5 VISUAL PROCESSING OF NORMAL TRICHROMATIC COLOUR VISION 13 13 18 20 23 23 2 INTRODUCTION
2.1 DIABETES MELLITUS 2.2 DIABETIC RETINOPATHY
2.2.1 Definition of diabetic retinopathy 2.2.2 Classification of diabetic retinopathy 2.2.3 Diabetic macular oedema
2.2.4 Epidemiology of diabetes and diabetic retinopathy 2.2.5 Pathophysiology of diabetic retinopathy
2.2.6 Management and treatment of diabetic retinopathy
2.3 DIABETIC RETINOPATHY AND COLOUR VISION
2.3.1 Retinal neurodegeneration in diabetes 2.3.2 Colour vision tests
2.3.3 Electroretinography 2.3.4 Microperimetry 2.3.5 Contrast sensitivity 2.3.6 Aim of study
29 29 30 30 31 35 35 38 44 47 47 52 61 61 62 63 3 METHODS 3.1 SUBJECTS
3.2 OPHTHALMOLOGICAL EXAMINATION
3
3.3 OPHTHALMIC INVESTIGATIONS AND IMAGING
3.3.1 Chromatic sensitivity
3.3.2 Optical coherence tomography
3.4 STATISTICAL ANALYSIS
67 68 74 77 4 RESULTS 4.1 SUBJECTS
4.1.1 Acquired causes of colour vision loss
4.1.1.1 Lens opacity
4.1.1.2 The effect of age on chromatic sensitivity 4.1.1.3 The effect of drugs on chromatic sensitivity 4.2 ANALYSIS
4.2.1 Group (1): No or mild NPDR
4.2.2 Group (2): Moderate to severe NPDR 4.2.3 Group (3): Active or treated PDR
4.3 CHROMATIC SENSITIVITY AND DIABETES
4.3.1 Effect of grade of retinopathy on chromatic sensitivity 4.3.2 Effect of duration of diabetes on chromatic sensitivity 4.3.3 Effect of control of diabetes on chromatic sensitivity 4.3.4 Effect of type of diabetes on chromatic sensitivity
4.3.5 Correlation between central subfield thickness and chromatic sensitivity 78 78 78 78 80 81 81 82 83 85 87 87 88 89 91 92 5 ACUITY AND COLOUR VISION CHANGES POST INTRAVITREAL
DEXAMETHASONE IMPLANT INJECTION IN PATIENTS WITH DIABETIC MACULAR OEDEMA
5.1 INTRODUCTION 5.2 METHODS 5.3 RESULTS
5.3.1 Descriptive data 5.3.2 Lens opacity
5.3.3 Change in RD and YB thresholds 5.3.4 Change in visual acuity
5.3.5 Change in Central subfield retinal thickness 5.3.6 Change in visual functions
94 94 98 102 102 103 103 105 106 109
6 DISCUSSION & CONCLUSIONS 112
4
APPENDIX B. PATIENT CONSENT FORM
APPENDIX C. LENS OPACITIES CLASSIFICATION SYSTEM III (Chylak et al., 1993)
125
127
5 LIST OF FIGURES
Figure 1-1: Anatomy of the human eye 13
Figure 1-2: Sectional anatomy of the eye 16
Figure 1-3: The different layers of human retina 17 Figure 1-4: The main structure of rods and cones 19 Figure 1-5: The Retinal circuits based on known anatomical connections 22 Figure 1-6: Hering's opponent colours schematic diagram 25 Figure 1-7: Schematic representation of Müller zone model 26 Figure 1-8: Normalized absorbance of the three human cone pigments 28 Figure 2-1: Diagrammatic representation of pathophysiology of diabetic
Retinopathy 38
Figure 2-2: Illustration of the Ishihara Pseudoisochromatic plate test 54 Figure 2-3: Illustration of the Farnsworth-Munsell 100 Hue test 56 Figure 2-4: Graphical representation of the D-15 cap arrangements 57 Figure 2-5: Illustration of the Lanthony’s Desaturated Panel 15 test 58 Figure 2-6: Illustration of the Nagel anomaloscope and the bipartite field 59 Figure 3-1: The appearance of the CAD test moving coloured stimuli
during the test together with the numeric keypad used to
record the subject’s responses 70 Figure 3-2: CAD test result for typical, normal trichromat plotted in the
CIE 1931 (x,y) chromaticity chart
71 Figure 3-3: Normal trichomats RG and YB thresholds for age 74 Figure 3-4: The standard 9 ETDRS subfields (Right) with their
corresponding overall mean RT measurements (Left) 76 Figure 3-5: The appearance of Heidelberg Spectralis SD-OCT 77 Figure 4-1: RG and YB thresholds measured in the diabetes group plotted
as a function of age together with the corresponding data for
normal, healthy trichromats 80 Figure 4-2: RG and YB thresholds in three groups. Group 1: No or mild
NPDR, group 2: Moderate to severe NPDR and group 3: Active
or treated PDR 88
Figure 4-3: Effect of duration of diabetes on measured RG and YB
Thresholds 89
Figure 4-4: Effect of glycaemic control on measured RG and YB thresholds 90 Figure 4-5: Effect of type of diabetes on chromatic sensitivity 91 Figure 4-6: Correlation between measured RG and YB colour thresholds
and CST (r2=0.15 and r2=0.20 respectively) 92
6
Figure 5-1: Graphs showing the effect of Ozurdex on measured changes
in Red-Green (RG) and Yellow/Blue thresholds 104 Figure 5-2: Graph showing the effect of Ozurdex on measured changes
in visual acuity (VA) 105
Figure 5-3: Graph showing the effect of Ozurdex on measured changes
in central sub-field thickness (CST) 106
Figure 5-4: Graph showing the change in central sub-field thickness (CST)
from baseline over the period of 24 weeks 107
Figure 5-5: The graphs show CAD results before and after Ozurdex
7 LIST OF TABLES
Table 2-1: National Screening Committee grading criteria (Harding et al.,
2003) 33
Table 2-2: Classification of diabetic retinopathy in the early treatment of
diabetic retinopathy study (ETDRS report 7, 1991) 34 Table 2-3: National Screening Committee management criteria / action
(Harding et al., 2003) 46
Table 4-1: Grades of lens opacities in subjects recruited in the study 79 Table 4-2: Subjects demographic and baseline characteristics for group 1
(no or mild NPDR) 82
Table 4-3: Subjects demographic and baseline characteristics for group 2
(moderate and severe NPDR) 84
Table 4-4: Subjects demographic and baseline characteristics for group 3
(Active or treated PDR) 85
Table 4-5: Showing the RG and YB thresholds for subjects within the 3
8 ACKNOWLEDGEMENTS
Firstly I would like to express my deepest gratitude and thanks to my supervisors John Barbur, Ahalya Subramanian and Sobha Sivaprasad for their continuous support, input and encouragement over the past few years to make it possible to produce this thesis.
I would also like to thank all the patients who took part in this study; I was surprised by their enthusiasm and wiliness to be part of this research project. I would also like to extend my gratitude to my examiners Dr Shahina Pardhan and Dr Marisa Rodrigues-Carmona for making my examination such an exciting and inspiring experience, and for all their valuable comments.
9 DECLARATION
10 ABSTRACT
Diabetes Mellitus (DM) has become one of the most important metabolic diseases that reduces one’s quality of life and doubles the risk of early death. Amongst the major complications linked to DM, diabetic retinopathy (DR) leads to gradual loss of vision and blindness. DR is now the second cause of certifiable blindness among the working age adults in the UK. The lifetime costs to the UK government are calculated to be up to £327,000 per person, with almost 50% of these costs being attributed to loss of productivity caused by visual impairment and blindness. The UK is one of the leading countries in the implementation of DR screening programmes. The latter rely heavily on fundus imaging and grading using trained experts and subsequent referral to hospital for further clinical examination and evaluation depending on the grade of retinopathy. It is now known that subtle, structural changes in the retina that are linked to diabetes can precede detectable vascular changes. The former can affect one’s colour vision and this offers the potential of using changes in chromatic sensitivity as an early biomarker of retinal disease.
The first part of this thesis focuses on measuring chromatic sensitivity using the colour assessment and diagnosis (CAD) test in diabetic subjects with varying degrees of retinopathy. The severity of colour vision loss is graded in comparison to other factors that are normally linked to diabetes, such as the type, grade, control methods and duration. The results of this study reveal losses of both red / green and yellow / blue chromatic sensitivity in patients with diabetes, but the correlation with factors, normally associated with high risk of diabetes is low. The results from this study do, however, show that the magnitude of chromatic sensitivity losses correlates with the severity of diabetic retinopathy.
11 ABBREVIATIONS
µm Micro metres
ACCORD Action to Control
Cardiovascular Risk in Diabetes Study
BSCVA Best Spectacle Corrected
Visual Acuity
CAD Colour Assessment and
Diagnosis Test
CARDS Collaborative Atorvastatin
Diabetes Study
CST Central Subfield Thickness
CIE Commission Internationale
d’Eclairage
CS Contrast Sensitivity
CV Colour Vision
CRT Cathode Ray Tube
CSMO Clinically Significant
Macular Oedema
DCCT Diabetes Control and
Complications Trial
DD Disc Diameter
dLGN Dorsal Lateral Geniculate
Nucleus
DM Diabetes Mellitus
DMO Diabetic Macular Odema
DN Diabetic Neuropathy
DR Diabetic Retinopathy
DRIVE UK Diabetic Retinopathy in
Various Ethnic groups in UK
DRS Diabetic Retinopathy Study
DSS Diabetic Screening Service
EDIC Epidemiology of Diabetes
Interventions and Complications study
ERG Electroretinography
ETDRS Early Treatment Diabetic
Retinopathy Study
FIELD Fenofibrate Intervention
and Event Lowering in Diabetes Trial
HbA1C Glycosylated Haemoglobin,
Type A1C
IDF International Diabetes
Federation
IOP Intraocular pressure
IPL Inner Plexiform Layer
IR Infra-Red
IRAS Integrated Research
Application System
IRMA Intraretinal microvascular
abnormality
IS Inner Segment
ISPED Italian Society of Paediatric
Endocrinology and Diabetology
L cone Long wavelength sensitive
cone
LOCS III Lens Opacities
Classification System III
M cone Medium wavelength
sensitive cone
mmol Milli moles per Litre
MO Macular Oedema
MPOD Macular Pigment Optical
12
MPOD Macular Pigment Optical
Density
MSVI Moderate and Severe
Visual Impairment
NHS National Health Service
NICE National Institute for
Health and Care Excellence
Nm Nano metres
NPDR Non-proliferative Diabetic
Retinopathy
NSC National Screening
Committee
NVD New vessels on disc
NVE New vessels elsewhere
OCT Optical Coherence
Tomography
OD Optical Density
OPL Outer Plexiform Layer
OS Outer Segment
PDR Proliferative Diabetic
Retinopathy
PRP Pan-retinal Laser
Photocoagulation
RG Red-Green
RGC Retinal Ganglion Cell
RPE Retinal Pigment Epithelium
RT Retinal Thickness
S cone Short wavelength sensitive
cone
SNU Standard Normal Units
STED Sight Threatening Eye
Disease
SVL Severe Visual Loss
TNF-α Tumour Necrosis Factor-α
UK United Kingdom
UKADS United Kingdom Asian
Diabetes Study
UKPDS United Kingdom
Prospective Diabetes Study
UV Ultra-Violet
VEGF Vascular Endothelial
Growth Factor
WESDR Wisconsin Epidemiology
Study of Diabetic Retinopathy
WHO World Health Organization
YB Yellow-Blue
13 1 THE VISUAL SYSTEM
1.1 ANATOMY OF THE EYE
The eye is located within the orbital cavity surrounded by muscles, nerves, vessels and fatty tissue. It is made up of segments of two spheres of different sizes, the anterior, smaller segment is transparent and forms one-sixth of the eyeball while the posterior, larger segment is opaque and forms about five-sixths of the eyeball.
The eyeball consists of three layers (Figure1-1):
1. The fibrous layer, composed of the sclera and cornea
2. The vascular pigmented layer, composed of the uvea (iris, ciliary body and choroid)
[image:14.595.159.437.474.716.2]3. The nervous layer, i.e. the retina
14 1.1.1 The fibrous layer
The sclera forms the posterior five-sixths of the eyeball and is opaque; it is about 1mm thick posteriorly, thinning at the equator to 0.6mm (Snell and Lemp, 2001). The sclera may be divided into three layers, the episclera, the scleral stroma and the lamina fusca. The main function of the sclera is to provide a tough external framework that protects the intraocular contents from trauma and together with the intraocular pressure it helps preserve the shape of the eyeball. The sclera joins the cornea at the corneoscleral junction.
The cornea is transparent; it forms the anterior one-sixth of the eyeball. The average corneal diameter is 10.6 mm vertically and about 11.7 mm horizontally. It is the main structure responsible for the refraction of light entering the eye. The average corneal thickness is 530 microns (Doughty and Zaman, 2000). It consists of 5 layers: the epithelium, Bowman’s layer (membrane), the stroma, Descemet’s membrane and the endothelium. The transparency of the cornea results from its avascularity and the uniform spacing of the collagen fibrils in the stroma. It transmits most of the visible and infrared light (IR) (300-2500 nm) with the maximum transmittance between 500-1300 nm.
1.1.2 The vascular pigmented layer
15
a posterior chamber. The colour of the iris varies from light blue to dark brown depending on the amount of pigment in the melanocytes. The iris controls the amount of light entering through the pupil through its contractile ability to dilate and constrict the pupil. During accommodation for near vision, the pupil constricts to restrict the incoming light to the central part of the lens thus diminishing the spherical aberration. The periphery of the iris is attached to the anterior surface of the ciliary body.
The ciliary body is a triangular structure; it is made up of the ciliary epithelium, the ciliary stroma and the ciliary muscle. The anterior surface of the ciliary body gives rise to the ciliary processes that produces the aqueous humour. The zonular fibres of the lens pass from the lens equator to attach to the anterior surface of the ciliary body in the intervals between the ciliary processes. Contraction of the ciliary muscle moves the apex of the ciliary processes towards the lens equator and relaxes the lens zonules, thus allowing accommodation (Figure 1-2).
The choroid lies posterior to the ciliary body. It extends from the optic nerve posteriorly to the ciliary body anteriorly. It is extremely vascular and divided into three layers: the vessel layer, the capillary layer and Bruch’s membrane. The main function of the choroid is to provide the outer retina and the retinal pigment epithelium (RPE) with oxygen and nutrients through its choriocapillaries.
16
[image:17.595.126.467.188.446.2]pump mechanism. It accounts for 30% of the eye’s refractive power. It transmits light from the ultra-violet (UV) (300 nm) part of the spectrum to the 1900 nm range in the IR part.
Figure 1-2: Sectional anatomy of the eye (Blausen gallery, 2014).
1.1.3 The nervous layer – The retina
17
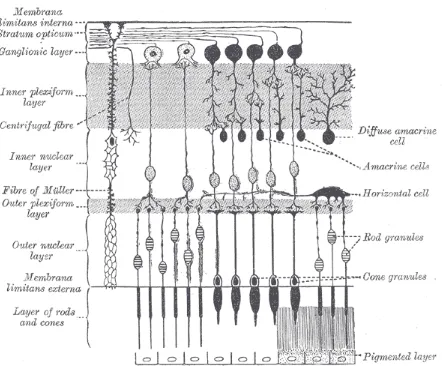
Figure 1-3: The different layers of human retina (adapted from Gray’s anatomy, 1918)
The RPE is the outermost layer of the retina, and has several functions including the phagocytosis of the outer segments of the photoreceptors, the participation in the formation of rhodopsin and its dark pigmentation absorbs the light thus reducing the amount of light scatter in the eye.
[image:18.595.79.521.104.470.2]18
The macula lutea is an oval yellowish area at the centre of the retina. This yellowish colour is attributed to the yellow xanthophyll carotenoids, zeaxanthin and lutein. It measures about 5 mm in diameter and its centre lies about 5.5 mm temporal to the optic disc. The central depressed area in the centre of the macula is called the fovea; it is about 1.5 mm in diameter. The foveola is the central part of the fovea and has a diameter of 0.35 mm. The sharpest vision occurs at the macula because of its avascularity and dense cone mosaic.
The neurosensory segment of the retina is formed of three main groups of neurons: the photoreceptors, the bipolar cells and the ganglion cells.
1.2 PHOTORECEPTORS
There are two types of photoreceptors, the rods and the cones. The rods are mainly responsible for vision in dim light (scotopic conditions), while the cones are adapted to bright lights (photobic conditions) and can resolve fine details and colour vision (CV). There is three different types of cones named short-, middle- or long-wavelength, or S, M and L cones. This classification is based on the sensitivity of the photopigments to short, middle or long wavelength light. There are about 110 to 125 million rods in the retina and about 6.3 to 6.8 million cones. The rods are absent at the foveola rising rapidly in number towards the periphery with the opposite happening with the cones which are most dense at the fovea and then decrease in number towards the periphery.
19
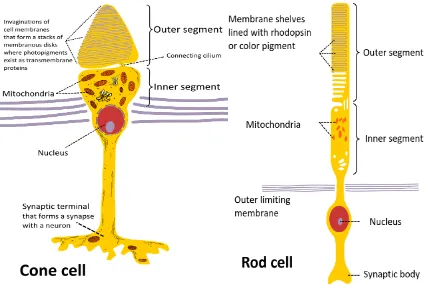
[image:20.595.78.502.312.597.2]molecules in the rods and photopsin molecules in the cones. The OS is connected to the IS by a connecting stalk that contains modified cilium. The IS in both rods and cones consists of two areas, the ellipsoid, which is situated next to the connecting stalk and the myoid located toward the vitreous, they contain numerous mitochondria, ribosomes and Golgi apparatus that provide the necessary energy for photo-transduction. The cell body of the photoreceptors is connected through microtubules to pear-shaped spherule in rods and expanded end in cones - called cone pedicles that contain many presynaptic vesicles and synapse with the dendrites of the bipolar cells.
Figure 1-4: The main structure of rods and cones; the photopigment is located in the outer segment (OS). The OS is connected to the IS by a connecting stalk that contains modified cilium. At the base of the cell the spherule contain the presynaptic vesicles that synapse with the dendrites of the bipolar cells
(created by Ivo Kruusamägi,
20
When light falls on the retina, photon absorption by visual pigment rhodopsin triggers isomerization of 11 cis retinal to all trans retinal resulting in activation of rhodopsin that starts chain of actions with closure of the ion channels and inducing change in the electric potential of the photoreceptor. This will continue until trans is transformed back to cis. Similar biochemical events occur in cones. The signals generated are transmitted through the synapses.
1.3 INTRA-RETINAL PATHWAYS
Two main patterns exist for transmitting signals from photoreceptors, the vertical pathway and the lateral pathway. In the vertical pathway, rods and cones synapse with bipolar and ganglion cells. First post receptoral synapses takes place between the photoreceptors and the bipolar cell, which in turn synapses with a ganglion cell. The first synapse at the outer plexiform layer (OPL) is responsible for processing static information. The second synapse at inner plexiform layer (IPL) is responsible for processing phasic information. Signals from 120 rods converge to one ganglion cell while signals from 6 cones converge to one ganglion cell, this becomes one-one ratio at the fovea. The lateral pathway for transmitting the signal involves the horizontal cells and amacrine cells which allows signals from neighbouring photoreceptors to transmit the signals through other bipolar or ganglion cells (Bye et al., 2013).
21
different areas of the retina. The receptive field have a centre surround organization, ON-centre ganglion cells are excited at the centre and inhibited in the periphery, while OFF-centre ganglion cells are inhibited in the centre and excited in the periphery. Rods are only connected to depolarizing bipolar cells (ON).
22
23 1.4 POST-RETINAL PATHWAYS
Nerve fibres converge at the optic disc to leave the eye through the optic nerve to reach the optic chiasm, where the nerve fibres from the nasal retina decussate to enter the optic tract of the opposite side; whereas the temporal fibres remain uncrossed. The fibres continue through the optic tracts which carry the signals to the dorsal lateral geniculate nucleus in the brain (dLGN). The dLGN has a laminated structure and consists of six curved layers of cells. The layers of cells are separated by white bands of optic nerve fibres; they are numbered 1 to 6. The nerve fibres that cross the midline terminate in layers 1, 4 and 6, while the fibres that do not cross terminate in layers 2, 3 and 5.
The optic radiations are formed of nerve fibres that originate from the nerve cells in the laminae of the LGN. They terminate in the visual cortex (V1) which lies in the posterior part of the occipital cortex and is formed of two areas, the primary visual area (Brodmann’s area 17) and the secondary visual area (Brodmann’e areas 18 and 19).
1.5 VISUAL PROCESSING OF NORMAL TRICHROMATIC COLOUR VISION
24
The trichromatic colour theory was first suggested by Thomas Young in the 18th
century, and later developed by Hermann von Helmholtz. This theory states that normal colour signals require the presence of three kinds of nerve fibers in the retina.
25
[image:26.595.106.476.72.491.2]26
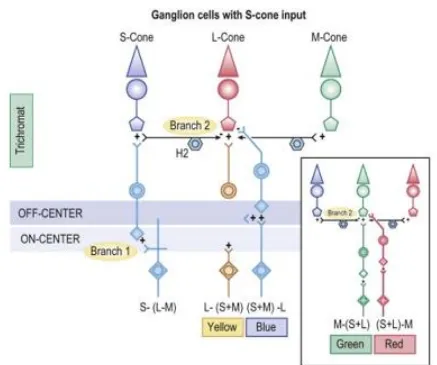
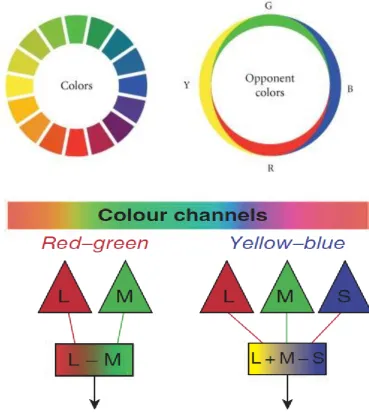
Utilising this theory and the trichromatic colour theory, in 1896 Muller proposed the zone theory or stage theory which is based on three different colour receptors that initiates three different neuronal signals that are processed and transformed as two sets of opponent colour signals.
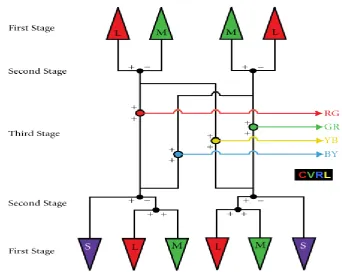
[image:27.595.123.466.393.665.2]The zone theory assumes that there is three zones, in the first zone there is three types of cones initiating colour vision through absorption of light by photopigments sending electrical signals to reach the second zone. In the second zone colour signals are coded creating one achromatic signal and two achromatic signals following the opponent theory proposed by Hering. The final zone is located in the cortex and is responsible for interpretation of the signals in relation to other spatial and temporal information. (Figure 1-7)
Figure 1-7: Schematic representation of Müller zone model. First stage: L, M and S cone photoreceptors (top and bottom). Second stage: L-M and M-L cone opponency (top) and S-(L+M) and (L+M)-S cone opponency (bottom). Third
stage: colour is achieved by summing the various cone-opponent second stage
27
In 1956 Gunnar Svaetichin proved the existence of the retinal nerve cells that Young suggested, these cells are sensitive to three different wavelengths. Later in 1980 Bowmaker & Dartnall were able to use micro-spectroscopy to measure the spectral transmittance of a small beam of light passing through the outer segment (OS) of individual cones in vitro and obtain three kinds of spectra with their absorbance peaks. Each of the three types of cones contains a different type of photosensitive pigment, which is composed of a transmembrane protein called opsin and a light-sensitive molecule called 11-cis retinal. Colour processing starts when each of these three different photosensitive pigments is struck by a photon with the specific wavelength to which that pigment is most sensitive to, this initiates a cellular response and a signal that is transmitted to the brain.
28
Figure 1-8: Normalized absorbance of the three human cone pigments, indicating the relative sensitivity of the three cone types to light of different wavelengths (obtained from http://www.cvrl.org).
[image:29.595.74.514.73.311.2]29 2 INTRODUCTION
2.1 DIABETES MELLITUS
Diabetes Mellitus (DM) is one of the most serious conditions of the modern age, its incidence with the subsequent complications are increasing worldwide. According to the international diabetes federation (IDF), 415 million are affected with diabetes; this number is expected to rise to 642 million people by 2040. DM is a chronic metabolic disease that results from defects in insulin secretion, insulin action or both. The world health organization (WHO) issued recommendations for the diagnostic criteria of DM based on clinical symptoms such as polyuria, polydipsia and unexplained weight loss in addition to blood tests that show:
1. Random venous plasma glucose concentration ≥ 11.1 mmol/l or 2. Fasting plasma glucose concentration ≥ 7.0 mmol/l or
3. Plasma glucose concentration ≥ 11.1 mmol/l, two hours after 75g anhydrous glucose in an oral glucose tolerance test (OGTT)
There are different types of DM, the main types as identified are: 1. Type I:
30 2. Type 2:
The body does not produce sufficient insulin or there is insulin resistance which means that different body cells are not able to respond adequately to normal levels of insulin. This type affects 90% of people with diabetes. 3. Gestational diabetes:
It develops in woman during pregnancy where the fasting glucose level is ≥5.6 mmol/l or 2-hour plasma glucose level ≥7.8 mmol/l.
Complications of diabetes:
Hyperglycaemia as well as hypoglycaemia have damaging effect on different cells of the body systems leading to macrovascular complications (coronary artery disease, peripheral arterial disease, and stroke) and microvascular complications (Diabetic nephropathy, neuropathy, and retinopathy).
2.2 DIABETIC RETINOPATHY
2.2.1 DEFINITION OF DIABETIC RETINOPATHY
31
2.2.2 CLASSIFICATION OF DIABETIC RETINOPATHY
DR is diagnosed and graded according to the extent of microvascular changes observed on fundus examination. This is now done through diabetic retinal screening programmes in different parts of the country through the National Health Service (NHS). The United Kingdom (UK) has a well implemented screening programme that offers screening to 80.1% of its diabetic population with 73.5% actually undertaking the screening tests (NHS Diabetic Eye Screening Programme, 2012). All eligible patients have their fundus photographs taken, this is later reviewed by a grader who is able to quantify the severity of changes and refer to a specialist when needed.
There are two widely used forms for DR grading in the UK, one of which has been adopted from the National Screening Committee (NSC) (Harding et al., 2003) and used in population screening programmes, and another which is based on the Early Treatment Diabetic Retinopathy Study (ETDRS) that depend on modifications from the Diabetic Retinopathy Study (DRS) and mainly used in clinical settings. There are similarities between both forms of classifications with focus on two aspects, retinopathy and maculopathy.
2.2.2.1 Retinopathy
32 2.2.2.2 Maculopathy
Maculopathy is a form of retinopathy that affects the macula and is also known as diabetic Macular Oedema (DMO). It is classified according to the NSC into presence (M1) or absence (M0) of maculopathy. The ETDRS define clinically significant Macular Oedema (CSMO) by the presence of the following:
Retinal thickening within 500 µm of the center of the fovea
Hard, yellow exudates within 500 µm of the center of the fovea with adjacent retinal thickening
33
Table 2-1:National Screening Committee grading criteria (Harding et al., 2003).
R0 None
R1 Background Microaneurysm(s)
Retinal haemorrhage(s) ± any exudate
R2 Pre-proliferative Venous beading
Venous loop or reduplication
Intraretinal microvascular abnormality (IRMA)
Multiple deep, round or blot haemorrhages
Cotton wool spots (CWS)
R3 Proliferative New vessels on disc (NVD)
New vessels elsewhere (NVE)
Pre-retinal or vitreous haemorrhage
Pre-retinal fibrosis ± tractional retinal detachment
M0 Nil present
M1 Maculopathy Exudate within 1 disc diameter (DD) of the centre of
the fovea
Circinate or group of exudates within the macula
Retinal thickening within 1DD of the centre of the fovea (if stereo available)
Any microaneurysm or haemorrhage within 1DD of the Centre of the fovea only if associated with a best visual acuity of ≤ 6/12 (if no stereo)
PHOTOCOAGULATION (P) Focal/grid to macula
Peripheral scatter
34
Disease Severity Level Findings Observable upon Dilated
Ophthalmoscopy
Mild non-proliferative retinopathy At least one microaneurysm, and definition not met for moderate nonproliferative retinopathy, severe nonproliferative retinopathy, early proliferative retinopathy, or high-risk proliferative retinopathy (see below) Moderate non-proliferative retinopathy Haemorrhages and/or microaneurysms ≥ standard photograph 2A; and/or soft exudates, venous beading, or intraretinal microvascular abnormalities definitely present; and definition not met for severe nonproliferative retinopathy, early proliferative retinopathy, or high-risk proliferative retinopathy (see below)
Severe non-proliferative retinopathy Soft exudates, venous beading, and intraretinal microvascular abnormalities all definitely present in at least two of fields four through seven; or two of the preceding three lesions present in at least two of fields four through seven and haemorrhages and microaneurysms present in these four fields, equalling or exceeding standard photo 2A in at least one of them; or intraretinal microvascular abnormalities present in each of fields four through seven and equalling or exceeding standard photograph 8A in at least two of them; and definition not met for early proliferative retinopathy or high-risk proliferative retinopathy (see below)
Early proliferative retinopathy (i.e., proliferative retinopathy without Diabetic Retinopathy Study high-risk characteristics)
New vessels; and definition not met for high-risk proliferative retinopathy (see below)
High-risk proliferative retinopathy (proliferative retinopathy with Diabetic Retinopathy Study high-risk characteristics)
New vessels on or within one disc diameter of the optic disc (NVD) ≥ standard photograph 10A* (about one-quarter to one-third disc area), with or without vitreous or preretinal haemorrhage; or vitreous and/or preretinal haemorrhage accompanied by new vessels, either NVD < standard photograph 10A or new vessels elsewhere (NVE) ≥ one-quarter disc area
35
2.2.3 DIABETIC MACULAR OEDEMA (DMO)
DMO is one of the most serious squeals of DR. It affects 20% of patients with DR (Yau et al., 2012) and is caused by a breakdown of the outer blood retinal barriers secondary to an inflammatory process that releases prostaglandins, leukotrienes and vascular endothelial growth factor (VEGF) (Bhagat et al., 2009).
This causes an accumulation of extracellular fluid within the inner and outer retinal layers, creating cystoid spaces that can extend to affect the whole retinal thickness. This leads to displacement of the retinal neuronal components with subsequent temporary or permanent visual loss (Pelosini et al., 2011). Implications and management of DMO are discussed in more details later in the thesis in chapter 5.
2.2.4 EPIDEMILOLOGY OF DIABETES AND DIABETIC RETINOPATHY
2.2.4.1 Incidence and prevalence of diabetes
36
2.2.4.2 Incidence & prevalence of diabetic retinopathy
It is estimated that worldwide there are more than 100 million people with DR and of these at least 30 million people are at risk of developing severe sight-threatening retinopathy (Yau at al., 2012). In 2004, Resnikoff et al. reported that DR is the leading cause of visual impairment amongst the working age population in the developed world. In the UK, it is one of the three most common recorded causes of certification as sight impaired (Bunce et al., 2010). In a recent study about prevalence and causes of vision loss in high-income countries and in Eastern and Central Europe: 1990-2010 (Bourne et al., 2014), DR was the fifth most common cause of moderate and severe vision impairment (MSVI) (presenting visual acuity <6/18 but ≥3/60 in the better eye) and blindness (presenting visual acuity <3/60).
The Wisconsin Epidemiologic Study of Diabetic Retinopathy (WESDR), a large population study on DR conducted in the USA found that the overall 10-year incidence of retinopathy was 74%. 64% of people with retinopathy at baseline showed progression of retinopathy on follow ups and 17% progressed to develop proliferative retinopathy (Varma, 2008). After 25 years follow up, in the type 1 diabetes cohort, almost all patients (97%) developed retinopathy over time with 43% developing proliferative retinopathy and 29% developing macular oedema (MO).
37
during the past two decades. Since the introduction of the nationwide DR
screening programmes in England and Wales and for the first time in at least the
last five decades, DR is now the second cause of certifiable blindness among the working age adults (Liew at al., 2013).
In the Liverpool Diabetic Eye Study, Younis et al., 2002 studied the prevalence of diabetic eye disease in patients entering a systematic primary care-based eye screening programme. They recruited 831 subjects with type 1 diabetes and 7231 subjects with type 2 diabetes. In the type I group, 45.7% had non-proliferative diabetic retinopathy (NPDR), 3.7% had non-proliferative diabetic retinopathy (PDR) and 16.4% had sight threatening eye disease (STED). For the type 2 group, 25.3% had NPDR, 0.5% had PDR and 6.0% had STED.
38
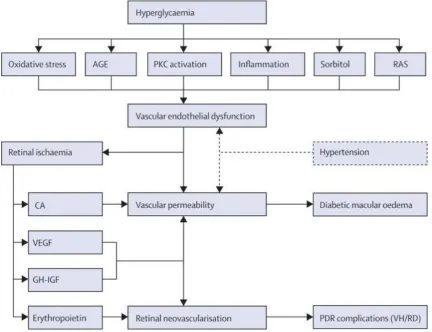
2.2.5 PATHOPHYSIOLOGY OF DIABETIC RETINOPATHY
DR is caused by a chronic exposure to hyperglycaemia and other risk factors such
as hypertension which seems to initiate a cascade of biochemical and
[image:39.595.71.504.251.583.2]physiological changes that are responsible for the retinal microvascular damage
(Figure 2-1).
39
As response to the hyperglycaemic state, inflammatory mediators are upregulated triggering responses that cause abnormal leucocyte-endothelial interactions resulting in microvascular damage. The structural changes observed in retinal vasculature starts with arteriolar dilation in response to the increased capillary pressure this result in leakage (oedema and hard exudates) and rupture (haemorrhages).
2.2.5.1 Vascular changes vs. neuronal changes
40
mechanism to maintain neuronal function and represent an attempt to limit the retinal damage over time they cause tissue destruction and neovascularization with retinal damage (Seigel et al., 2000; Barber at al., 2001; Gariano et al., 2005).
2.2.5.2 Risk factors
Risk factors for developing DR can be divided to two subgroups, non-modifiable and modifiable factors which are described below.
2.2.5.2.1 Non-modifiable risk factors
1. Ethnic origin:
The Diabetic Retinopathy in Various Ethnic groups in UK (DRIVE UK) study
(Sivaprasad et al., 2012) was the largest cross-sectional study on the prevalence
of DR in the various ethnic groups with diabetes in the UK. It showed that the
prevalence of any retinopathy in type 2 diabetes is highest in people of
African/Afro-Caribbean descent compared to South Asians or white Europeans.
In type 2 diabetes, the prevalence of any DR was 38.0% in white Europeans
compared to 52.4% in African/Afro-Caribbeans and 42.3% in South Asians.
Similarly, sight threatening DR was also significantly more prevalent in
Afro-Caribbeans (11.5%) and South Asians (10.3%) compared to white Europeans
(5.5%).
41
It recruited 1035 patients with type 2 diabetes: 421 of South Asian and 614 of white European ethnicity. Results showed that people with a south Asian ethnic origin were more likely to have DR than white European people. DR was detected in 414 (40%) patients (189 South Asian (45%) versus 225 white European (37%); P = 0.0078). Sight-threatening retinopathy was detected in 142 (14%) patients (68 South Asian (16%) versus 74 white European (12%); P = 0.0597) (Raymond et al., 2009).
2. Duration and age at onset:
The duration of diabetes is a strong predictor for the development and
progression of retinopathy (Fong et al., 2004). The development of DR has a linear relationship with the duration of diabetes, so the longer the duration of diabetes the higher the prevalence of DR (Wong et al., 2009).
The Wisconsin Epidemiology Study of Diabetic Retinopathy (WESDR) showed that the 4-year incidence of developing proliferative retinopathy in the younger-onset group increased from 0% during the first 5 years to 27.9% during years
13–14 of diabetes and after 15 years, the incidence of developing PDR remained
stable. It also showed that in patients diagnosed before age 30 years, 97% had retinopathy and 25% had PDR at 15 years post diagnosis (Klein et al., 1984).
3. Puberty:
42
Diabetes duration after menarche is associated with 30% excess risk of retinopathy compared with diabetes duration before menarche (WESDR) (Klein et al., 1990). It has also been suggested that prepubertal years might offer some protection against developing DR (Olsen et al., 2004).
2.2.5.2.2 Modifiable risk factors
1. Diabetic control:
The Diabetes Control and Complications Trial (DCCT, 1982-93) compared the
effects of two treatment regimes, standard therapy and intensive control on the complications of diabetes, it demonstrated that achieving glycaemic levels close to the non-diabetic range by intensive treatment reduced the risk of developing DR by 76%. This was followed by the Epidemiology of Diabetes Interventions and Complications study (EDIC, 1994-2006) which investigated the long-lasting effects of the previously assigned therapies. One of the most important conclusions of the study was that the salutary effect of intensive therapy persists for at least 10 years after differences in glycaemia between the original intensive and conventional therapy groups have disappeared, this have been named imprinting or metabolic memory.
The UK Prospective Diabetes Study (UKPDS, 1998) showed that intensive blood glucose control reduced the risk of diabetic complications, the greatest effect being on microvascular complications by 25%. It also demonstrated that for every percentage point decrease in Glycosylated Haemoglobin, Type A1C
43 2. Blood pressure:
The UKPDS also studied the influence of tight blood pressure control with an ACE inhibitor or a beta blocker over a median of 8.4 years. It showed reduced risk of both microvascular and macrovascular disease, where 34% had reduction in progression of retinopathy and 47% reduced risk of deterioration in visual
acuity of three lines after 10 mmHg systolic and 5 mmHg diastolic reduction in
blood pressure.
Gallego et al., 2008 provided evidence for the relationship between elevated
blood pressure and risk of retinopathy in young people with type 1 diabetes.
They examined 1869 patients with type 1 diabetes and a median age of 13.4
years. Retinopathy developed in 36% of participants. The risk was higher for
developing DR in patients who had higher systolic and diastolic blood pressures.
3. Dyslipidaemia:
Dyslipidaemia has also been linked to the pathogenesis of DR (van Leiden et al., 2002; Klein et al., 2002). Several studies have studied the effect of lipid lowering
medications on the pathogenesis of DR. Sen at al. (2002) conducted a
double-blind randomized placebo-controlled trial and concluded that simvastatin
significantly retards the progression of retinopathy in diabetic patients although
there was limited to no improvement of visual acuity in patients receiving the
treatment.
The Fenofibrate Intervention and Event Lowering in Diabetes (FIELD) trial, a
randomised controlled trial with 9795 participants aged 50-75 years, found that
Fenofibrate, a lipid modifying agent, reduced the need for laser treatment (5·2%
vs 3·6%, p=0·0003) (Keech et al., 2005).
These findings were also supported by the Action to Control Cardiovascular Risk
44
a 40% reduction in the odds of progression of retinopathy in a subgroup having Fenofibrate in combination with a statin, compared to simvastatin alone (Chew et al., 2010).
However, the Collaborative Atorvastatin Diabetes Study (CARDS) did not find
atorvastatin to be effective in reducing DR progression (Thomason et al., 2004;
Colhoun et al., 2004).
2.2.6 MANAGEMENT AND TREATMENT OF DIABETIC RETINOPATHY
A systematic review and met-analysis by Cheung at al., 2009 looked at the rates of progression in DR during different time periods. They included 28 studies published between 1975 and February 2008. They found that participants in 1986–2008 studies had lower proportions of PDR and non-PDR at all-time points than participants in the 1975–1985 studies. In studies reporting outcomes at 10 years, rates for PDR were 11.5% in 1975–1985 versus 6.6% in 1986–2008 and for severe vision loss (SVL), corresponding rates were 6.0% versus 2.6%, respectively.
45
2.2.6.1 Management of diabetic retinopathy
The aim of the screening process and management of DR is the prevention, detection and treatment of sight-threatening maculopathy and proliferative retinopathy.
Systematic population screening for DR has been implemented in the UK several years ago (NHS diabetic eye screening programme, 2013). Screening is conducted using high-definition fundus photography which is evaluated by graders that applies strict grading criteria, as discussed previously in section 2.2. Table 2-3 summarizes the NSC management criteria.
Those patients with referable retinopathy, i.e. maculopathy, moderate, severe or PDR are usually referred within set time limits to the hospital eye service for further management as required. Not all patients referred to hospital will require treatment, regular monitoring and adequate control of diabetes and other risk factors such as blood pressure and lipid levels, can sometimes be enough to control DR changes and reduce the risk of progression to diabetic maculopathy. This requires a multi-disciplinary team approach with liaison between the DR services, ophthalmologists, diabetologists and general practitioners.
46
inhibitors or steroids are more effective and are now available and licensed by the National Institute for Health and Care Excellence (NICE) for treating DMO.
RETINOPATHY (R)
R0 Annual screening
R1 Annual screening, inform diabetes care team
R2 Refer to hospital eye service
R3 Fast-track referral to hospital eye service
MACULOPATHY (M)
M0 Annual screening
M1 Refer to hospital eye service
PHOTOCOAGULATION (P)
P1 New screen — refer to hospital eye service
Quiescent post treatment — annual screening
OTHER LESIONS (OL) Refer to hospital eye service or inform primary physician
UNGRADABLE (U) Media opacity hospital eye service
UNSCREENABLE/UNOBTAINABLE
Poor view but gradable on biomicroscopy, refer hospital eye service
Unscreenable, discharge, inform GP
(Option to recall for further photos if purely technical failure)
47
2.3 DIABETIC RETINOPATHY AND COLOUR VISION
In recent years, our understanding of DR has changed and it is now accepted that DR not only affects the retinal vasculature, but it also affects the neural retina. Hence, more studies have started investigating the neurodegenerative changes of DR. Those changes are usually assessed mainly by measuring any reduction in chromatic sensitivity or / and by using electrophysiological diagnostic tests such as full-field or multifocal electroretinography (ERG).
2.3.1 Retinal neurodegeneration in diabetes
Several changes are observed in neuronal retina in diabetes, some of those changes might even precede the development of signs that can be seen on examining the retina in DR. The mechanisms by which such changes occur are not fully understood, and although several theories exist, none have succeeded in giving a full explanation of the exact mechanisms involved. The following section lists and discusses the most common theories put forward to account for the neurodegenerative changes and events that might happen in the retina of a diabetic person.
2.3.1.1 Inflammation:
48
activated and start to release inflammatory cytokines (Schroder et al., 1991). This leads to the start of an inflammatory process that leads to the development of DR. The events that follow cause the blood–retinal barrier to degrade and in turn this may affect the normal functioning of the retina. These events include: increased vascular permeability, cellular infiltration, release of cytokines and growth factors including IGF-1, Interleukin-1, TNF and VEGF. These factors provide neurotrophic functions and are released in an attempt to repair the retinal cells and to help overcome the stress (Seigel et al., 2000; Barber at al., 2001; Gariano et al., 2005). The abundant release of these factors results in loss of the integrity of the blood-retinal barrier, progressive vascular damage and neuronal cell loss seen in progressive stages of DR (Antonetti et al., 2006).
2.3.1.2 Apoptosis
49
Another factor that plays a role as well in the process of apoptosis is the decrease in the anabolic stimulus provided by insulin due to the reduction in number of insulin receptors (Yi et al., 2005). It is known that insulin plays an important role in supporting retinal neurones and vascular cells (Barber et al., 2001; Kondo et al., 2003). The DCCT study demonstrated that intensive treatment with insulin reduces the amount of apoptosis and reduces the risk of developing retinopathy (DCCT, 1982-93). These findings suggest that the increase in apoptosis within the neural retina is an important factor in the onset and progression of the DR process.
2.3.1.3 Glutamate Excitotoxicity
50
Over the years there have been many studies to investigate the relationship between CV loss and diabetes, but the majority of them are using CV tests that were primarily designed to detect hereditary CV loss rather than pathological loss. In addition, none of the tests has the ability to quantify reliably the severity of red / green (RG) and yellow / blue (YB) colour vision loss. This is important when the aim is to follow up patients with diabetes and to detect progression or even improvement as we will discuss later in this thesis (chapter 6).
The agreement among the different studies is that there is a degree of CV loss in diabetic patients, but that the wide variation in results makes it difficult to establish how CV loss correlates with other parameters that are used routinely for screening and examining diabetic patients such as VA and OCT. Also there is no agreement as to whether these CV losses are correlated to different diabetes related factors such as grade of retinopathy, duration or control.
In 1982 Maloney and Drury studied 66 patients (132 eyes) with type I diabetes for CV loss using the FM-100 hue test and reported high error scores in 88 eyes (56.7%). Several other studies followed (Green et al., 1985; Bresnick et al., 1985; Roy et al., 1986; Trick et al., 1988; Tregear et al., 1994). In these studies, the FM 100-Hue error scores showed no correlation with age, sex, age of onset, duration of diabetes, metabolic control or with the degree of retinopathy.
51
of the mean error score increased with the severity of DR. These results have since been replicated by other studies such as Fong et al., (1999) and Barton et al., (2004) which studied patterns of hue discrimination impairment among 2701 of the diabetic patients enrolled in the ETDRS. Fong et al., reported that approximately 50% of the patients had CV scores worse than 95% of the normal population. They found that hue discrimination was associated with MO severity, age and neovascularization. In the Barton et al. study, they were able to detect 13 patterns of impaired hue discrimination and reported losses in YB axis that correlated with the severity of DR.
In a more recent study, Feitosa-Santana et al., (2006) investigated CV in 32 subjects with type II diabetes without DR and 20 age matched controls using the Farnsworth D-15 and Lanthony D-15d tests and employed triadic procedure that enabled detection of very mild CV impairment. Results were constructed in two-dimensional RG and YB perceptual opponent systems. The authors found that the colour space configurations were compressed along the YB as well as RG axes in the diabetic subjects which they attributed to the reduced photoreceptor sensitivity.
Another recent study used a computerized CV test (Arden colour contrast test) (Al Saeidi et al., 2013) to evaluate its efficacy in detection of DMO. The authors examined 42 diabetic patients with and without MO, they found that YB loss was more pronounced than RG loss and correlated with retinal thickness on the Optical Coherence Tomography (OCT).
52
along the RG and YB spectrum can provide a sensitive measure of the functional changes observed in DR. Their results showed almost equal RG and YB losses in both type I and type II diabetic subjects, there was no correlation to the duration of the disease and/or the absence of retinopathy. These findings agreed with other studies that suggested that chromatic sensitivity loss can precede structural changes in the retina (Hardy et al. 1992; Kurtenbach et al., 1999; Ong et al., 2003).
Although DR is diagnosed by visual fundus examination, it has become more evident as research progresses and more studies are conducted, that the functional changes taking place in the retina of a diabetic patient precede visible structural changes and that neuroretinal function is compromised before the vascular changes are observed. Hence CV may be good predictor for evaluation of such functional changes, allowing earlier intervention. When coupled with better diabetic control, the earlier intervention may reduce the rate of diabetes progression and related complications. The outcome is a better quality of life and reduced economic burden that accompanies the care for DR patients.
2.3.2 Colour vision tests
53
In the current study, chromatic sensitivity was measured using the Colour Assessment and Diagnosis (CAD) test which quantifies the severity of CV loss in a simple and effective way. The test enables accurate assessment of both RG and YB loss (Barbur and Rodriguez-Carmona, 2015) of chromatic sensitivity. The CAD test will be described in more details in section 3.2. The majority of other colour vision tests fail to quantify accurately the severity of colour vision loss and were designed mostly to screen for congenital colour deficiency.
2.3.2.1 Pseudoisochromatic test plates
The most common is the Ishihara colour screening test. It was first published in 1917; it is useful in screening for subjects with congenital colour deficiency (Belcher et al., 1958). The subject is presented with a series of colour plates with either numbers or convoluted lines embedded within a background of dots that vary in size, luminance and chromaticity. There are several editions available which contain 24 and 14 plates, however the standard edition contains 38 plates, 25 of which contain numerals (single or double-digit numbers), the remaining 13 plates are intended for examination of nonverbal subjects, where the subject is required to trace the pathway of convoluted lines. Normal trichomats will be able to see the correct numbers but an individual with colour deficiency will either fail to distinguish the number or will see different number. For example in hidden digits plate, normal trichomat will fail to see a number while a colour deficient subject might see a number. (Figure 2-2).
54
McKeever, 1993 described the non-typical errors made by normal trichomats as ‘misreadings’, it is attributed to the subject perceiving a loop of the serif as being complete rather than incomplete (for example, a ‘5’ may be interpreted as a ‘6’ or ‘3’ as ‘8 ’. The misreading is related to the strength of chromatic signal which means that the weaker the perceived chromatic signal in the test plate, the higher the probability of confusions or misreading (Rodriguez-Carmona et al., 2012).
[image:55.595.89.506.484.613.2]4 or less errors are required for a normal trichomate to pass the test (Birch, 2001). Reducing the number of errors means increasing the sensitivity of the test but even then, if the pass score is set at 3 or less errors this will mean that 10% of deutans and 1%protans will also pass the test. If errors are not allowed, 19% of normal trichomats will fail the 38 plates edition with at least one error. This makes the outcome of the test not specific and it fails to give accurate measure of the severity of CV loss.
55 2.3.2.2 Arrangement tests
Arrangement tests utilize coloured caps with different hues. The subject is required to arrange the caps in order of hue. The test scores are reported in the form of error score that is derived from the number and pattern of errors made during the arrangement.
2.3.2.2.1 Farnsworth-Munsell Hue test
The FM-100 hue test aims to evaluate the subject’s hue discrimination ability. The observer is required to arrange colour samples according to hue, lightness and saturation. There are 2 versions of the test, the Farnsworth-Munsell 100 (FM-100) hue test which has 85 colour samples and the Farnsworth- dichotomous test (D-15) which has 15 coloured samples. The
56
57
58
2.3.2.2.2 Lanthony’s Desaturated Panel 15 test
This is another arrangement test; it has 15 colour samples which are less
saturated than the Farnsworth Dichotomous test. This makes it more difficult to
carry out. The test should be presented under high levels of illumination (> 500
lux). Rather than measuring the overall hue discrimination ability, it is used to
detect moderate and severe colour deficiencies (Figure 2-5).
Figure 2-5: Illustration of the Lanthony’s Desaturated Panel 15 test.
2.3.2.2.3 Lanthony New Colour Test
This test is intended to distinguish between mild, moderate and severe colour
deficiency. It is formed of 70 Munsell samples, four series of 15 colours and 10
grey caps. The observer is required to arrange the coloured caps in colour order
and the grey caps in order of lightness scale. Results are plotted on a graph and
59 2.3.2.3 Nagel anomaloscope
The Rayleigh match was first described by Rayleigh (1881) and developed into an instrument for assessing red / green colour vision by Nagel in the early 1900's. It was designed for clinical evaluation of colour deficiency. The observer is
presented by circular bipartite field subtending 3° in Maxwellian view, the lower
hemi-field is illuminated with yellow light source, the luminance of which can be
varied and the upper hemi-field is formed of mixture of adjustable red and green
lights.
The test requires the observer to make colour matches by adjusting both the
red-green ratio and the luminance of the yellow field. The observer is then
required to determine whether adjustments in the luminance of the yellow field
can or can’t produce exact matches to red-green ratios that are set by the
examiner. The type of colour deficiency is determined from the patterns of
variation in the red/green mixture range and the intensity of the yellow field
60
Figure 2-6: Illustration of the Nagel anomaloscope and the bipartite field. The upper hemi-field is formed from mixture of monochromatic red and monochromatic green and the lower hemi-field is illuminated with monochromatic yellow light source (adapted from Schiefer et al., 2007).
The ratio of red and green is quantified; this ratio is between 0 for
monochromatic green to 73 for monochromatic red. Subjects with normal
colour vision will typically be able to make a Rayleigh match when the
proportion of the two lights are nearly equal (i.e.; in the range of 35 - 40). In a
protan subject, they will need to increase the proportion of red light in the
mixture in order to make a match. So protans will be able to match range of
mixtures between 40 and 73. A deutan subject will require greater proportion
of green light achieving the mixture range between 0 and 40.
The accuracy of diagnosis requires interpretation of the result by an experienced
examiner to be able to interpret whether the subject has made a match or not
based on their responses. In a study by Barbur et al., (2008) subjects with known
61
within the normal range (Barbur et al., 2008). This means that the Nagel
anomalscope is not as perfect instrument, as previously thought.
2.3.2.4 Automated / computerized tests
Some of these tests are based on the principals of the arrangements tests and
others are based on colour contrast sensitivity. Examples of these tests include
the Sussex Gratings Machine (SGM), the Chroma test and the Cambridge colour
test.
2.3.3 Electroretinography
Several studies were conducted to investigate the neuroretinal changes using either full field or multifocal ERG. Those studies describe delayed or declined oscillatory potentials which are produced by the amacrine cells (Wachtmeister at al., 1978). Holopigian et al., (1997) investigated group of 12 diabetic patients with duration of diabetes more than 5 years. They detected delay in the a and b waves denoting changes in the photoreceptor cells. Similar results were shown by Fortune et al., (1999) they examined patients with 10-15 years duration of diabetes using multifocal ERG, they reported delay in the implicit time.
2.3.4 Microperimetry
62
diabetic patients and the effect that this would have on retinal sensitivity. As in recent study by Montesano et al., (2017), where they compared the retinal sensitivity to ganglion cell layer-inner plexiform layer thickness in 35 normal subjects and 26 diabetic subjects with no DR. They detected significant correlation between retinal sensitivity and the correspondent GCL-IPL thickness in diabetic subjects (0.022±0.006 dB/μm, p=0.0007) but not in healthy subjects (-0.002±0.006 dB/μm, p=0.77).
In another recent study by Nerianuri et al., (2017) they detected reduction in retinal senstivity measured by microperimetry in 245 subjects with no DR. Where mean retinal sensitivity was 14.78 ± 3.17 dB in subjects with absent diabetic neuropathy (DN) compared to 13.56 ± 3.65 dB in subjects with DN. This indicates the presence of neuroretinal dysfunction even in the absence of DR and supports the theory that neuronal changes precede the onset of vascular changes.
2.3.5 Contrast sensitivity
63
0.17 log units in absence of DN compared to 1.25 ± 0.21 log units in subjects with DN.
2.3.6 Aim of study
64 3 METHODS
This chapter describes the criteria and recruitment process of the subjects, assessment of the grade of DR and the tests that were used for measuring chromatic sensitivity and retinal thickness as well as a list of other patient-specific information that was collected such as duration and control of diabetes, HbA1C and previous medical and ophthalmic histories.
3.1 SUBJECTS
Subjects were recruited from the Ophthalmology outpatient department of King’s College Hospital NHS Foundation Trust, London. The study was approved by the Integrated Research Application System (IRAS) (Ref:11/NW/0753), King’s College Hospital Research and Ethics Committee as well as City, University of London Research and Ethics Committee. The study adhered to the principles of the declaration of Helsinki. Each subject was provided with an information sheet prior to their agreement to participate and was required to provide informed signed consent before taking part.
Only subjects who met the inclusion criteria were recruited into the study. The inclusion criteria for the study required that all subjects:
Were aged 35 years or above, of either sex. Type II diabetes is more common after the age of 40-45 years and Type I is rare after that age (www.nhs.uk), so we set age 35 or above as an inclusion criteria to avoid a wide variation in age group between type I and Type II diabetics.
Were able to provide informed consent.
65
Had no other ocular disease apart from DR.
Had normal CV (subjects with congenital CV loss as assessed by the CAD test were excluded from our analysis).
None of the subjects included in this study were taking medication known to affect CV, e.g. Digoxin (Lawrenson et al., 2002), ethambutol, chloroquine, hydroxychloroquine, phenytoin or sildenafil (Santaella and Fraunfelder, 2007).
The RG congenital colour deficiency affects about 8% of men and about 0.4% of women (Birch, 2001) and therefore we can expect at least 1 female and 5 males
from our recruited subjects to have congenital RG deficiency. The reported average prevalence of colour blindness in the United Kingdom is 4.7% (www.nhs.uk). Initially subjects were asked about family history of CV loss and were considered to be normal if the answer was negative. However, after examining the results from the CAD test, we were able to detect 4 subjects with congenital CV loss, out of the 106 recruited (3.77%). Those are the subjects who exhibit RG losses whilst maintaining normal YB thresholds. Those subjects were excluded from the analysis.
In addition, subjects were excluded from the study if:
Their best spectacle corrected visual acuity (BSCVA) was worse than 6/12 (0.3 LogMAR).
They suffered from any other disease or had any other eye disease which could affect CV or mask the identification of the CAD test screen (e.g. multiple sclerosis and optic neuritis) (Russell et al., 1991).