City, University of London Institutional Repository
Citation
:
Liu, S., Andrienko, G. ORCID: 0000-0002-8574-6295, Wu, Y., Cao, N., Jiang, L.,
Shi, C., Wang, Y. S. and Hong, S. (2018). Steering data quality with visual analytics: The
complexity challenge. Visual Informatics, 2(4), pp. 191-197. doi: 10.1016/j.visinf.2018.12.001
This is the accepted version of the paper.
This version of the publication may differ from the final published
version.
Permanent repository link:
http://openaccess.city.ac.uk/22366/
Link to published version
:
http://dx.doi.org/10.1016/j.visinf.2018.12.001
Copyright and reuse:
City Research Online aims to make research
outputs of City, University of London available to a wider audience.
Copyright and Moral Rights remain with the author(s) and/or copyright
holders. URLs from City Research Online may be freely distributed and
linked to.
City Research Online:
http://openaccess.city.ac.uk/
[email protected]
Manuscript Details
Manuscript number VISINF_2018_22
Title Steering Data Quality with Visual Analytics: the Complexity Challenge
Article type Review Article
Abstract
Data quality management, especially data cleansing, has been extensively studied for many years in the areas of data management and visual analytics. In the paper, we first review and explore the relevant work from the research areas of data management, visual analytics and human computer interaction. Then for different types of data such as multimedia data, textual data, trajectory data, and graph data, we summarize the common methods for improving data quality by leveraging data cleansing techniques at different analysis stages. Based on a thorough analysis, we
propose a general visual analytics framework for interactively cleansing data. Finally, the challenges and opportunities are analyzed and discussed in the context of data and humans. Data quality management, especially data cleansing, has been extensively studied for many years in the areas of data management and visual analytics. In the paper, we first review and explore the relevant work from the research areas of data management, visual analytics and human computer interaction. Then for different types of data such as multimedia data, textual data, trajectory data, and graph data, we summarize the common methods for improving data quality by leveraging data cleansing techniques at different analysis stages. Based on a thorough analysis, we propose a general visual analytics framework for interactively cleansing data. Finally, the challenges and opportunities are analyzed and discussed in the context of data and humans.
Keywords Data-quality-management, visual-analytics, data-cleansing,
Corresponding Author Shixia Liu
Corresponding Author's Institution
Tsinghua University
Order of Authors Shixia Liu, Gennady Andrienko, Yingcai Wu, Nan Cao, Liu Jiang, Conglei Shi, Yu-Shuen Wang, Seokhee Hong
Submission Files Included in this PDF
File Name [File Type]
first page.pdf [Title Page (with Author Details)]
Steering_Data_Quality_with_Interactive_Visualization (2).pdf [Manuscript File]
Steering Data Quality with Visual Analytics: the
Complexity Challenge
Shixia Liua,∗, Gennady Andrienkob,c, Yingcai Wud, Nan Caoe, Liu Jianga, Conglei Shif, Yu-Shuen Wangg, Seokhee Hongh
aTsinghua University, Beijing, China bFraunhofer Institute IAIS, Sankt-Augustin, Germany
cCity, University of London, London, UK dZhejiang University, Zhejiang, China
eTongji University, Shanghai, China fAirbnb, San Francisco, CA, USA gNational Chiao-Tung University, Hsinchu, Taiwan
hUniversity of Sydney, Sydney, Australia
Abstract
Data quality management, especially data cleansing, has been extensively
stud-ied for many years in the areas of data management and visual analytics. In the
paper, we first review and explore the relevant work from the research areas of
data management, visual analytics and human computer interaction. Then for different types of data such as multimedia data, textual data, trajectory data,
and graph data, we summarize the common methods for improving data quality
by leveraging data cleansing techniques at different analysis stages. Based on
a thorough analysis, we propose a general visual analytics framework for
inter-actively cleansing data. Finally, the challenges and opportunities are analyzed
and discussed in the context of data and humans.
Keywords: Data quality management, visual analytics, data cleansing
2010 MSC: 00-01, 99-00
∗Corresponding author
1. Introduction
With the increasing predominance of data-centric approaches to business,
scientific, and engineering problems, data and its quality have become more and
more important [1, 2, 3, 4]. However, during the data collection and processing
stage, some incomplete, inconsistent, duplicate, or inaccurate data can be fused,
5
which usually affects the further usage of data (e.g. lower the accuracy of the
learning models) and can lead to loss of consumer trust and revenues. As a
result, in the era of big data, one key issue on preparing and processing data is to ensure the quality and usability of data (data quality management), including
detecting, removing, and correcting errors and inconsistencies in the data.
10
Data quality management has been studied for many years in the area of
database and data management [5, 2]. Its major goal is to efficiently detect
and correct errors in the data. As an important part of data-driven
analy-sis, data quality management takes over 30%-80% of the time and resource [6].
Most mature works focus on tabular data, such as assessing the data quality [7],
15
interactive data cleansing [8], and data wrangler [9]. However, due to the
in-creasing complexity of the data (e.g., multimedia data, texts, graphs, sequences
and trajectories etc.) collected through a variety of ways, it is more and more challenging to effectively and accurately improve data quality. In most of the
cases, domain knowledge of experts is important to guide for better
perfor-20
mance of data quality management algorithms [10]. As a consequence, there
has been a growing interest in recent years to study how to better combine
user-guided methods with system-guided methods during the analysis, where
information visualization and visual are the important parts to achieve this
goal [3, 4, 11, 12, 13].
25
Data cleansing is a widely used practice for effective data quality
manage-ment. As a result, most existing data quality management efforts focus on data
cleansing. In this paper, we first report the related work from different research areas, including data management, visual analytics, and human computer
in-teraction. Then for different types of data, we summarize the common methods
for improving data quality by leveraging data cleansing techniques at different
stages. In addition, a high level abstraction of a framework on designing a visual
analytic system for data cleansing is needed as a general guideline for the re-search in this direction. Thus, inspired by pipeline proposed in [14], we develop
a visual analytics framework, focusing on iteratively and progressively
improv-35
ing data quality from the screening stage, to diagnosis stage and the correction
stage. Finally, we explore the research challenges and opportunities and align
them with the our visual analytics framework, which we hope can better guide
the future visual analytics research on data cleansing.
2. Related Work
40
Researchers have been extensively studying a variety of data cleansing
tech-niques to improve the data quality for the past twenty years. Most efforts are
mainly from two research areas: data management and visual analytics.
In the area of data management, researchers have developed a number of
approaches to checking, repairing, and correcting inconsistencies and errors in
45
the data. Existing efforts can be classified into three categories: rule-based
detection methods for cleaning data based by a set of rules [15, 16, 17, 18], quantitative error detection methods for discovering and resolving outliers and
glitches in the data [19, 20, 21, 22], and record linkage and de-duplication
meth-ods for detecting duplicate data items [23, 24]. Recently, Abedjan et al. [25]
50
conducted a comprehensive evaluation to analyze the performance of existing
algorithms on four common types of data errors, including outliers, duplicates,
rule violations, and pattern violations. These error types are relatively general
and can be applied beyond tabular data. However, these works do not
pro-vide an end-to-end data cleansing pipeline. In order to enable effective and
55
efficient data cleansing practices, several frameworks have been developed. For
example, Florescuand modeled the cleansing application as a graph-based data transformation, which can be applied to SQL-based database [26]. Gill and Lee
Due to the limited usage scope, these frameworks cannot be applied to a general
60
data cleansing application. Broeck et. al., proposed a three-stage framework
on data cleansing, either manually or automatically. The framework categorizes the whole process into three stages, screen stage, diagnosis stage, and correction
stage [14]. For each stage, the key problems are identified. The major feature
of this framework is that it covers the whole analysis workflow well, from the
65
raw data exploration to actual error correcting.
In most real-world cases, the data cleansing process cannot be done fully
au-tomatically due to the ambiguity of the errors and the need of human knowledge
to verify the cleansing results. To effectively loop human into the data
cleans-ing process, visual analytics researchers have developed several works focuscleans-ing
70
on interactive data cleansing. These works in most cases aim to solve some
specific tasks for certain types of data, mostly structured table representations. Krishnan et. al. [28] designed ActiveClean to interactively cleanse the data for
statistical modeling. Profiler [7] was designed to interactively detect and
vi-sually summarize the outliers from data. von Zernichow et al. [29] presented
75
a prototype system for visual data profiling, with a focus on discovering and
correcting missing values and outliers in tabular data. Wrangler [30] targets at
interactively creating data transformation scripts. Guo et al. [31] later extended
Wrangler to a mixed-initiative system by integrating a proactive
recommenda-tion model, which suggests applicable data transforms to users for a more guided
80
exploration of the transformation space. Both tools (Profiler and Wrangler) only
support tabular data cleansing. Beyond these works, Kandel et. al. [9] further summarized the research direction on how visualizations and interaction
tech-niques can help data wrangling. The aforementioned works greatly demonstrate
the usefulness and effectiveness of visual analytics techniques in helping improve
85
the data quality, however, it is not easy to apply these techniques to other types
of data or different cleansing tasks.
While tabular data is the predominant focus of data cleansing researchers,
we also note some efforts on visually cleaning time-oriented data.
Gschwandt-ner et al. [13] derived a taxonomy of quality issues with time-oriented data, and
envision the need of visualization tools for analyzing the quality issues with
hu-man in the loop. Following this line, they later proposed TimeCleanser [32], an
interactive approach specifically for cleansing time-oriented data. The approach includes several syntax checks that are common for tabular data, including time
checks (valid temporal range, consistent interval lengths, missing time points or
95
intervals), time-oriented value checks (e.g. identifying values that don’t change
for a long time), and consistency about multiple data sets (same temporal range,
resolution etc.) Though TimeCleanser demonstrates its effectiveness on
correct-ing data, it is less flexible to support reasoncorrect-ing about underlycorrect-ing causes to the
quality issues detected. In light of this, Arbesser et al. [33] designed Visplause,
100
an interactive visualization system to facilitate the inspection of the quality
of multiple time series. In particular, the system mainly integrates the meta
information of data to provide a hierarchical overview that aggregates the re-sults of data quality checks at different levels of detail. This enables a flexible
semantic reasoning about the data quality. Gschwandtner and Erhart [34]
pre-105
sented “Know Your Enemy”, a visual analytics approach to the identification of
issues in time series data. Compared with prior work, they more adequately
tai-lored the visualization design to the time-oriented characteristics of data (e.g.,
providing the temporal contexts). We also note some recent works that focus
on cleaning the time-oriented data that has specialized characteristics in some
110
particular application domains. For example, Schulz et al. [35] proposed a
vi-sual cleansing tool tailored to the low-level eye-tracking data. Dixit et al. [36]
develop an interactive approach specifically for correcting event orderings in process logs.
3. Data Types and Their Relationships
115
The majority of the existing data cleansing tools focus on structured
ta-ble data. The word ‘structured’ is the key here, as the structure of the tata-ble suggests how to assess and improve the quality of the data. Table data
Respectively, data cleansing procedures check data types, formatting, and help
120
users to perform basic data cleaning operations such as fixing typos (e.g. by
checking spelling of text values or ensuring consistency in using decimal dots and commas in numeric values), modifying representations of dates and times,
computing statistics for numeric values, identifying and interactively inspecting
outliers, resolving encoding rules (e.g. 999 forno data) etc. Special methods
125
exist for detecting missing values and replacing them by plausible values taking
into account values in other table columns. Modern tools like Tableau
sup-port cleansing of multiple related tables. For example, values in the connecting
columns of the two tables can be checked for consistency and, if some values do
not match, they can be modified interactively.
130
Non-table data require special methods for cleansing that take into account
the specifics of the data type. For example, preparation of textual data requires language detection, removal of too short documents, detection of duplicated
content, fixing miss-spelled words and incorrect punctuation, just to name a few
operations. It is important to have a possibility to perform fast computations for
135
subset of the data (e.g. calculating the size of the vocabulary used in different
document or assessing the overall sentiment) for looking at the data set from
different perspectives and thus selecting appropriate documents for analysis.
For more complex data it is necessary to exploit their structures for
develop-ing appropriate data wrangldevelop-ing tools. For example, spatial event data [37] may
140
be considered as a special type of table data that include columns with temporal
and spatial references. Each event is described by its type (‘what happened’), location (‘where happened’), time (‘when happened’) and attributes (e.g. event
magnitude, actors, etc.) Event types and attributes can be treated as
regu-lar columns, applying traditional methods for validating their quality. Spatial
145
and temporal references of the events can be used for attaching additional data
sources (that describe locations and times) for checking if events are plausible
at given locations and times. For example, traffic events are expected to happen
on roads but not in lakes, and visiting restaurant events are highly unlikely at
night times.
Another representative example is the graph data. Generally, a graph can
be represented using two connected tables describing graph vertices and edges.
Both vertices and edges can be described by their attributes. Moreover, ad-ditional attributes of vertices and edges can be computed from the topology
of the graph. Graph centrality measures can be used for identifying outliers
155
and disconnected subgraphs. Respectively, the data cleansing tools for graphs
need to take into account the structure of the graph data and potentially useful
additional information that can be derived from the graph data.
Understanding the specifics and structure of the data is essential for
design-ing appropriate data transformations. Let us consider an example of trajectories
160
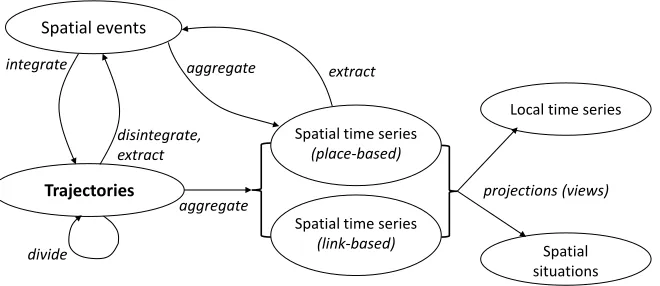
of moving objects [38]. Each position is a spatial event that can be described
by a reference to the moving object id, time stamp t, its coordinates x and
y, and possible attributes: id, t, x, y , attributes. Sequences of events for the same moving object can be integrated into a trajectory (Fig. 1). Such
inte-gration allows computation of derived attributes such as displacement, time
165
difference, speed estimate etc. These derived attributes can be used for
extract-ing secondary events from trajectories (e.g. stops) and dividextract-ing trajectories into
smaller subsets (e.g. trips between stops). Both trajectories and events can be
aggregated by areas and links between areas, creating spatial time series
re-ferring to locations and links between them, respectively. Further events (e.g.
170
extreme values) can be extracted from such derived spatial time series. This
ex-ample demonstrates how data structure defines possible and potentially useful
transformations. Such transformations can be used for looking at the data from a different perspective, thus facilitating the data cleansing process, identifying
and eventually fixing data problems.
175
4. Examples of different data types
In this section we consider the specifics of steering data quality for different types of data beyond regular data tables.
Spatial time series
(place-based)
Spatial time series
(link-based)
Local time series
Spatial situations
aggregate projections (views)
Spatial events
integrate
disintegrate, extract
aggregate extract
Trajectories
[image:11.612.143.473.138.281.2]divide
Figure 1: Potentially possible transformations of trajectory data.
been widely used for communication after cameras and recorders were invented.
180
In this study, we focus on images, audios, and videos because they are the most
popular. Typically, a pixel in images represent the color of a small area. While many pixels are arranged to form an image, which describe the appearance of a
large area, they can be used to convey visual information. Compared to an
im-age, a video has an additional time coordinate, in which each time span contains
185
an image. Therefore, a video can show dynamic visual changes over time. In
terms of audios, each sample in a time span describes the frequency and
magni-tude of energy that would be heard by humans. Note that the most important
characteristic of the above-mentioned data is that each sample/pixel is
mean-ingless, whereas the integration of them is not. Therefore, there are no point
190
anomalies, but contextual and collective anomalies in multimedia data. Cleans-ing abnormal multimedia data demands semantics and can only be achieved by
complex algorithms and human guidance.
Textual data. Textual data consists of bag-of-words representation in the
form of sentences, paragraphs, documents, and topics. Typical examples such
195
as news articles, interviews, emails, field notes, as well as text descriptions
informa-tion about people, events, and activities, sharing findings, knowledge, and best
practices within a community, as well as to connecting people and propelling
the organization forward [39].
200
In the era of big data, with the ever-increasing size of a document corpus,
it is simply not possible in many cases for people to quickly locate key
infor-mation or derive insights from such large amounts of textual data. Generally,
text analysis tasks include information retrieval, cluster/topic analysis, natural
language process, classification, outlier analysis, etc. [40].
205
To better perform the aforementioned tasks, the quality of textual data
must be guaranteed. Examples of quality issues of textual data are duplicate
documents that are intentionally rephrased, irrelevant content such as an
adver-tisement in an news article, documents with mixed topics that are hard to
disen-tangle for a specific application (e.g., information retrieval), multilingual
docu-210
ments, as well as inconsistent documents with varying document lengths, diverse
writing styles, and different writing quality (e.g., news articles and tweets).
Trajectories of moving objects. Trajectory data is a sequence of events
that correspond to recorded time-referenced positions of moving objects [38].
While each particular record has limited value, many applications require
con-215
sideration of large collections of such position records. However, even simple
tasks like detection of duplicates become difficult due to the complex structure
of the data. For position records, a duplicate is a repeating combination of the
moving object identity and temporal reference. If the positions and attributes
are equal, this is a case of duplicate records that need to be eliminated. If
220
positions or attributes differ, sophisticated conflict resolution procedures are
needed.
Paper [41] analyses in detail the properties of trajectory data (properties of
moving objects, space and time) and related properties of data collection
pro-cedures. These properties are used for identifying potential problems that may
225
appear in trajectory data sets: missing data, accuracy problems and precision
deficiency. The potential problems are considered in respect to all components
attributes (e.g. speed or acceleration) and possible transformations (e.g.
ag-gregating trajectories into occupancy indicators for visited areas and counts of
230
moves between the areas) enable looking at data from different perspectives (see Fig. 1).
Graph data. A graphG= (V, E) consists of a vertex set V and an edge
set E, where a vertex represents an entity and an edge between two vertices
represents a relationship between them. Both vertices and edges can have
mul-235
tipleattributes, such as numbers, texts, categorical data and images. An edge
set defines a topologystructure of the graph, and there can be more than one
edge sets for a given vertex set, which represent multiple relationships between
the entities.
For example, a vertex v can represent a student, wherev has multiple
at-240
tributes such as student id number, enrolled degree, year, home address, phone number, and photo id. Similarly, an edgeecan have numbers such as weights,
texts, time stamps and directions. For more complex data, an edge setE can
be changing over time, i.e., change the values of their attributes as well as the
topology of a graph. The student set can have multiple relationships, such as
245
facebook friends, instagram friends, and tennis friends etc.
Therefore, the data cleansing for graph data need to take into account these
attributes for vertices and edges, as well as the topology of the graph, defined by
the edge set. For example, based on the types of attributes of vertices and edges
(such as numbers, texts and images) and the topology of the graph, one need to
250
use a variety of techniques for processing missing values, duplicates, uncertainty, imprecision and conflicts, as well as detection for outliers and specific patterns.
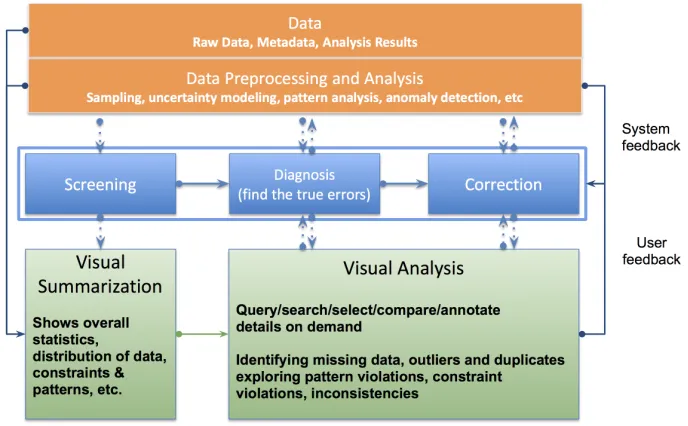
5. Analysis Pipeline
Based on theScreening→Diagnosis→Correction framework [14], we
pro-pose a visual analytics framework for analyzing and improving data quality.
255
The goal of the proposed framework is to help a user (e.g., an analyzer) find the
Figure 2: Visual analytics framework for steering data quality, which is based on the data cleansing framework developed in [14] (Screening→Diagnosis→Correction).
and convenient method to improve the data quality under the users’ supervision
via their domain knowledge and experiences. To achieve the goal, our
frame-work, as shown in Fig. 2, is designed in a three-layer/module structure with
260
(1) a data layer shown at the top and (2) a visualization layer shown at the
bottom connected by an interaction layer show in the middle. These modules are respectively designed for (1) discovering the data insights (for tackling data
complexities); (2) intuitive data representation and interpretation (for tackling
data complexities); as well as (3) easy data exploration and analysis with human
265
in the loop (for tackling human complexities).
Specifically, the data layer takes various types of data (e.g., raw data,
meta-data, or analysis results) collected from different sources or produced at different
analysis stages as the input. It then preprocesses or analyzes the input data for
retrieving data samples, discovering data uncertainty, revealing hidden patterns,
270
or uncovering outliers.
layer. Through screening, a user is able to choose to summarize and illustrate
the overview, statistic features, and data patterns (e.g., trend and cluster) via
275
intuitive visual representations. After that, the user can further make a di-agnosis on the data to find out the potential problems (e.g., missing values,
duplications, pattern/constraint violations, inconsistencies) that effect the data
quality. Finally, a user can interactively correct the detected problems within
the data.
280
In the above analysis procedure, visualization plays an important role in
sup-porting data interpretation and decision making. In the framework, two types of
visualization designs are required: (1) the visualization designed for illustrating
and summarizing the data with the goal of showing overview, patterns,
distri-butions, and constrains of the data, thus handling the complexities associated
285
with data; (2) the visualization designed for data error correction with the goal of identifying missing data, outliers, duplicates, pattern/constraint violations,
and data inconsistencies, which aims at tackling a variety of complexities related
to human.
6. Research Challenges and Opportunities
290
6.1. Data Complexity
Multimedia.Quality management for multimedia is challenging. Users have to
apply different methods to handle images, audio recordings, and videos because
they are of different nature. In addition, caused by different reasons, anomalies of these media can be classified into low level and high level categories. On one
295
hand, low level anomalies are often caused by data transmission, compression, or
fault of a machine. These anomalies, such as blank images, white noise audios,
duplicated frames in a video, can be detected by simple rules. However, on
the other hand, high level anomalies are difficult to detect because of requiring
semantics. Specifically, each small segment of multimedia data, such as a pixel
300
in images or a sample in audios, is meaningless, but the integration of them is
image processing methods to assess visual quality, or object detection techniques
to obtain semantics. Otherwise, anomalies such as overexposure, underexposure,
and serious object occlusions cannot be detected. Similarly, speech recognition
305
and emotion identification are often used to understand semantics in an audio,
and signal processing techniques are used to identify low quality audios such as
containing load but irrelevant background speech.
Textual data.Although textual data is widely used in many lines of work, data
quality problems for such type of unstructured data remain largely unexplored.
310
This is because, due to the unstructured nature of textual documents, quality
management for textual data is challenging. First, textual data often contains
several data fields and mixes the useful information with irrelevant information.
As a result, one key challenge is how to retrieve interactively the useful content
and remove the noisy information. For example, a web page is usually a mixture
315
of many types of information, such as main textual content, advertising panels,
navigation bars, copyright blocks, images, etc. In real-world applications, only
part of information, typically the main textual content, is useful and the rest are
treated as noise. Therefore, it is important to remove the irrelevant information,
which is still a hot research topic in the area of information retrieval. Second, a
320
text corpora may contain text strings of different distributions, such as different
lengths and language usages. For example, news articles and formal publications
are usually long and consist of sentences with grammatical rules, while tweets or
micro-blogs are short, noisy, and with limited context information. This makes
it impractical to use a unified text mining model to analyze them together. As
325
a result, another challenge is how to effectively improve the quality of a text
corpora with inconsistent data distributions.
Trajectory data. Quality management for trajectories is challenging. Users
need to understand the nature of the data and of the phenomenon they
rep-resent for assessing the data quality properly and, subsequently, validating the
330
data correctly. Concerning the phenomenon, it is necessary to distinguish
dif-ferent modes of movement (e.g. separate walking from biking or using
of movement: speed, acceleration, inertia) and take into account the context
of movement (e.g. multiple cars on a road must follow common direction).
335
Concerning the data, it is necessary to take into account the data collection procedure (e.g. positions collected every minute, every 20m during straight
movement, by performing certain activities such as making a call).
It is necessary to understand the coverage properties of a data set under
inspection, ensuring that it corresponds to analysis tasks. Often data sets are
340
limited in spatial extent, causing complete trajectories or their parts being
ab-sent in data. Sometimes data collection is impossible in specific conditions (e.g.
positioning device does not work in tunnels or indoor). Proper temporal
cov-erage is essential, too. Another covcov-erage aspect that needs to be considered is
population: for example, it is dangerous to make conclusions about mobility of
345
elderly people based on data derived from positions of social media activities that are performed mostly by youngsters. Another example in vehicle traffic:
projecting mobility patterns of public buses onto individual cars is doubtful.
Graph data. Similarly to other data types, quality management for graph
data is challenging due to the complexity of the data. In addition to the
chal-350
lenges for various types of attributes, the topology structure of a graph adds
more challenges. Users need to apply a variety of techniques for missing
val-ues, duplicates, uncertainty, and outlier detection to handle different types of
attributes (such as numbers, texts and images) and the topology of the graph.
Furthermore, multiple relationships and relationships changer over time (i.e.,
355
dynamic graphs) add more challenges.
For example, users may need to compute statistics about the topology of
a graph, such as the density, diameter, clustering coefficient, connectivity and
average neighbour degree, as well as the property testing on the topology
struc-ture of a graph, such as testing whether a given graph is a tree (i.e., no cycle),
360
a planar graph (i.e., can be drawn in the plane without edge crossings), or a
Directed Acyclic Graph (DAG).
In addition to the attribute-based outlier detections, users need to perform
patterns such as motifs, a small subgraph consists of three or four vertices,
365
small cycle patterns such astriads(i.e., triangles), and other special subgraphs
such as paths, trees, stars, and complete subgraphs. Algorithms for finding such special topological patterns are complex with high runtime complexity.
Users may need to analyze topology-based constraints. For example, a tree
hasn−1 edges, and a planar graph can have at most 3n−6 edges, wherenis
370
the number of vertices. Others include domain specific constraints; for example
a family tree should not have a cycle, which represents a blood marriage.
Common challenges and opportunities. In addition to the aforementioned
data-type-specific research challenges and opportunities, there are also some
common ones. First, existing visual data cleansing methods cannot be scalable
375
to large-scale datasets. One potential solution to handle large-scale datasets is
to sample only a small subset of the whole training set. The challenge here is how to develop effective sampling methods that can both keep the data density
and preserve important data such as influential points, outliers, and exceptions.
Second, there is a lack of effective quality metrics to measure the quality of
380
different types of data such as textual data, images, videos, graph data, and
trajectory data. As a result, a potential research opportunity is to develop
quality metrics from data content and evaluate them within specific usage
con-texts. In real-world applications, the analyst often needs to examine multiple
types of data and correct the errors among them. Accordingly, the third
chal-385
lenge is designing an integrated interface to visually illustrate the distributions
of different types of data.
6.2. Human Complexity
Several challenges will arise when human intelligence is integrated into
auto-matic data cleaning pipeline. We classify these challenges into three categories
390
and identify the associated opportunities as follows.
• Lack of domain knowledge. Better integration of human domain
sufficient knowledge or expertise regarding new types of data or new data
sets might not be always available. To overcome such a challenge, it is
395
important to explore how to tackle integration and calibration of insuffi-cient or incomplete knowledge and expertise. One important direction is
to design progressive or collaborative visual interfaces that enable
crowd-sourcing, such that users without sufficient knowledge can gradually gain
more knowledge or seek support of other users with sufficient knowledge.
400
It would also be interesting to create a visual recommendation mechanism
for providing necessary automation in data cleaning, especially when users
lack domain knowledge.
• Limitations of perception/cognition. Prior psychological studies have
revealed limitations on visual perception and cognition, such as restricted
405
field of view in perception [42] and limited working memory in cogni-tion [43]. These limitacogni-tions can directly influence the way in which human
perceive and understand the world. For complicated types of data, it is
challenging to design a visual analytics system while keeping the
complex-ity of the system within the limitations. One worthy research direction
410
is to explore a mixed initiative mechanism which seamlessly integrates
system initiative guidance and user initiative guidance for better human
machine intelligence, such that perception or cognition limitations of users
can be largely addressed.
• Difficulty in understanding uncertainty and its implications.
Un-415
certainty might arise in any stage of a data cleaning process, and
prop-agate in subsequent stages [44]. Misunderstanding the uncertainty and
its implications would result in erroneous decisions and low-quality data.
However, understanding the uncertainty and its implications would be
generally difficult without a proper visual guidance. To circumvent the
420
problem, it is highly necessary to model and visualize the uncertainty in
data cleaning, such that users can make informed decisions during the
7. Conclusion
Data quality is of crucial importance to a wide variety of real-world
appli-425
cations. In this paper, we review and summarize research efforts on steering
data quality, with a focus on data cleansing, a widely-used technique for
ef-fective data quality management. First, we summarize the relevant work from
different research fields, including data management, visual analytics and
hu-man computer interaction. Then, for different types of data, we discuss the
430
common methods for improving data quality by leveraging data cleansing tech-niques. Building upon the existing analysis pipeline of data cleansing by Van
den Broect et al.[14], we further propose a visual analytics framework for
iter-atively and progressively improving data quality from the screening, diagnosis
and correction stage. Finally, we analyze the research challenges and
oppor-435
tunities in the context of data and human complexities, which we believe are
critical for future research on visual data cleansing.
References
[1] W. Fan, F. Geerts, Foundations of data quality management, Morgan &
Claypool Publishers, 2012.
440
[2] S. Liu, C. Chen, Y. Lu, F. Ouyang, B. Wang, An interactive method to
improve crowdsourced annotations, IEEE transactions on visualization and
computer graphics (accepted) 25 (1).
[3] N. McCurdy, J. Gerdes, M. Meyer, A framework for externalizing implicit
error using visualization, IEEE Transactions on Visualization and
Com-445
puter Graphics (accepted) 25 (1).
[4] H. Song, D. A. Szafir, Where’s my data? evaluating visualizations with
missing data, IEEE Transactions on Visualization and Computer Graphics
[5] O. Kwon, N. Lee, B. Shin, Data quality management, data usage experience
450
and acquisition intention of big data analytics, International Journal of
Information Management 34 (3) (2014) 387–394.
[6] B. Saha, D. Srivastava, Data quality: The other face of big data, in: IEEE
International Conference on Data Engineering, 2014, pp. 1294–1297.
[7] S. Kandel, R. Parikh, A. Paepcke, J. M. Hellerstein, J. Heer, Profiler:
Inte-455
grated statistical analysis and visualization for data quality assessment, in:
Proceedings of the International Working Conference on Advanced Visual
Interfaces, 2012, pp. 547–554.
[8] V. Raman, J. M. Hellerstein, Potter’s wheel: An interactive data cleaning
system, in: Very Large Database Conference, Vol. 1, 2001, pp. 381–390.
460
[9] S. Kandel, J. Heer, C. Plaisant, J. Kennedy, F. van Ham, N. H. Riche,
C. Weaver, B. Lee, D. Brodbeck, P. Buono, Research directions in data
wrangling: Visualizations and transformations for usable and credible data,
Information Visualization 10 (4) (2011) 271–288.
[10] N. El Bekri, E. Peinsipp-Byma, Assuring data quality by placing the user
465
in the loop, in: International Conference on Computational Science and
Computational Intelligence, 2016, pp. 468–471.
[11] S. Liu, X. Wang, M. Liu, J. Zhu, Towards better analysis of machine
learn-ing models: A visual analytics perspective, Visual Informatics 1 (1) (2017) 48–56.
470
[12] J. Choo, S. Liu, Visual analytics for explainable deep learning, IEEE
Com-puter Graphics and Applications 38 (4) (2018) 84–92.
[13] T. Gschwandtner, J. G¨artner, W. Aigner, S. Miksch, A taxonomy of dirty
time-oriented data, in: International Conference on Availability, Reliability,
and Security, 2012, pp. 58–72.
[14] J. Van den Broeck, S. A. Cunningham, R. Eeckels, K. Herbst, Data
clean-ing: detecting, diagnosing, and editing data abnormalities, Public Library
of Science, medicine 2 (10) (2005) e267.
[15] Z. Abedjan, C. G. Akcora, M. Ouzzani, P. Papotti, M. Stonebraker,
Tem-poral rules discovery for web data cleaning, Proceedings of the Very Large
480
Database Endowment 9 (4) (2015) 336–347.
[16] W. Fan, J. Li, S. Ma, N. Tang, W. Yu, Towards certain fixes with editing
rules and master data, The Very Large Database Journal 21 (2) (2012)
213–238.
[17] F. Geerts, G. Mecca, P. Papotti, D. Santoro, Mapping and cleaning, in:
485
IEEE International Conference on Data Engineering, 2014, pp. 232–243.
[18] Z. Khayyat, I. F. Ilyas, A. Jindal, S. Madden, M. Ouzzani, P. Papotti,
J.-A. Quian´e-Ruiz, N. Tang, S. Yin, Bigdansing: A system for big data
cleansing, in: ACM Special Interest Group on Management of Data, 2015,
pp. 1215–1230.
490
[19] T. Dasu, J. M. Loh, Statistical distortion: Consequences of data cleaning,
Proceedings of the Very Large Database Endowment Endowment 5 (11)
(2012) 1674–1683.
[20] N. Prokoshyna, J. Szlichta, F. Chiang, R. J. Miller, D. Srivastava,
Combin-ing quantitative and logical data cleanCombin-ing, ProceedCombin-ings of the Very Large
495
Database Endowment Endowment 9 (4) (2015) 300–311.
[21] M. Vartak, S. Rahman, S. Madden, A. Parameswaran, N. Polyzotis, SeeDB:
efficient data-driven visualization recommendations to support visual
ana-lytics, Proceedings of the Very Large Database Endowment 8 (13) (2015)
2182–2193.
500
[22] E. Wu, S. Madden, Scorpion: Explaining away outliers in aggregate queries,
[23] A. K. Elmagarmid, P. G. Ipeirotis, V. S. Verykios, Duplicate record
de-tection: A survey, IEEE Transactions on knowledge and data engineering
19 (1) (2007) 1–16.
505
[24] M. Stonebraker, D. Bruckner, I. F. Ilyas, G. Beskales, M. Cherniack, S. B.
Zdonik, A. Pagan, S. Xu, Data curation at scale: The data tamer system,
in: Conference on Innovative Data Systems Research, 2013.
[25] Z. Abedjan, X. Chu, D. Deng, R. C. Fernandez, I. F. Ilyas, M. Ouzzani,
P. Papotti, M. Stonebraker, N. Tang, Detecting data errors: Where are
510
we and what needs to be done?, Proceedings of the Very Large Database
Endowment 9 (12) (2016) 993–1004.
[26] D. Florescuand, An extensible framework for data cleaning, in: IEEE
In-ternational Conference on Data Engineering, 2000, pp. 312–312.
[27] S. Gill, B. Lee, A framework for distributed cleaning of data streams,
Pro-515
cedia Computer Science 52 (2015) 1186–1191.
[28] S. Krishnan, J. Wang, E. Wu, M. J. Franklin, K. Goldberg, ActiveClean:
interactive data cleaning for statistical modeling, Proceedings of the Very
Large Database Endowment 9 (12) (2016) 948–959.
[29] B. M. von Zernichow, D. Roman, Usability of visual data profiling in data
520
cleaning and transformation, in: OTM Confederated International
Confer-ences” On the Move to Meaningful Internet Systems”, 2017, pp. 480–496.
[30] S. Kandel, A. Paepcke, J. Hellerstein, J. Heer, Wrangler: Interactive
vi-sual specification of data transformation scripts, in: ACM Special Interest
Group on ComputerHuman Interaction, 2011, pp. 3363–3372.
525
[31] P. J. Guo, S. Kandel, J. M. Hellerstein, J. Heer, Proactive wrangling:
mixed-initiative end-user programming of data transformation scripts, in:
ACM Symposium on User Interface Software and Technology, 2011, pp.
[32] T. Gschwandtner, W. Aigner, S. Miksch, J. G¨artner, S. Kriglstein, M. Pohl,
530
N. Suchy, TimeCleanser: A visual analytics approach for data cleansing of
time-oriented data, in: International Conference on Knowledge Technolo-gies and Data-driven Business, 2014, pp. 18:1–18:8.
[33] C. Arbesser, F. Spechtenhauser, T. M¨uhlbacher, H. Piringer, Visplause:
Visual data quality assessment of many time series using plausibility checks,
535
IEEE Transactions on Visualization and Computer Graphics 23 (1) (2017)
641–650.
[34] T. Gschwandtner, O. Erhart, Know your enemy: Identifying quality
prob-lems of time series data, in: IEEE Pacific Visualization Symposium, 2018,
pp. 205–214.
540
[35] C. Schulz, M. Burch, F. Beck, D. Weiskopf, Visual data cleansing of
low-level eye-tracking data, in: Eye Tracking and Visualization, 2015, pp. 199–
216.
[36] P. M. Dixit, S. Suriadi, R. Andrews, M. T. Wynn, A. H. ter Hofstede, J. C.
Buijs, W. M. van der Aalst, Detection and interactive repair of event
order-545
ing imperfection in process logs, in: International Conference on Advanced Information Systems Engineering, Springer, 2018, pp. 274–290.
[37] N. Andrienko, G. Andrienko, Exploratory Analysis of Spatial and Temporal
Data: A Systematic Approach, Springer-Verlag, Berlin, Heidelberg, 2005.
[38] G. Andrienko, N. Andrienko, P. Bak, D. Keim, S. Wrobel, Visual Analytics
550
of Movement, Springer Publishing Company, Incorporated, 2013.
[39] S. Liu, M. X. Zhou, S. Pan, Y. Song, W. Qian, W. Cai, X. Lian, TIARA:
In-teractive, topic-based visual text summarization and analysis, ACM
Trans-actions on Intelligent Systems and Technology 3 (2) (2012) 25.
[40] S. Liu, X. Wang, C. Collins, W. Dou, F. Ouyang, M. El-Assady, L. Jiang,
555
D. Keim, Bridging text visualization and mining: A task-driven survey,
[41] G. Andrienko, N. Andrienko, G. Fuchs, Understanding movement data
quality, Journal of Location Based Services 10 (1) (2016) 31–46.
[42] S. H. Creem-Regehr, P. Willemsen, A. A. Gooch, W. B. Thompson, S. H.
560
Creem-Regehr, P. Willemsen, A. A. Gooch, W. B. Thompson, The
in-fluence of restricted viewing conditions on egocentric distance perception:
Implications for real and virtual indoor environments, Perception 34 (2)
(2005) 191–204.
[43] A. Baddeley, Working memory: looking back and looking forward, Nature
565
Reviews Neuroscience 4 (2003) 829839.
[44] Y. Wu, G.-X. Yuan, K.-L. Ma, Visualizing flow of uncertainty through
analytical processes, IEEE Transactions on Visualization and Computer