City, University of London Institutional Repository
Citation
:
Rosti, M. E., Brandt, L. and Pinelli, A. ORCID: 0000-0001-5564-9032 (2018).
Turbulent channel flow over an anisotropic porous wall - drag increase and reduction.
Journal of Fluid Mechanics, 842, pp. 381-394. doi: 10.1017/jfm.2018.152
This is the accepted version of the paper.
This version of the publication may differ from the final published
version.
Permanent repository link: http://openaccess.city.ac.uk/19350/
Link to published version
:
http://dx.doi.org/10.1017/jfm.2018.152
Copyright and reuse:
City Research Online aims to make research
outputs of City, University of London available to a wider audience.
Copyright and Moral Rights remain with the author(s) and/or copyright
holders. URLs from City Research Online may be freely distributed and
linked to.
City Research Online:
http://openaccess.city.ac.uk/
publications@city.ac.uk
Under consideration for publication in J. Fluid Mech.
Turbulent channel flow over an anisotropic
porous wall - Drag increase and reduction
Marco E. Rosti
1†
, Luca Brandt
1and Alfredo Pinelli
21
Linn´e Flow Centre and SeRC, KTH Mechanics, Stockholm, Sweden
2
School of Mathematics, Computer Science and Engineering. City, University of London, UK
(Received 13 December 2017)
The effect of the variations of the permeability tensor on the close-to-the-wall behaviour of a turbulent channel flow bounded by porous walls is explored using a set of direct numerical simulations. It is found that the total drag can be either reduced or increased up to 20% by adjusting the permeability directional properties. The drag reduction is achieved for the case of materials with permeability in the vertical direction lower than the one in the wall-parallel planes. This configuration limits the wall normal velocity at the interface while promoting an increase of the tangential slip velocity leading to an almost “one-component” turbulence where the low- and high-speed streaks coherence is strongly enhanced. On the other hand, a strong drag increase is found when a high wall-normal and low wall-parallel permeabilities are prescribed. In this case, the enhancement of the wall-normal fluctuations due to the reduced wall-blocking effect triggers the onset of structures which are strongly correlated in the spanwise direction, a phenomenon observed by other authors in flows over isotropic porous layers or over ribletted walls with large protrusion heights. The use of anisotropic porous walls for drag reduction is particularly attractive since equal gains can be achieved at different Reynolds numbers by rescaling the magnitude of the permeability only.
1. Introduction
One of the central problems in fluid engineering concerns the fact that wall-bounded turbulent flows usually exert a much higher wall friction than laminar ones. For this reason, many researchers have studied the flow over surfaces of different characteristics and in particular over porous walls as it is commonly found in many industrial and natural flows. The main aim of these studies was to investigate the effects of locally modified wall boundary conditions on the flow field and to inspire the design of novel surfaces able to deliver technological benefits by altering the near-to-the-wall flow behaviour. In this context, this work explores the interactions between a turbulent shear flow and a permeable porous wall and demonstrates that it is possible to engineer a porous medium of anisotropic permeability to obtain favourable conditions such as drag reduction or enhanced mixing.
Research in the past has mainly focused on porous surfaces with isotropic permeability that have as a main effect the destabilization of the mean flow and the enhancement of the Reynolds shear stresses with a consequent increase in skin-friction drag in wall bounded turbulent flows. Beavers et al. (1970) provided the first experimental evidence that an isotropic porous wall played a destabilising role on the mean velocity field. More recently, Tilton & Cortelezzi (2006, 2008) have performed a three-dimensional temporal linear stability analysis of a laminar channel flow bounded by an isotropic porous wall proving
that wall permeability can drastically decrease the stability of the flow. Breugemet al.
(2006) have numerically studied the influence of a highly permeable porous wall, made of a packed bed of spheres, on a turbulent channel flow. The results show that the structure and the dynamics of turbulence are quite different from those of a canonical turbulent flow over a smooth, impermeable wall. In particular, it turns out that low- and high-speed streaks and the coexisting quasi-streamwise vortices loose intensity as compared to the solid wall case. Moreover, in agreement with other authors they report the presence of relatively large spanwise vorticity structures that contribute to increase the exchange of momentum between the porous medium and the channel, thus inducing a strong increase in the Reynolds-shear stresses and, consequently, in the resulting skin friction. Rostiet al.
(2015) extended the analysis to a porous material with relatively small permeability where the inertial effects within the porous layer can be neglected. In this context, they highlighted the decoupled roles played by porosity and permeability. They also showed that porous media characterized by the same porous length scale in viscous units deliver the same effect on the outer turbulent flow. Sugaet al.(2010) conducted an experimental investigation on the effects of wall permeability on laminar-turbulent transition in channel flows observing that the slip velocity over the permeable wall increases dramatically in the range of critical Reynolds numbers. In addition, consistently with the results of the linear stability analysis of Tilton & Cortelezzi (2006, 2008), they found that the transition to turbulence appears at progressively lower Reynolds numbers as the value of the isotropic permeability is increased. They also showed that in a turbulent regime, the fluctuations of the normal-to-the-wall velocity component increase as the wall permeability and/or the Reynolds number increases. All the previously reported results were obtained considering porous isotropic walls and only recently anisotropic permeable coatings have received some attention. Linear stability analysis (Deepuet al.2015; Gomez-de Seguraet al.2017) has shown that anisotropic porous layers provide an effective mean for the passive control of turbulence transition being able to modulate the value of the critical Reynolds number for parallel wall bounded flows. Preliminary simulations of wall bounded turbulent flows have shown a potential for drag reduction (Gomez-de Seguraet al.2017). In particular, by means of stability analysis, the authors show that relaxing wall permeability triggers a Kelvin-Helholtz instability which is responsible for the appearance of elongated spanwise vorticity structures. They also provide an upper bound for the achievable maximum drag reduction and, using preliminary DNS results, they show that anisotropic coatings may palliate the drag increase produced by isotropic ones. Abderrahaman-Elena & Garc´ıa-Mayoral (2017) conducted a detailed a priori analysis to assess the potential of these surfaces, and predicted a monotonic decrease in friction as the streamwise permeability increases. Very recently, Kuwata & Suga (2017) have used a DNS based on a Lattice Boltzmann MRT method to simulate a turbulent channel flow over a porous layer. The directional permeabilities are modulated by assembling square porous arrays along the Cartesian directions. In particular, they have considered four combinations obtained by adding to the permeability in the wall normal direction permeabilities along the streamwise and spanwise axis. Similarly to our findings, they also report strong effects on the structure of wall turbulence even at low permeability values. Differently, from the present study they do not consider the case in which wall normal permeability is reduced while the cross plane one is enhanced, a condition that it will be shown leading to drag reduction.
In this work, we present Direct Numerical Simulations (DNS) of a plane turbulent channel flow at a constant bulk Reynolds number (Reb = 2800) bounded by two porous
y
z
x
2h
-0.2h U
Lz
Lx
Ly
[image:4.595.123.460.98.221.2]0 (2+0.2)h
Figure 1.(a) Sketch of the channel geometry (not in scale), with interfaces between the fluid and the porous region located aty= 0 and 2h, and two solid rigid walls aty=−hpand 2h+hp.
(b) Domain side view and sketch of the volume average process.
with different entries in the permeability tensor. It will be shown that porous walls char-acterised by an anisotropic permeability allow for an effective passive manipulation of the near-wall turbulent flow. In particular, by tailoring the directionality of the permeability tensor one can either obtain a significant drag increase or decrease with decreased or enhanced local mixing. Either of the two outcomes can be beneficial depending on the technological application under consideration (e.g., skin friction drag reduction or separa-tion control in an aerodynamic scenario). As also highlighted by Kuwata & Suga (2017), the modulation of the directional values of the permeability leads to completely different turbulence topologies in the near wall region where modulation or destruction of velocity streaks depends on the enhancement or suppression of Kelvin Helmholtz spanwise rollers.
2. Formulation
We consider a fully developed turbulent plane channel flow of an incompressible viscous fluid. The flow domain is delimited by two identical, flat, rigid, homogeneous, porous layers sealed by impermeable walls at their outer edges as shown in figure 1. The lower and upper interfaces between the fluid and the porous material are located at y = 0 and y = 2h, while the lower and upper impermeable walls are located at y = −0.2h and y = (2 + 0.2)h respectively. As commonly done, we characterise the porous layer using porosity ε, a scalar quantity defined as the ratio of the volume of void over the total volume of a given material, and permeabilityKwhich is a symmetric second order, positive definite tensor that relates the velocity vector and the pressure gradient in a Darcy’s porous medium providing a direct measure of the ease with which a fluid flows through the medium along a certain direction. In the case of isotropic porous media, the off-diagonal terms are null and the diagonal ones assume the same value. Apart from isotropic cases, this study will also consider anisotropic media characterised by a diagonal permeability tensor. In particular, the entries of the non-dimensional permeability tensor σij =
p
Kij/hare taken to be null ifi6=j,σij =σyifi=j= 2 andσij =σxz otherwise.
This choice is quite general since the permeability tensor is always diagonalizable along the principal directions with real, positive eigenvalues. We also introduce a characteristic Reynolds number asReb=Ubh/ν, whereν =µ/ρis the fluid kinematic viscosity (µand
ρbeing the fluid dynamic viscosity and density, respectively),his half the layer to layer distance andUbthe bulk velocity. The latter is defined as the average of the mean velocity
computed across the whole domainUb= 2(h+1hp)
R2h+hp
−hp u(y)dy' 1 2h
R2h
0 u(y)dy, withhp either set to zero when the wall is solid, or 0.2hin the porous wall case (Breugemet al.
velocity magnitudes inside the layer are in the order of 10−4 of the bulk velocity. In the continuum limit, the flow of an incompressible viscous fluid through the whole domain that includes the porous layers, as sketched in figure 1(a), is governed by the Navier-Stokes equations. However, within the porous media, the imposition of the boundary conditions on the highly complex solid matrix and the related resolution requirements make this direct approach almost infeasible. To overcome these difficulties, Whitaker (1969, 1986, 1996) proposed to model only the large-scale behaviour of the flow in the porous medium by averaging the Navier-Stokes equations over a small sphere, of volume V and radiusr, as illustrated in figure 1(b). The introduction of the velocity field splitting (i.e., separation of large and small scales) and the application of the space averaging operator to the Navier Stokes equations leads to the so-called volume-averaged Navier-Stokes (VANS) equations. Rostiet al.(2015) have derived a specific form of the VANS equations when the hypothesis of isotropic porous medium, negligible fluid inertia and scale separation (i.e., `s ∼ `f r Lp, `f and `s being the smallest scales of the
fluid and the solid phase, and Lp the characteristic thickness of the porous layer) are
introduced. The extension of this formulation to anisotropic porous media characterised by a permeability tensor of the form described above can be easily derived following the formal process introduced in Rosti et al. (2015). The resulting set of VANS equations tailored to this specific case reads as:
∂huis
∂t =−ε∇hpi
f
+ 1 Reb
∇2huis
− ε
Reb
huisi
σ2
xz
+hvi
s
j
σ2
y
+hwi
s
k
σ2
xz
, ∇· huis= 0, (2.1) where i, j, and k are the unit vectors in the three coordinate directions. Equations (2.1) are obtained introducing two averaging operators over the volume of fluidVf
con-tained within the elemental porous volume V: the superficial volume-average hφis = 1/V R
VfφdVf, and the intrinsic volume-average hφi
f
= 1/Vf
R
VfφdVf (φ ia any fluid
variable). The first average is linearly related to the second via the porosity value i.e.,
hφis = Vf/V hφi
f
(Ochoa-Tapia & Whitaker 1995) at the interfaces (y= 0 and y= 2) reduce to
u=huis, p=hpif,
∂u ∂y −
1 ε
∂huis
∂y
i+
∂w ∂y −
1 ε
∂hwis
∂y
k= 0. (2.2)
It is worth noting that, imposingτ= 0 guarantees a general validity of the jump boundary condition (Minale 2014a,b). Moreover, the jump free condition on the shear stress that we have adopted corresponds to the one used by Minale. The validity of the latter has been experimentally verified by Carotenutoet al.(2015). Finally, the outermost portions of the porous layers are bounded by impermeable walls where no-slip and impermeability conditions are applied.
The governing equations are conveniently made independent of pressure and refor-mulated in terms of wall-normal velocity and vorticity,v and η (Kimet al. 1987). The derivation of the VANS in the poloidal-toroidal setting for the considered anisotropic medium can be easily obtained following Rostiet al.(2015).
2.1. Numerical discretisation and simulations parameters
The discrete counterpart of the governing equations (2.1) and the interface conditions (2.2) are numerically tackled using a modified version of the code used for obtaining the results presented in Rostiet al.(2015). In what follows we shall give a short summary of the main numerical features of the code. Readers interested in further details can refer to Rostiet al. (2015). The governing equations are discretised in a box that is doubly periodic in the streamwise, x, and spanwise, z, directions. The spatial discretisation is spectral in the (x, z) planes using Fourier series while in the wall normal direction, fourth order compact finite-difference schemes are used. The time discretisation is based on a third order Runge-Kutta scheme for the nonlinear convective terms, which are computed in physical space using dealiasing in (x, z) according to the 2/3 rule, and on an implicit Crank-Nicolson scheme for the viscous and Darcy’s terms. All the results that will be presented have been obtained on a single computational box which size on the (x, z) plane is [4πh×2πh]. The periodic directions have been discretised using 256×256 Fourier modes before dealiasing. In the wall-normal direction, 150 grid points are used in the fluid region while 75 nodes are employed in each porous slab. In the (x, z) planes the chosen discretisation in wall units (indicated by the superscript+) leads to a spatial resolution of ∆x+ ≈8.8 and ∆z+ ≈4.4. The wall-normal resolution ∆y+ varies from 0.16 by the interface to 4.1 in the centerline region. Here the viscous wall units are defined using as friction velocityuτ =
p
τtotal/ρ, being τtotal the total stress, i.e., the sum of the viscous
and the Reynolds stress evaluated at the fluid/porous interface (Breugem et al. 2006). Using uτ as a velocity scale, we define the friction Reynolds number asReτ =uτh/ν.
Although the size of the computational domain and the spatial resolution are comparable to those employed by Kimet al.(1987) at a similar bulk Reynolds number in a solid walls, plane turbulent channel flow, a further assessment on their adequacy has been checked a-posteriori. All the simulations have been initialised from the same field obtained from the DNS of a fully developed turbulent channel flow with solid walls. Initially, the simulations with porous layers have been advanced in time until the flow reached a statistical steady state. From this moment, the calculations are continued for an interval of 600h/Ub time
units, during which 120 full flow fields are stored for further statistical analysis. To verify that the time interval was sufficiently long for accumulating statistically converged data, we have systematically compared sequences of first and second order statistics, sampled during the integration time, to guarantee the achievement of a final satisfactory convergence.
Case 103 σ
xz 103σy ψ Reτ DR% ui
Iσ↓ 0.2500 0.2500 − 181 −3 0.0029 Iσ 1.0000 1.0000 1 182 −6 0.0090 Iσ↑ 4.0000 4.0000 − 188 −12 0.0384
Aσxz↓σy↑ 0.2500 4.0000 0.0625 198 −21 0.0034
Aσxz↑σy↓ 4.0000 0.2500 16 177 1 0.0336
Aσxz↑↑σy↓↓ 8.0000 0.1250 64 171 8 0.0632
Aσxz↑↑↑σy↓↓↓ 16.0000 0.0625 256 164 18 0.1149
Table 1.Summary of the DNSs performed at a fixed bulk Reynolds number equal toRe= 2800 and with different porous layers, all with height 0.2hand porosityε= 0.6. The columns report the value of the wall-parallelσxzand wall-normalσy permeabilities, the anisotropy parameter
ψ=σxz/σy, the friction Reynolds numberReτ, the drag reduction percentageDR% and the
mean velocity at the interfaceui, respectively.
number Reb = 2800. In practice, we have considered flows sharing the same flow rate,
thus facilitating the comparison with the baseline solid-walls case and also allowing to have a direct measurement of the total drag from the required mean pressure drop. The low value of the considered Reynolds number does not allow for an analysis for cases with a clear scale separation, however it still provides a valuable insight of the effect of the porous layers on the near wall flow. As discussed by Rostiet al.(2015), when varyingRe (at least within a range of moderate to low values), the average flow variables near the interface still scale with viscous units provided that the permeability values are adapted to match the value of the porous Reynolds numberReK =
p
e
Kuτ/ν (Ke is a measure of
the magnitude of the permeability tensor,Ke = max (σxz, σy)). Apart from the Reynolds
number, the other parameters that are kept invariant throughout all the simulations are: the porosity of the slabs supposed to be homogeneous and the width of the porous layers hp. In particular, we have chosen an intermediate value for the porosity (i.e., ε= 0.6),
because its impact on the flow field is marginal as compared to the effects of permeability variations (Rostiet al.2015). We also have selected a porous layer thickness (hp= 0.2h)
which size is large enough to host a wide region where Darcy’s regime is verified (i.e., the transition region from the interface into the porous layer is small compared to the total thickness). Table 1 summarises the parameters defining all the simulations that have been carried out. Starting from the baseline case, denoted by Iσ↓, we have studied the effects of increasing permeability in the wall-normal (Aσxz↓σy↑), wall-parallel (Aσxz ↑σy↓),
and in all directions (Iσ↑). We have also studied the effect of anisotropy, by varying the value of the ratioψ=σxz/σy. In particular, we have considered cases with permeability
values assigned as σxz = aσ and σy = σ/a, where σ is the value of permeability of
the isotropic case, and a is a nondimensional constant constant set to the values 1/4 (Aσxz ↓σy ↑), 1 (Iσ), 4 (Aσxz ↑σy↓), 8 (Aσxz↑↑σy↓↓), and 16 (Aσxz ↑↑↑σy↓↓↓).
0 10 20
-0.5 0 1 2
∆
u/u
τ
y/h
0 1 2 3
-0.5 0 1 2
[image:8.595.92.475.101.250.2]y/h
Figure 2.(a) Mean streamwise velocity profile and (b) root mean square velocity profiles in wall units as a function of the wall-normal distance y. The figure shows the comparison of our numerical results (solid lines) with those reported by Kuwata & Suga (2017) (symbols). The blue, red and black colours are used for streamwise, wall-normal and spanwise direction component, respectively.
in all our simulations the ratio between the two terms remains below 10−3, thus render-ing inertial effects negligible in the porous layers. The validity of the adopted interface condition is implicitly ensured by the choice of imposing the continuity of the stresses, i.e., τ = 0. In this case, as discussed by Tilton & Cortelezzi (2008), inertial effects can be neglected in the interface shear matching condition without any limitation. As al-ready mentioned, this choice turns out to be equivalent to the one proposed by (Minale 2014a,b), which has been experimentally verified by Carotenutoet al.(2015).
2.2. Code validation
Before moving to the results, we provide here the validation of the proposed mathematical and numerical method, by simulating the turbulent channel flow over an anisotropic porous wall and comparing the results with those by Kuwata & Suga (2017). The channel is bounded on one side by an impermeable wall and on the other one by a porous medium (ε= 0.56), with wall-normal permeability equal toσy= 0.036 and zero wall-parallel one. Note that, we setσxz = 10−8 instead of 0 to avoid a division by zero. The bulk Reynolds number is equal to 1775 and the corresponding friction Reynolds number to Reτ = 111. Figure 3 shows the mean (left panel) and root mean square (right panel) velocity profiles as a function of the wall-normal coordinate. An overall good agreement between our solution (solid lines) obtained by the volume averaged equations equation (2.1) and the reference one (symbols) obtained by a direct wall-resolving numerical simulation is evident. This validation is twofold: i) we have validated our mathematical model and proved the validity of both the equations in the porous media (equation (2.1) ) and the interface jump condition (equation (2.2)) for values of permeability magnitude double the one used in the rest of the work; ii) we have validated the numerical solution of the equations.
3. Results
We start by considering the effect of the wall-normal and wall-parallel permeability on the mean friction coefficient. The friction Reynolds numbersReτ, reported in figure 3(a)
and in table 1 (Reτ = 178 in the reference, impermeable case) grows to 181 (Iσ↓) and
198
-20 -10 0 10 20
0.01 0.1 1 10 100 0 0.03 0.06 0.09 0.12
D
R
%
ui
[image:9.595.101.474.96.256.2]ψ
Figure 3. (a) Symbolic representation of the friction Reynolds number Reτ as a function
of the permeability in the wall-normalσy and wall-parallel directionσxz (axis not to scale).
The sketches in the left figure represent conceptual arrangements of porous material of various textures. (b) Profile of the drag reduction (black line) and the mean streamwise velocity ui
at the interface (grey line) as a function ofψ; blue, green, red, orange and magenta symbols are used for the cases Aσxz ↓ σy ↑, Iσ, Aσxz ↑ σy ↓, Aσxz ↑↑ σy ↓↓, and Aσxz ↑↑↑ σy ↓↓↓,
respectively.
wall-parallel one (Aσxz ↓σy ↑), the friction Reynolds number further increases to 198,
while on the contrary when the wall-parallel component increases and the wall-normal reduces (Aσxz ↑ σy ↓), we recover a value close to the impermeable case (i.e., 177).
Note that, the two anisotropic cases and Iσ ↑ have the same permeability magnitude; from their comparison we can observe that loweringσy or σxz produces opposite effects
on the Reτ of almost the same amplitude. When the degree of anisotropy is increased
(i.e., higherψ values) a stronger drag reduction is observed (note that figure 3(a) also provide conceptual sketches of the considered porous materials). This effect is also visible in figure 3(b), that shows the percentage variation of the total dragDRas a function of ψ. Here, the drag reduction variations are quantified by the ratioDR = (G0−G)/G0, whereGandG0are the mean pressure drops in the streamwise direction in the porous and solid wall cases, respectively. It is noted that the drag reduction increases monotonically withψreaching a value of about 20% within the considered range of permeability ratios (ie ψ values that can be safely modeled with a Darcy’s approach). The most striking feature of this graph is that the recorded drag reduction does not show any saturation level and that it could probably reach even higher values at higherψ. This behaviour is remarkable when compared to other passive drag reduction techniques such as riblets that do present a drag reduction saturation with increased protrusion heights. Figure 3(b) also displays the mean slip velocity at the interfaceui as a function of ψ. Consistently with
the behaviour of the variations of the drag reduction, the mean streamwise velocity on the interface monotonically increases within the range of consideredψ. Although a direct comparison with the results of Kuwata & Suga (2016) is not possible since these authors vary all the parameters (bothε and the three components of the permeability tensor), they observe a similar behavior for differentσy, i.e., the friction Reynolds numberReτ
increases withσy.
Figure 4(a) shows the profiles of the difference of the mean velocity and the interface velocity (i.e., ∆u=u−ui), normalised with the friction velocity, versus the logarithm
0 5 10 15 20
1 10 100
∆
u/u
τ
y+
0 1 2 3 4 5
-0.2 0 0.2 0.4 0.6 0.8 1
K
/u
2 τ
y/h
0 0.01 0.02
-0.2 0 0.2 0.4 0.6 0.8 1
y/h
0 0.2 0.4
-0.02 0 0.08
−
I
I
III iso
axi
axi
2C
1C
[image:10.595.94.480.100.378.2]2Caxi
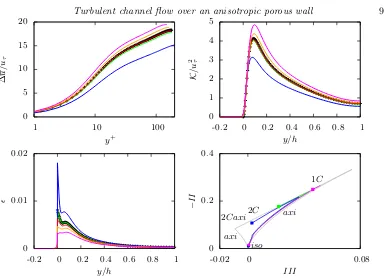
Figure 4.(a) Comparison of the streamwise mean velocity profileuover rigid (+ symbols) and porous walls (solid lines) in wall units. Wall-normal profiles of (b) the turbulent kinetic energy
Kand of (c) the turbulent dissipation. (d) The Lumley’s triangle on the plane of the invariants
−IIandIII of the Reynolds stress anisotropy tensor; the bounding grey line shows the region of admissible turbulence states, amid the extremal states of one-component turbulence (1C), two-components turbulence (2C), axisymmetric turbulence (axi), two-component axisymmetric turbulence (2C axi) and isotropic turbulence (iso). The bullets correspond toy = hand the square toy= 0. The colour scheme in all the graphs is the same as in figure 3.
y+'30) is also visible. Figure 4(a), shows that the velocity profiles from all simulations overlap in the viscous sublayer, depart in the buffer layer, and reach the equilibrium range with a logarithmic profile. The profiles reveal an upward shift in the log-law region (with respect to the impermeable walls case) in the drag-reducing cases (whenψ >1), and a downward shift when the drag increases.
The wall-normal distributions of the turbulent kinetic energy K =u0iu0i/2 are shown in figure 4(b) together with the reference impermeable case. The profiles are strongly affected by the porous walls, especially close to the interface, where they take on non-zero values due to the relaxation of the no-slip condition on the permeable walls: a decrease in drag is accompanied by an increase ofKat the wall. Increasing the anisotropy parameterψalso produces higher peaks with the maxima locations shifting towards the wall. Those increased values can be attributed to the amplification of the streamwise velocity fluctuations associated with an enhancement of the streaky structures above the walls, which will be further discussed.
Figure 4(c) displays the profiles of turbulent dissipation rate=µ∂ju0i∂ju0i. The cases
z+ z+ z+
x+ x+ x+
y/h
y/h
0
0 00 0
0 0
300 300 300
300 300 300
-0.2
-0.2
0.2
[image:11.595.100.474.107.246.2]0.2
Figure 5.(a) Contours of instantaneous streamwise velocity fluctuation at the interfacey= 0 (flow going from bottom to top). The colors range from −0.4ui (blue) to 0.4ui (red). (b-top)
Streamwise velocity autocorrelation as a function ofx+; (b-bottom) wall-normal velocity auto-correlation as a function ofz+. The solid and dashed lines correspond to positive and negative values, ranging from−0.1 to 0.9 with a step of 0.2. The color scale ranges from−0.2 (blue) to 1.0 (red). In each block, the figures refer to the drag-increasing Aσxz↓σy ↑, isotropic Iσ, and
drag-reducing Aσxz↑↑↑σy↓↓↓cases (ψincreases from left to right).
In all the cases, both the turbulent kinetic energyK and the dissipationdrop to zero very quickly when entering the porous layer where the velocity fluctuations are mainly damped by the porous material itself.
a long spanwise correlation length of the normal velocity establishes in the interface re-gion. The appearance of this weak but coherent upwash and downwash motions may be related with an incipient emergence of the already mentioned spanwise rollers that would lift and splash the velocity streaks by the wall thus disrupting their coherence (Jim´enez
et al.2001).
In summary, whenψ >1 (i.e., high wall-parallel and low wall-normal permeability), the flow is strongly correlated in the streamwise direction delivering a net drag decrease. On the other hand, whenψ <1 (i.e., high wall-normal and low wall-parallel permeability), the flow tends to become more isotropic because of the fragmentation of the elongated streamwise streaks and the eventual formation of new spanwise coherent structures. This type of phenomenon has been reported by other authors dealing with turbulent flows bounded by an isotropic permeable wall (Jim´enezet al.2001; Garc´ıa-Mayoral & Jim´enez 2011; Rosti & Brandt 2017). Figure 4(d) is a further evidence of the flow coherence mod-ifications induced by the variations of the porous media permeability. In the diagram, the flow topology is clearly indicated by the shape of the Lumley’s invariant maps computed for the isotropic layer and the most drag-reducing and most drag-increasing anisotropic cases. While the map for theψ >1 case (i.e., the drag reducing condition) shows a trend towards a one-component behaviour as the interface is approached, theψ≤1 cases show a modification towards a two-components turbulence behaviour.
4. Conclusion
We have numerically investigated the effect of the porous media anisotropy on a plane turbulent channel flow bounded by porous layers. For a fixed, low Reynolds number and an intermediate porosity value, the flow inside the fluid region is tackled via a standard DNS, while a volume averaged approach is employed inside the porous layer. The two sets of equations are coupled imposing velocity and stress continuity at the interface. We showed that total drag over an anisotropic porous wall can be reduced or enhanced at least as much as 20% by varying the ratio of the parallel to the wall and normal permeabilities ψ. A drag reducing behaviour is achieved wheneverψ > 1, while a drag increase is recorded for ψ ≤ 1. Differently from other passive control strategies (i.e., riblets), the drag reduction does not seem to saturate in the range of ψ values that we have considered (in the case of riblets drag reduction saturates with the protrusion height). This behaviour suggests that porous material exhibiting high ψ values, e.g. a grid of rods parallel to the streamwise and spanwise directions (`a la millefeuille), may have a potential for even larger drag reductions. Such materials would reduce the wall-normal fluctuations while providing an enhanced slip velocity, thus leading to an overall decrease of the total interface stress. The reduced permeability also prevents the emergence of spanwise rollers induced by an inflectional instability of the mean velocity profile at the interface. On the other hand, porous materials with high wall-normal and low wall-parallel permeabilities, e.g., a carpet of wall-normal rods, are characterized by an increased turbulence isotropy in the near-to-the-interface region with a consequent disruption of the streamwise coherence probably due to the emergence of alternating spanwise correlated structures also leading to an increased drag.
Although a practical design of the solid matrix that would deliver permeability ratios as those used here has not been envisaged yet, the present result complement the recent ones by Kuwata & Suga (2017) who have modelled the anisotropy of the medium by stacking cubic open elements. The most important result of the present research, not covered by the mentioned work, is a conceptual demonstration of the possibility of assembling a porous medium that can deliver large drag reductions in internal and external turbulent flows.
Acknowledgment
This work was supported by the ERC-2013-CoG-616186 TRITOS, and by the VR 2014-5001. A. P. was supported by the UK-EPSRC grant EP/N01877X/1Quiet Aerofoils of the Next Generation. The authors acknowledge the computer time provided by SNIC.
REFERENCES
Abderrahaman-Elena, N & Garc´ıa-Mayoral, R2017 Analysis of anisotropically permeable surfaces for turbulent drag reduction.Physical Review Fluids2(11), 114609.
Beavers, G S, Sparrow, E M & Magnuson, R A1970 Experiments on coupled parallel flows
in a channel and a bounding porous medium.Journal of Basic Engineering92, 843–848.
Breugem, W P, Boersma, B J & Uittenbogaard, R E2006 The influence of wall perme-ability on turbulent channel flow.Journal of Fluid Mechanics562, 35–72.
Carotenuto, C, Vananroye, A, Vermant, J & Minale, M2015 Predicting the apparent wall slip when using roughened geometries: a porous medium approach.Journal of Rheology
59(5), 1131–1149.
Deepu, P, Anand, P & Basu, S 2015 Stability of poiseuille flow in a fluid overlying an anisotropic and inhomogeneous porous layer.Physical Review E 92(2), 023009.
Garc´ıa-Mayoral, R & Jim´enez, J2011 Hydrodynamic stability and breakdown of the viscous regime over riblets.Journal of Fluid Mechanics 678, 317–347.
Jim´enez, J, Uhlmann, M, Pinelli, A & Kawahara, G2001 Turbulent shear flow over active
and passive porous surfaces.Journal of Fluid Mechanics442, 89–117.
Kim, J, Moin, P & Moser, R1987 Turbulence statistics in fully developed channel flow at low Reynolds number.Journal of Fluid Mechanics177, 133–166.
Kuwata, Y & Suga, K 2016 Transport mechanism of interface turbulence over porous and
rough walls.Flow, Turbulence and Combustion 97(4), 1071–1093.
Kuwata, Y & Suga, K2017 Direct numerical simulation of turbulence over anisotropic porous media.Journal of Fluid Mechanics 831, 41–71.
Minale, M2014aMomentum transfer within a porous medium. I. Theoretical derivation of the
momentum balance on the solid skeleton.Physics of Fluids (1994-present)26(12), 123101.
Minale, M2014b Momentum transfer within a porous medium. II. Stress boundary condition.
Physics of Fluids (1994-present)26(12), 123102.
Ochoa-Tapia, J A & Whitaker, S1995 Momentum transfer at the boundary between a porous
medium and a homogeneous fluid - I. Theoretical development.International Journal of Heat and Mass Transfer 38(14), 2635–2646.
Ochoa-Tapia, J A & Whitaker, S1998 Momentum jump condition at the boundary between a porous medium and a homogeneous fluid: inertial effects. Journal of Porous Media 1, 201–218.
Quintard, M & Whitaker, S 1994 Transport in ordered and disordered porous media ii:
Generalized volume averaging.Transport in Porous Media 14(2), 179–206.
Rosti, M E & Brandt, L2017 Numerical simulation of turbulent channel flow over a viscous hyper-elastic wall.Journal of Fluid Mechanics830, 708–735.
Rosti, M E, Cortelezzi, L & Quadrio, M 2015 Direct numerical simulation of turbulent
channel flow over porous walls.Journal of Fluid Mechanics784, 396–442.
by anisotropic permeable coatings. In 10th International Symposium on Turbulence and Shear Flow Phenomena - TSFP10.
Suga, K, Matsumura, Y, Ashitaka, Y, Tominaga, S & Kaneda, M2010 Effects of wall permeability on turbulence.International Journal of Heat and Fluid Flow 31, 974–984.
Tilton, N & Cortelezzi, L 2006 The destabilizing effects of wall permeability in channel
flows: A linear stability analysis.Physics of Fluids (1994-present)18(5), 051702.
Tilton, N & Cortelezzi, L2008 Linear stability analysis of pressure-driven flows in channels
with porous walls.Journal of Fluid Mechanics 604, 411–445.
Whitaker, S.1969 Advances in theory of fluid motion in porous media.Industrial and Engi-neering Chemistry 61(12), 14–28.
Whitaker, S1986 Flow in porous media I: A theoretical derivation of Darcy’s law.Transport in Porous Media1(1), 3–25.