City, University of London Institutional Repository
Citation
:
Nadimi, S. and Fonseca, J. (2017). A micro finite element model for soil
behaviour: Numerical validation. Géotechnique, doi: 10.1680/jgeot.16.P.163
This is the published version of the paper.
This version of the publication may differ from the final published
version.
Permanent repository link:
http://openaccess.city.ac.uk/18101/
Link to published version
:
http://dx.doi.org/10.1680/jgeot.16.P.163
Copyright and reuse:
City Research Online aims to make research
outputs of City, University of London available to a wider audience.
Copyright and Moral Rights remain with the author(s) and/or copyright
holders. URLs from City Research Online may be freely distributed and
linked to.
City Research Online:
http://openaccess.city.ac.uk/
[email protected]
TECHNICAL NOTE
A micro finite-element model for soil behaviour: numerical validation
S. NADIMIand J. FONSECA†
A micro finite-element (μFE) model capable of handling arbitrary shapes and deformable grains has been developed by the authors. The basis of thisμFE model is to use a virtualised soil fabric obtained from micro computed tomography (μCT) of real sand to simulate grain-to-grain interaction in a framework of combined discrete–finite-element method. By incorporating grain deformation into the model, the contact response emerges from the interaction of contacting bodies and each irregular contact area will produce a unique response. A detailed numerical description of grain morphology and contact topology of a natural sand and the subsequent simulation are presented in the original paper. The present study focuses on the numerical validation of the constitutive contact behaviour against existent theories, for a single sphere and an assembly of spheres. The ability of the model to simulate elastic–plastic behaviour making use of the deformability of the grains is demonstrated. The unloading–reloading behaviour associated with the geometrical arrangement of the grains for a granular assembly under triaxial compression is examined in terms of energy dissipation quantities.
KEYWORDS: fabric/structure of soils; particle-scale behaviour; numerical modelling; sands
INTRODUCTION
The irregular shape of sand particles originates complex contact topologies (e.g. Fonsecaet al., 2013), which differ significantly from the point contact condition assumed for deriving theoretical contact laws (Thornton, 2015). This implies that the ideal shapes and conventional contact laws used for the most part in discrete-element method (DEM) studies may be of limited application to model real sand. According to previous experimental studies (e.g. Cavarretta, 2009; Cavarretta et al., 2010; Cole et al., 2010; Senetakis et al., 2013), contact response depends not only on contact topology, but also on previous loading history and de-formation mechanisms that the grain undergoes during rearrangement under loading. In addition, particle re-arrangements computed based on inter-particle penetration in DEM may lead to the misrepresentation of the kinematics in granular media.
The micro finite-element (μFE) model (Nadimi & Fonseca, 2017) was developed with the aim of providing a more realistic representation of the physics of granular behaviour by incorporating the actual particle morphology and contact topology of real soil into deformable numerical grains. One advantage of representing grains as deformable bodies is the possibility of introducing plasticity at the grain-scale. Continuum deformable representation of ideal shapes using finite elements has been considered previously, particularly in powder technology (e.g. Harthonget al., 2009; Nezamabadiet al., 2015; Rathboneet al., 2015). The use of combined finite–discrete approaches to model systems of spheres is, however, not well established. This paper fills this gap by providing the numerical validation of theμFE model
for an assembly of spheres. Moreover, the finite-element (FE) discretisation is assessed for a single sphere and the elastic– plastic behaviour of a granular system is simulated under triaxial compression.
BEHAVIOUR OF A SINGLE SPHERE
The problem here consists of modelling the contact between two identical spheres under loading (Fig. 1). The material parameters used in the simulation are listed in Table 1. An explicit integration scheme was employed so that the same procedure can be used to simulate an assembly of grains (Nadimi & Fonseca, 2017). The properties of hard contact behaviour – that is, all the force is trans-mitted through the contact–were defined between the two contacting bodies.
Mesh size effect
The simulation results are mesh size dependent. Although using a very fine mesh will yield more accurate results, the computational cost involved to simulate a large assembly of grains would require optimising the mesh size value. In order to investigate the effect of mesh size and find the optimal value, a range of mesh sizes were examined. The size of the mesh is quantified using the meshing ratio (MR) parameter, defined as follows
MR¼s=2R ð1Þ
wheresis the seeding distance andRis the sphere’s radius. An example of a seeding distance of 0·1 on a sphere with a radius of 1·1 mm, which leads to 70 seeds along one perimeter, is presented in Fig. 2(a). Figs 2(b), 2(c) and 2(d) show examples of three spheres with different meshing ratio used in this study.
Normal loading
Hertz theory provides a relationship between normal force (FN) and displacement for two elastic spheres in contact Department of Civil Engineering, City, University of London,
London, UK (Orcid:0000-0002-0971-7089).
†Department of Civil Engineering, City, University of London, London, UK (Orcid:0000-0002-7654-6005).
Manuscript received 27 June 2016; revised manuscript accepted 22 June 2017.
(Hertz, 1882). In this case,FNcan be determined from the following equation
FN¼ ð ð
Sσ
zzds¼FHertz¼ 4 3E
pffiffiffiffiRδ3=2
n ð2Þ
where E* is the effective contact stiffness given by E¼E=ð1ν2Þ,Ris the sphere’s radius,δ
nis the normal displacement, S denotes the contact area, E is the elastic modulus andνis the Poisson’s ratio.
The simulation of an elastic sphere under normal loading was conducted using different meshing ratios, as shown in Fig. 3. As the mesh becomes more refined for MR increasing values of 0·090, 0·045 and 0·014, no significant difference can be observed in comparison with the reference results. Only for very coarse meshing, that is, MR = 0·364, is a very dissimilar response observed.
Tangential loading
Mindlin (1949) and Mindlin & Deresiewicz (1953) investigated the elastic deformation of two contacting spheres under tangential loading. Based on their results, the tangential force–displacement can be described as follows
FM&D¼ ð ð
sσ
xyds¼μFN 1 1
minðj jδt;δt maxÞ
δt max
3=2
( )
ð3Þ
[image:3.595.320.550.55.207.2] [image:3.595.101.247.60.218.2] [image:3.595.317.548.263.402.2] [image:3.595.56.295.302.475.2] [image:3.595.321.554.455.497.2]whereμis the friction coefficient,δt maxis the maximum tangen-tial deflection before sliding, δt max¼05μδnð2νÞ=ð1νÞ, and when |δt|δt maxsliding occurs.
Tangential loading was applied to the sphere, under a constant normal load FN= 5 N, for MR = 0·045 and MR = 0·023. Fig. 4 shows the tangential force–displacement obtained using the results from theμFE against the Mindlin and Deresiewicz (M&D) theory; in this plot two distinct regions can be identified: the ‘stick’ region and the ‘slip’ region. A perfect agreement can be observed for a MR = 0·023. The very small discrepancy in the sticking region, in this case of MR = 0·045 for a tangential displace-ment between 0·2μm and 0·4μm, is related to mesh size only.
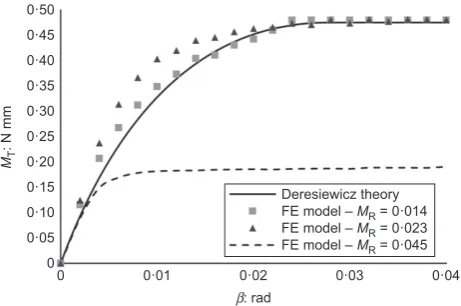
Torsional loading
Torsional loading is defined as the twisting moment (MT) around the axis of the contact normal. WhenMTis applied in combination with normal loading to an elastic sphere, the contact area will undergo rotation (given by the angleβ). The frictional forces at the contact will provide some resistance to sliding. The region that meets the Coulomb’s friction condition will experience sliding and the rest of the contact area will undergo sticking according to the normal forces distribution (Dintwaet al., 2005). Lubkin (1951) provides the x
y z
FN
FSY
FSX
MT
MRY MRX
Fig. 1. Transmitting forces and moments between two spheres in contact: normal force (FN), two tangential forces (FSX and FSY),
twisting (MT) and rolling moments (MRYandMRX)
Table 1. Material parameters used in the simulations
Parameter Symbol Value Units
Young’s modulus E 63 GPa
Poisson’s ratio ν 0·22 —
Density ρ 2·5 t/m3
Coefficient of friction μ 0·22 —
(a) (b) (c) (d)
Fig. 2. (a) Seeding along three perimetrical edges of a sphere and three examples of different meshing ratios: (b) MR = 0·014; (c) MR = 0·045; (d) MR = 0·364
500
450
400
350
300
250
200
150
100
50
0
0 5 10 15 20
Normal displacement: µm
25 30
Normal force: N
Theory
MR = 0·014
MR = 0·045
MR = 0·090
MR = 0·204
MR = 0·364
Fig. 3. Effect of the meshing ratio on normal loading of an elastic sphere
1·2
1·0
0·8
0·6
0·4
0·2
0
0 0·2 0·4
Tangential displacement: µm
0·6 0·8 1·0
T
a
ngential force: N M&D theory
FE model – MR = 0·045 FE model – MR = 0·023
Stick Slip
Fig. 4. The effect of meshing ratio on the tangential response of a sphere,FN= 5 N
NADIMI AND FONSECA
solution to this problem by proposing an equation to determine the shear stress at the contact surface within the stick region, using elliptical integrals. The complexity of Lubkin’s solution was simplified by Deresiewicz (1954) by proposing an explicit approximation betweena,MTandβfor simple implementation, defined as follows
Ga2β μFN ¼
1
8 1
ffiffiffiffiffiffiffiffiffiffiffiffiffiffiffiffiffiffiffiffiffiffiffi
13 2
MT μFNa s
" #
3
ffiffiffiffiffiffiffiffiffiffiffiffiffiffiffiffiffiffiffiffiffiffiffi
13 2
MT μFNa s
" #
ð4Þ
whereGis the shear modulus.
The comparison of theμFE results for different meshing ratio values against Deresiewicz theory is presented in Fig. 5. It can be observed that, although for a mesh ratio of 0·045 there is a large discrepancy between the theoretical and the FE model curves, for finer mesh ratios, of 0·014 and 0·023, a good agreement is shown.
Rotational loading
Rolling resistance or friction is related to energy dissipa-tion due to an asymmetric stress distribudissipa-tion at the contact area. When the stress distribution at the front of the contact region is higher than at the back, this originates a resistance moment, termed rolling resistance. Similarly to the case for MT, the coexistence of slip and stick zones makes the calculation of the rolling moment less trivial. Considering a very small angle of rotation, Johnson (1985) proposed a creep model to calculate the difference between the tangential strains in both the stick and slip areas. For a circular contact area and under a transmitting tractionQx, creep is given by
εx¼
3μFNð43νÞ
16Ga2 1 1 Qx μFN
1=3
" #
ð5Þ
and when under transmitting tractionQy, creep is obtained
as follows
εy¼
3μFNð4νÞ
16Ga2 1 1 Qy μFN
1=3
" #
ð6Þ
The problem of purely rolling for two spheres in contact was simulated in the μFE model under constant normal loading of 70 N. The results of this simulation were compared with Johnson’s theory and depicted in Fig. 6. Similarly to the observations for the torsional loading, although some discrepancy can be observed for an MR of 0·045, for MR values of 0·014 and 0·023 a good agreement between the curves is shown. Here, the rolling resistance is
derived from the actual rotational moment between two contacting bodies, which differs from the artificial rolling resistance used in previous studies to account for the effect of grain shape (Iwashita & Oda, 1998; Jianget al., 2005).
BEHAVIOUR OF AN ASSEMBLY OF SPHERES This section investigates the ability of the model to simulate the response of an assembly of spheres subjected to triaxial compression. First, pure elastic behaviour is assigned to the model, which allows comparison with the theoretical response. The response of the assembly is subsequently investigated using an elastic–plastic model.
Model description
A specimen of 2000 uniform spheres with radius of 1·1 mm and prepared with a face-centred cubic (FCC) packing, was generated within the μFE framework. This FCC packing was chosen so that the analytical failure method proposed by Thornton (1979) for an FCC array of uniform rigid spheres under triaxial compression can be used (e.g. O’Sullivanet al., 2004; Barreto, 2010; Huang, 2014). Frictionless rigid boundaries were applied to the triaxial sample. A hybrid mesh of fine elements at the surface (MR = 0·045) and coarser elements inside the sphere was adopted to reduce the computational cost of the simulation without compromising the accuracy of the results. In total, the model contains 16 197 200 elements and 4 099 372 nodes. The loading process comprises isotropic compression at 50 kPa followed by shearing under controlled strain. The full simulation took approximately 24 h running on a Dell Precision T7610.
Elastic behaviour
The material parameters used in this simulation are indicated in Table 1. Under elastic conditions the failure of the system is believed to occur as a result of the formation of a gap between the initially contiguous spheres. According to Thornton’s solution this so-called ‘failure’ is expected to occur atσ1= 156·4 kPa. In theμFE it was seen to occur at
σ1= 162·5 kPa (Fig. 7(a)). The small difference between these
σ1 values can be attributed to the effect of the rigid boundaries used in the μFE simulation when compared with the infinite boundaries considered in the theoretical formulation. The simulation was run for four additional coefficient of friction values (0·3, 0·4, 0·5 and 0·6) and the measured stress ratioσ1/σ3was compared with the theoretical results. A very good agreement can be observed between the
0·50 0·45 0·40 0·35 0·30 0·25 0·20 0·15 0·10 0·05 0
0 0·01 0·02
β: rad
0·03 0·04
MT
: N mm
[image:4.595.304.538.59.194.2]Deresiewicz theory FE model – MR = 0·014 FE model – MR = 0·023 FE model – MR = 0·045
Fig. 5. The effect of meshing ratio on the relationship torque plotted against twisting angle, for an elastic sphere underFN= 40 N
18 16 14 12 10 8 6 4 2 0
θ: rad
Johnson theory FE model – MR = 0·014 FE model – MR = 0·023 FE model – MR = 0·045
0 0·02 0·04 0·06 0·08 0·10
MR
: N mm
[image:4.595.47.278.598.751.2]response from the μFE model and Thornton’s theory as shown in Fig. 7(b).
Elastic–plastic behaviour
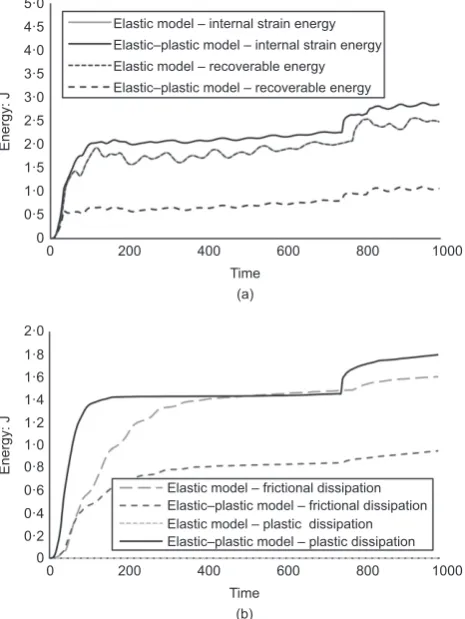
Energy may be dissipated by plastic deformation of the contacting bodies which leads to residual deformation and significantly affects reloading of that particular contact area. Plastic behaviour is introduced for the assembly using an isotropic hardening model with 100 MPa yield stress applied to all particles, similarly to what has been described previously. Failure was observed to occur atσ1= 158 kPa– that is, a slightly lower value when compared with the pure elastic case. The response of the elastic and the elastic–plastic models was compared in terms of energy quantities. The energy balance for the model can be obtained according to the first law of thermodynamics. Fig. 8 shows the evolution of the applied external work with time for both elastic and elastic–plastic models. It can be seen that failure occurs earlier in the elastic–plastic simulation and after failure the external work is also greater for the elastic–plastic case. In order to further investigate the contribution of plasticity, the authors compared recoverable and internal energy and also plastic dissipation and frictional dissipation for both the elastic and the elastic–plastic models. Fig. 9(a) shows that all the internal strain energy is recoverable for the elastic simulation (as shown by the overlapping of the two curves), whereas only approximately one-third of the energy is recoverable in the plastic simulation. This is an indicator of the significant contribution of plasticity on unloading of the grains under shearing. In the elastic–plastic model presented,
the contribution of plastic dissipation is twice the frictional dissipation as depicted in Fig. 9(b). The plastic dissipation curve in Fig. 9(b) also suggests the creation of a new plastic contact surface between the grains that became detached at failure. These observations emphasise the need to include plasticity for discrete simulation of granular media.
Figure 10 shows the distribution of elastic and plastic energy dissipation for the case of a single grain in Hertzian contact. Based on this, Aminiet al. (2015) recently proposed a plastic dissipated energy index for a single elastic–plastic particle given by the ratio between plastic and total contact energy (i.e. the sum of elastic and plastic energies). Using the same concept, a friction dissipated energy index is introduced
4
3
2 σ1
/
σ3
1
0
10
8
6 σ1
/
σ3
4
2
0 0·01 0·02
Axial strain: % Friction coefficient, μ
(a) (b)
0·03 0 0·2 0·4 0·6 0·8
Theory
[image:5.595.111.503.53.215.2]µFE
Fig. 7. μFE results for a triaxial test on FCC packed elastic spheres: (a) stress ratio plotted against axial strain response; (b) comparison with Thornton’s theory in terms of stress ratio plotted against friction coefficient
25
20
15
10
5
0
0 200 400
Time
600 800 1000
Applied external work: J
[image:5.595.318.551.269.579.2]Failure Elastic model Elastic–plastic model
Fig. 8. Applied external work plotted against time for elastic and elastic–plastic models (μ= 0·22)
0 200 400
Time
600 800 1000
0 200 400
Time (a)
(b)
600 800 1000
5·0
4·5
4·0
3·5
3·0
2·5
2·0
1·5
1·0
0·5
0
Energy: J
2·0
Energy: J
1·8
1·6
1·4
1·2
1·0 0·8
0·6
0·4
0·2
0
Elastic model – frictional dissipation Elastic–plastic model – frictional dissipation Elastic model – plastic dissipation Elastic–plastic model – plastic dissipation Elastic model – internal strain energy
Elastic–plastic model – internal strain energy
Elastic model – recoverable energy
Elastic–plastic model – recoverable energy
Fig. 9. (a) Comparison of the internal strain energy with recoverable strain energy for both elastic and elastic–plastic models; (b) comparison of frictional and plastic energy dissipation (μ= 0·22)
NADIMI AND FONSECA
[image:5.595.61.291.269.408.2]here, defined as the ratio between friction energy and total energy. The evolution of those two indices is presented in Fig. 11. It can be seen that the plastic index shows a high increase during isotropic compression and exhibits only small fluctuation in the shearing stage. The friction index continues to increase at the beginning of shearing and shows a little drop at failure. Overall, the plastic energy contribution is higher than the frictional energy dissipation, for this loading scenario.
CONCLUSIONS
The ability of the μFE model to simulate contact behav-iour for a system of spheres was demonstrated here by comparison with theoretical formulations. Mesh size depen-dency was investigated and a hybrid mesh was proposed to improve the computation cost of the simulation. Since contact interaction is modelled based on the deformation of the contacting area and an assigned friction coefficient, this avoids the use of complex contact laws and presents a clear improvement for modelling irregular-shaped particles with complex contact topology found in real sand. Dissipated energy indices for friction and plastic behaviour are introduced to quantify energy dissipation due to unloading–reloading of contacts during grain rearrange-ment. For the case of an assembly of regularly packed spheres under triaxial compression, the greater contribution of plasticity when compared to friction was shown. The results from the simulations presented here illustrate the potential of the μFE approach to simulate more realistic contact interaction of granular media, including soil.
ACKNOWLEDGEMENTS
The authors would like to thank City University of London for the doctoral scholarship of the first author and express gratitude to Dr Tom Shire from Imperial College London, for his suggestions on the last section of the paper.
NOTATION
a radius of contact area E elastic modulus E* effective contact stiffness
Ee elastic energy
EP plastic energy
Et hardening modulus
FM&D tangential contact force
FN normal contact force
G shear modulus MR rolling moment
MT twisting moment
Qx traction force inx-direction Qy traction force iny-direction
R radius of sphere S contact interface/area
s seeding distance
U internal energy per unit mass β twisting angle
δn normal displacement
δt tangential deflection
δt max maximum tangential deflection
ν Poisson’s ratio μ friction coefficient ρ density
σxy shear stress inxyplane along they-axis σzz normal stress along thez-axis
REFERENCES
Amini, S., Tadayon, M., Idapalapati, S. & Miserez, A. (2015). The role of quasi-plasticity in the extreme contact damage tolerance of the stomatopod dactyl club. Nature Mater. 14, No. 9, 943–950.
Barreto, D. (2010).Numerical and experimental investigation into the behaviour of granular materials under generalised stress states. PhD thesis, Imperial College London, London, UK
Cavarretta, I. (2009).The influence of particle characteristics on the engineering behaviour of granular materials. PhD thesis, Imperial College London, London, UK.
Cavarretta, I., Coop, M. & O’Sullivan, C. (2010). The influence of particle characteristics on the behaviour of coarse grained soils. Géotechnique 60, No. 6, 413–423, http://dx.doi.org/ 10.1680/geot.2010.60.6.413.
Cole, D. M., Mathisen, L. U., Hopkinks, M. A. & Knapp, B. R. (2010). Normal and sliding contact experiments on gneiss. Granular Matter12, No. 1, 69–86.
Deresiewicz, H. (1954). Contact of elastic spheres under an oscillating torsional couple.ASME J. Appl. Mech.21, No. 1, 52–56. Dintwa, E., Zeebroeck, M. V., Tijskens, E. & Ramon, H. (2005).
Torsion of viscoelastic spheres in contact. Granular Matter7, No. 2–3, 169–179.
Fonseca, J., O’Sullivan, C., Coop, M. R. & Lee, P. D. (2013). Quantifying the evolution of soil fabric during shearing using scalar parameters. Géotechnique 63, No. 10, 818–829, http://dx.doi.org/10.1680/geot.11.P.150.
Harthong, B., Jérier, J. F., Doremus, P., Imbault, D. & Donzé, F. V. (2009). Modelling of high-density compaction of granular materials by the discrete element method.Int. J. Solids Structs
46, No. 18, 3357–3364.
Hertz, H. (1882). Über die Berührung fester elastischer Körper. J. reine und angewandte Mathematik92, 156–171 (in German). Huang, X. (2014).Exploring critical-state behaviour using DEM. PhD thesis, University of Hong Kong and Imperial College London, London, UK.
Iwashita, K. & Oda, M. (1998). Rolling resistance contacts in simulation of shear band development by DEM.J. Engng Mech.
124, No. 3, 285–292.
1·0
0·9
0·8
0·7
0·6
0·5
0·4
0·3
0·2
0·1
0
0 200 400
Time
600 800 1000
Dissipated energy index
Shearing
Isotropic compression Plastic dissipation index
[image:6.595.84.242.58.176.2]Friction dissipation index
Fig. 11. Dissipated energy index for an elastic–plastic assembly of spheres
Load
Displacement
Ee
[image:6.595.46.277.248.385.2]EP
Jiang, M., Yu, H. S. & Harris, D. (2005). A novel discrete model for granular material incorporating rolling resistance. Comput. Geotech.32, No. 5, 340–357.
Johnson, K. L. (1985). Contact mechanics. Cambridge, UK: Cambridge University Press.
Lubkin, J. L. (1951). The torsion of elastic spheres in contact. ASME J. Appl. Mech.18, No. 2, 183–187.
Mindlin, R. D. (1949). Compliance of elastic bodies in contact. ASME J. Appl. Mech.16, 259–268.
Mindlin, R. D. & Deresiewicz, H. (1953). Elastic spheres in contact under varying oblique forces. ASME J. Appl. Mech.
20, 327–344.
Nadimi, S. & Fonseca, J. (2017). A micro finite-element model for soil behaviour. Géotechnique, http://dx.doi.org/10.1680/ jgeot.16.P.147
Nezamabadi, S., Radjai, F., Averseng, J. & Delenne, J. Y. (2015). Implicit frictional-contact model for soft particle systems. J. Mech. Phys. Solids83, 72–87.
O’Sullivan, C., Bray, J. D. & Riemer, M. (2004). Examination of the response of regularly packed specimens of spherical particles using physical tests and discrete element simulations.J. Engng Mech.–ASCE130, No. 10, 1140–1150.
Rathbone, D., Marigo, M., Dini, D. & van Wachem, B. (2015). An accurate force–displacement law for the modelling of elastic– plastic contacts in discrete element simulations.Powder Technol.
282, 2–9.
Senetakis, K., Coop, M. & Todisco, C. (2013). The inter-particle coefficient of friction at the contacts of Leighton Buzzard sand quartz minerals.Soils Found.53, No. 5, 746–755.
Thornton, C. (1979). The conditions of failure of a face-centered cubic array of uniform rigid spheres. Géotechnique
29, No. 4, 441–459, http://dx.doi.org/10.1680/geot.1979. 29.4.441.
Thornton, C. (2015). Granular dynamics, contact mechanics and particle system simulations. Cham, Switzerland: Springer International.
NADIMI AND FONSECA