Abstract— This paper implements and compares between the key concepts to enable wind power short-term frequency support from electrical and mechanical loads perspectives. Pitch de-loading, kinetic energy extraction and wind turbine (WTG) over-speeding are investigated, where each concept is integrated as a supplementary controller to the conventional controls of WTG. Different patterns of wind speed are examined, step-change and real intermittent of high resolution. The examined aggregated synchronous area has a relatively high wind penetration with frequency support. The overall dynamic inertia of the system is assessed to analyze the impact of the integrated support methods and their key parameters. The coordination between synchronous areas and wind farms, which are interconnected through a multi-terminal high voltage direct current network (MT-HVDC) is examined. A novel definition of the virtual inertia of MT-HVDC grid is proposed. Results show that pitch de-loading secures support reserve most of the time, and kinetic energy extraction provides sustainable support for a short interval, while accelerative de-loading could reach a compromise. The three methods are adaptable with the MT-HVDC holistic frequency support controller, with a slight advantage of kinetic energy extraction over the virtual inertia of the MT-HVDC. Matlab/Simulink® is the simulation environment.
Index Terms—wind power; ancillary services; HVDC; frequency stability; virtual inertia; load fatigue.
I. NOMENCLATURE
DF De-loading factor
Dl, Dg Dynamic load parameters
flow Frequency drop deadband to start support
fm
d Frequency drop to release full reserve
Hd Dynamic inertia of an AC area
HMT-HVDC Virtual inertia of a MT-HVDC grid
J Generation moment of inertia in an AC area
Kacc Accelerative de-loading factor
KE Kinetic energy
Kex KE extraction factor upper limit
MPT Maximum power tracking
MT-HVDC Multi-terminal high voltage direct current grid
N Number of AC areas and OWFs connected
to a MT-HVDC grid
OWFs Offshore wind farms
PC Actual conventional generation in AC rea
Pdc Imported/exported power by AC area or
OWF Po
C Conventional power capacity in AC area
Po
ref WTG available output
Pref Active power reference
PW, PL Instantaneous wind generation and load
demand resp.
R Generation droop of an AC area
RoCoF Rate of change of frequency
Tgen Generation time constant of an AC area
Ts Safe time to recover to normal operation
WS Wind speed
WTG Wind turbine generator
ΔPOWF Increment signal from MT-HVDC control
(suffices l and h stand for upper and lower limits resp.)
τref Reference torque (suffix 'o' stands for
nominal value)
ωlow Lower limit of WTG rotor speed
ωo WTG nominal rotor speed
ωR WTG rotor speed upper limit
II. INTRODUCTION
HE high penetration of wind energy into power systems excavates many challenges to maintain system stability. The retirement of conventional generation will apply strict requirements from wind power plants during frequency excursions, which will make the provision of frequency support mandatory [1, 2]. The sudden imbalance between generation and load demand causes the system frequency to deviate from its nominal value, whereas the rate of deterioration and frequency nadir mainly rely on system inertia, severity of power imbalance, and load dynamic behavior. At the early stage of the
Insights on the Provision of Frequency Support
by Wind Power and the Impact on Energy
Systems
A. B. Attya and J.L. Dominguez-García
T
This work was partly supported by EU FP7 IRPWIND project (grant no. 609795).
A. B. Attya is with the Department of Electronic and Electrical Engineering, University of Strathclyde, Glasgow, UK (corresponding author, email: a.attya83@gmail.com)
event, synchronous generator naturally slows down to extract a some of its kinetic energy (KE) stored in the turbine and generator rotating parts, and convert it into electric energy i.e. inertia response. The drop in the synchronous speed should not exceed 2% of its nominal value e.g. the allowed drop is 1 Hz in a 50 Hz network. This reaction sustains for a few seconds, then the primary response retains power balance at a new lower synchronous speed [3].
The key challenge is that variable speed WTG (i.e. DFIG and PMSG with full rated converters) are partially or fully decoupled from the grid through power electronics interface, which reacts fast enough to accommodate frequency variations, hence WTGs are not able to provide natural frequency support [4]. The literature proposed several methods to enable WTGs to provide frequency response, namely virtual inertia and primary response, where the WTG controllers are modified to provide active power surge during frequency excursions [5, 6]. Efforts are focused on making WTGs mimic synchronous generators response [7, 8], where the reference speed, torque and power set-points are manipulated to secure a certain power reserve [9-11] that is highly dependent on wind speed (WS) just before and during frequency events, and the applied support concept [12].
This paper incorporates three key concepts, pitch de-loading, rotor over-speeding, and electrical torque over-loading to extract KE to enable wind power frequency support. These methods are applied by supplementary controllers, which can be integrated into the conventional controls of a variable speed WTG. The limitations, merits and cons of each method are explored through the application of two WS profiles, including intermittent WS, accompanied by a decaying ramp-shaped frequency test signal applied to benchmark WTG. The impact on frequency stability is examined in two test systems, an isolated AC area and a MT-HVDC grid. The dynamic time inertia of the AC area and the virtual inertia constant of the MT-HVDC grid are estimated to expand this analysis. The mechanical stress applied on the WTG is brought to focus, where the dynamics of shaft and tower torques are analyzed.
III. PROPOSED SUPPORT METHODS
The explained methods in this section rely on de-loading and KE emulation of WTG. However, the Accelerative de-loading method adopts a new approach to secure power reserve without the need to continuous pitching as explained latter.
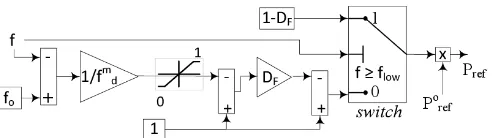
A. Pitch de-loading
This method can be classified as delta de-loading [13] where WTG output is de-loaded continuously by a constant factor (DF). The available output (Poref) refers to the WTG output
when it follows conventional Maximum Power Tracking (MPT). The active power set-point is reduced by DF = 0.15,
meanwhile rotor speed is regulated within nominal value (ωo)
based on the incident WS at normal frequency conditions i.e. normal operation. When frequency drop violates a safe margin, flow = 49.95 Hz, de-loading ratio is curtailed by a droop gain
until frequency drop reaches a preset threshold (fm
d), at which
the output is its peak as shown in Figure 1. The ratio Po
ref/Pref is
[image:2.612.314.560.46.115.2]controlled using (1), where fo is the nominal frequency.
Figure 1. Pitch de-loading supplementary controller.
𝑃𝑟𝑒𝑓
𝑃𝑟𝑒𝑓𝑜 = 1 −
{
𝐷𝐹, 𝑓 ≥ 𝑓𝑙𝑜𝑤
𝐷𝐹× (
𝑓𝑜− 𝑓
𝑓𝑑𝑚 − 1) , (𝑓𝑜− 𝑓𝑑𝑚) < 𝑓 < 𝑓𝑙𝑜𝑤
0, 𝑓 ≤ (𝑓𝑜− 𝑓𝑑𝑚)
(1)
This procedure smoothens system response and imitates the governor droop of conventional synchronous generators. The pitch de-loading is deactivated if the incident WS approaches the rated WS of the WTG to curtail wasted energy due to de-loading. It is of note that, pitching is activated by default at high WSs to maintain the WTG output and rotor speed within safe limits, however at frequency events, pitch angle could be exceptionally reduced to allow a slight overload of the WTG for a short predefined duration, which relies on the WTG specifications to avoid excessive heating or any sort of damage based on the manufacturer instructions [14].
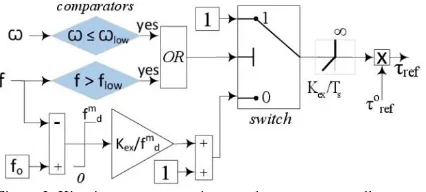
B. KE extraction
This concept decelerates the rotor of the WTG to extract a portion of its stored KE to provide power support [15]. This concept could be favorable to wind farms’ owners as it does not cause major energy wasting at normal operation i.e. de-loading is avoided. However, it provides support for relatively shorter duration relying on the WTG inertia, and it is vastly vulnerable to WS variations during and after the event. Severe WS drops paralyze this method if the extractable KE is insufficient to maintain the support power initially provided at the start of the frequency event, putting the WTG under the risk of stopping.
The new implementation method in this paper sets the reference torque (τref) above its nominal value (τoref) by a
dynamic extraction factor of an upper limit (Kex = 0.15) during
frequency drops. The severity of frequency drop governs the ratio ‘τref /τoref’, where 1 ≤ τref /τoref ≤ (1+ Kex). A linear droop
relation is used similar to the one applied in the Pitch de-loading method as shown in Figure 2 to make the comparison more reflective and fair. KE extraction stops when rotor speed (ω) reaches a preset min. threshold (ωlow). The torque reference
value at the beginning of the event is maintained, given that the ratio between the actual torque and its initial value does not exceed 1+Kex to avoid the possibility of over-extraction that
could stop the WTG. This also mitigates the variations in the amount of power support, contributing to improved stability and faster recovery to normal frequency. The post-event (recovery) stage is critical as the WTG speeds up to ωo at a new
WS, thus τref /τoref < 1 where the demanded torque is less than
the available, thus the extra input energy accelerates the WTG. Nevertheless, the rate of decay of τref is regulated and does not
exceed Kex/Ts, where Ts is a preset safe time interval to finish
Figure 2. Kinetic energy extraction supplementary controller. C. Accelerative de-loading
This method has the privilege of being applicable to all variable speed WTGs and it does not require special pitching controls, hence it is applicable to WTGs that are not equipped with pitching systems. However, it depends on the margin of ω variation according to the rating of the WTG power electronics converters. In case of DFIG-Type 3, the ωvariation margin is 30-50% from the nominal speed, while PMSG-Type 4 offers wider range [16]. This method aims to achieve τref /τoref < 1 by
a certain ratio of a preset lower limit (1-Kacc = 0.85), hence the
WTG accelerates as the electrical output is slightly less than the mechanical input. This ensures that the upper limit of the rotor speed (ωR) is not violated [17]. As an illustration, incident WS
is roughly measured to estimate ωo using a lookup table, then
τref /τoref is set between (1-Kacc) up to 1, where at ‘1-Kacc’ full
de-loading ratio is applied. τref /τoref is increased gradually
(de-loading ratio reduced) when frequency violates flow through a
droop gain similar to that used in the two previous methods as illustrated in Figure 3. The support is provided by the extracted KE i.e. the WTG decelerates while τref /τoref is increasing, and
by approaching MPT operation when τref /τoref = 1. Post event,
the WTG recovers to the higher rotor speed i.e. de-loaded output at normal operation, through a relatively low acceleration. In particular, τref /τoref is reduced gradually such
that the decaying rate does not exceed Kacc/Ts (Ts is a safety
time interval preset to 45s). This should ensure that the WTG output does not intensely drop during the recovery to the normal (higher) speed similar to what is applied in KE extraction.
An advantage of this method is its ability to maintain a stable power support even if the incident WS drops, where τref at the
first instant of the frequency event detection is maintained until ω drops to ωlow or the frequency event is cleared as illustrated
in Figure 4 . This makes τref > τoref causing the WTG to extract
KE to mitigate the drop in the WTG output. The maximum allowed over-demand is ‘1 + Kacc’ to avoid the risk of WTG
stopping. This makes the support method transforms to KE extraction concept. The support sustainability after the wind speed drops relies on the inertia of the WTG; the severity of WS drop; and the margin between ωo and ωlow.
The concepts of pitch de-loading and KE extraction are already proposed in the literature [5], but the implementation methods of both concepts in this paper are different. For example, the proposed KE extraction method in[18] relied on the system rate of change of frequency (RoCoF) as an input, which could be prone to system transients, and the stability of power support was compromised. It also tested several values of the extraction constant (Kic in [18]), meanwhile, this paper
[image:3.612.314.561.47.147.2]applies variable τref /τoref according to frequency drop severity.
[image:3.612.312.553.178.260.2]Figure 3. Accelerative de-loading supplementary controller.
[image:3.612.314.553.285.372.2]Figure 4. Illustration of the operation regions of Accelerative de-loading.
Figure 5. Integration of frequency support into NREL 5 MW typical model
In addition, the case of WS drop was not considered, and the amount of provided support was unpredictable as it was only limited by the conventional controls of the WTG e.g. rate of change of power. The supplementary controller added a certain value to Po
ref, meanwhile this paper applies proportional
approach, where τref/τoref is manipulates to provide the required
support. A droop gain is applied to manipulate the de-loading ratio based on frequency deviation to secure a smooth provision of the active power support aligned with frequency events. The implementation of KE extraction achieves the same objective by regulating the extraction through τref/τoref. Moreover, the
three controllers’ design and parameters’ setting are correspondent to enable reflective and fair comparison between their impacts. For example, the three key constants DF, Kex and
Kacc are equal and set to 15%. In addition, the majority of the
research dealing with this topic does not consider variable WS. In the examined test systems, the controls of the NREL 5 MW [19, 20] are adapted to integrate each of the proposed supplementary controllers separately as illustrated in Figure 5. The WTG rated speed is 11.5 m/s, moments of inertia of the slow and fast rotating parts are 534 and 35 Mkg.m2 resp., the
gearbox ratio is 95. The maximum rate of change or power or torque reference is 0.45 per unit/s, and the pitching rate is 8°/s.
WTG at each profile. The frequency drops from fo to f d (50 to
49.5 Hz) at t = 15s within 1s inspired by the threshold of RoCoF relays (0.5 Hz/s) in some grid codes [21]. The frequency test signal returns to fo at t = 30s to explore the dynamics of each
method when it recovers to normal operation.
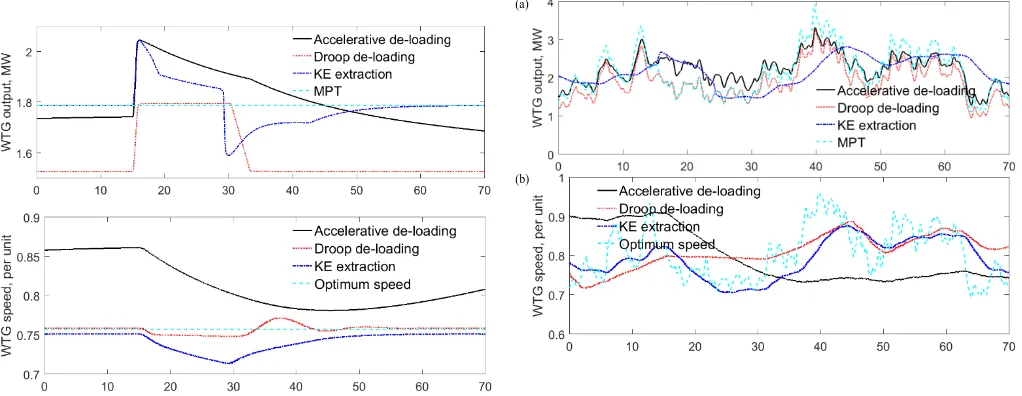
A. Two consecutive steps
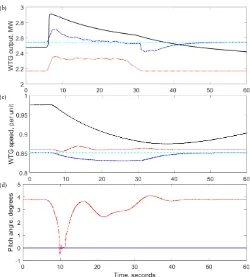
The incident WS drops from 8 to 6 m/s after 20s, then it rises to 7 m/s to demonstrate the operation of each support method at sudden and steep WS variations. The optimum WTG output and speed at the incident WS are obtained from two look-up tables that represent the MPT performance. Results show that the WTG output is more sustainable in case of KE extraction at the early stage after the WS drops. Pitch de-loading did not play a positive role when the WS drops as the WTG is already following MPT i.e. no de-loading as the frequency deviation has already reached fm
d, hence the output dropped steeply as
shown in Figure 6(a). Accelerative de-loading showed a merit as the output does not fall dramatically as in case of Pitch de-loading or in a higher slope as the case of KE extraction. The fastest recovery to normal operation is achieved by Pitch de-loading when the frequency restores its nominal value, hence the WTG is de-loaded below MPT. Conversely, the WTG takes longer time to accelerate to the higher rotor speed in Accelerative de-loading as shown in Figure 6(b) due to the applied restriction on the ramping rate of τref /τoref. Therefore,
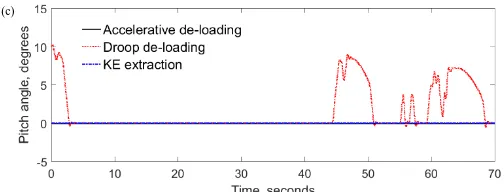
the WTG speed at Accelerative de-loading could be similar or slightly slower compared to the other two methods after the event is cleared as shown in the tail of the simulation in Figure 6(b). The displayed simulation time interval does not show the WTG speed when it recovers to nominal accelerated speed, but it shows that the WTG speed is increasing. Expanding the displayed time interval will compromise the quality of the figures and hide some important details. It is of note that, the response of pitch angle is fast enough to provide artificial inertia response as shown in Figure 6(c). The required pitch angle to apply the preset DF is about 4°.
B. Variable wind speed
An array of variable WS (1 sample/s and 8 m/s average value) is applied with the same frequency test signal.
(a)
[image:4.612.55.566.541.739.2](b)
Figure 6. Dynamics of WTG providing three support methods and facing a step change in wind speed; a) output, b) rotor speed, and c) pitch angle.
Although, KE extraction does not deviate from MPT at normal operation i.e. no frequency event, the WTG failed to achieve perfect tracking to the optimum output and speed as shown in Figure 7(a) and Figure 7(b) resp. This returns to the inertia of the rotating parts of the WTG, and the generator time constant, while the MPT output is obtained from a lookup table representing the power curve of the WTG. At the frequency event, KE extraction elevates the WTG output above its optimum value for a very short time, then it drops to compensate the extracted KE and stabilize the WTG at a new rotor speed. Conversely, when the de-loading is waived during the event, the output is well-matching the MPT output. Likewise, Accelerative de-loading is very close to MPT output, and at some intervals it is slightly higher due to the faster rotor speed at higher WSs. However, in case of WS gusts, at t = 40s for example, the inertia of the WTG mitigates its ability to reach the MPT output. The WS falls below its magnitude at the instant of frequency event initiation, hence the Accelerative de-loading method automatically switches to KE extraction concept as explained in Section III.C to maintain the provided power support until the WTG speed reaches ωlow. Therefore, the WTG
speed is slightly slower with Accelerative de-loading compared to the other two methods within the time interval shortly after the frequency event is cleared as shown in Figure 7(b). The pitch controllers enabled fast and fine variations in pitch angle in Pitch de-loading method as shown in Figure 7(c), however, the exact value of DF is not fulfilled due to the continuous
interactions between the incident WS, WTG inertia and the set-points of the reference signals. This brings uncertainty to the available active power reserve.
(a)
(c)
Figure 7. Dynamics of WTG providing three support methods and facing variable wind speed; a) output, b) rotor speed, and c) pitch angle.
V. POWER SYSTEMS FREQUENCY STABILITY
The impact of the proposed support methods on a frequency event in a single AC area and a MT-HVDC grid is examined.
A. Single AC area 1) Test system
The test system is composed of an aggregate AC area (fo =
50 Hz) of installed conventional generation capacity feeding a dynamic load. The AC area represents a medium scale power system of average vulnerability to frequency events. The frequency response of the AC area is obtained using (2 and 3),
𝑑𝑓 𝑑𝑡 =
𝑃𝑐+ 𝑃𝑤− 𝑃𝐿 − (𝑓 − 𝑓𝑜) × (𝐷𝑙+ 4 · 𝐷𝑔· 𝑓 · 𝜋2)
4 · 𝐽 · 𝑓 · 𝜋2 (2)
𝑑𝑃𝑐 𝑑𝑡 =
𝑃𝑐𝑜× [𝐿𝑜𝑎𝑑𝑖𝑛𝑔 − ((𝑓 − 𝑓𝑜) (𝑅 · 𝑓⁄ 𝑜))] − 𝑃𝑐 𝑇𝑔𝑒𝑛
(3)
where PC and PoC are actual generation and installed capacity of
conventional power resp., PW and PL are the instantaneous wind
generation and load demand resp. The moment of inertia, generation time constant and droop of the aggregate generator are J, Tgen and R resp. Dl and Dg are the parameters of the
dynamic load model. The load PL is fluctuating continuously by
super-positioning a white noise of amplitude ±2% to make it closer to reality. The system parameters are in Table I, Area 2, while the other two areas are implemented in the test system of the next subsection that is dedicated to the MT-HVDC grid. The wind generation actual capacity penetrates the overall generation capacity by 40% i.e. 288 WTGs each of 5 MW, where 50% capacity factor is assumed. The integrated wind farm is modelled as an aggregate WTG of an equivalent rating.
2) Scenarios
The examined AC area suffers a sudden loss of 12% of its generation capacity after 5s initiating a frequency drop. The lost generation recovers gradually with a rate of 0.02 per unit/s starting at t = 35s. To focus on the impact of the applied support method, a constant WS of 9 m/s is incident on the wind farm. The assumption of constant WS is acceptable as frequency typically recovers to safe margin within 10-30s according to some grid codes [22]. During this relatively short time interval, and due to WTG inertia, a wide range of studies assumes that WS is constant [23]. The wind farm provides frequency support using one of the proposed methods in separate case studies.
3) Results
The frequency response is improved under the three support methods mainly during the early stage of the event as shown in
TABLE I.MAIN PARAMETERS OF THE AGGREGATE AC AREAS. Parameter Area 1 Area 2 Area 3 Area capacity (PCo) [GW] 1.8 2.1 3.5 Imported (-)/exported (+) power to
MT-HVDC grid [GW] -0.60 0.45 -1.28 Loading of conventional generation 95% 95% 95% Lumped inertia (J), [Mkg.m2] 0.146 0.17 0.28 Primary response droop (R) 6% 5% 4% Generation time constant (Tgen) [s] 2 2.5 2.5 Load dynamics coefficient (Dg) 95 140 146 Load frequency coefficient (Dl) 1% 1% 1% Figure 8(a), where the frequency nadir and RoCoF are curtailed. After 2-3s from the power imbalance, Accelerative de-loading causes key improvement, while the most sustainable power surge is provided by Pitch de-loading as shown in Figure 8(b) (acknowledging that WS is constant). But, the output is not aligned with MPT because the frequency excursion is better than fm
d, and Pref/Poref is following (1), hence the output is still
slightly de-loaded. Conversely, the WTG at Pitch de-loading matches MPT in Figure 6(a) as fm
d is reached.
The decay of power support in case of KE extraction makes the frequency response converges to the case where no support is provided as observed in Figure 8(a). The rotor speed recovered to its nominal value, starting from ωlow within 18s
after the end of the event as shown in Figure 8(c), relying on the preset value of Ts. The pitch angle started to recover earlier (i.e.
before the frequency reaches the safe margin) in relation to the applied de-loading factors that follows (1) as shown in Figure 8(d), where there is no safety time delay before pitch angel recovers to de-loaded operation post-event.
B. MT-HVDC grid
The proposed MT-HVDC grid and the holistic active power controller in [24] are adapted in this paper to examine the coordination between the proposed support methods and the MT-HVDC holistic frequency support controller that dispatches the mutual frequency support from the interconnected AC areas and the offshore wind farms (OWFs). Results are used in Section V to estimate the virtual inertia of a MT-HVDC grid based on a novel simplified definition.
1) Test system
Three aggregate AC areas, and two OWFs are composing the MT-HVDC grid as shown in Figure 9. Area 2 is the same aggregate synchronous area applied in the previous case study, and the parameters of Areas 1 and 3 are in Table I, where Area 3 is the master area as in [24]. The capacity of the power electronics converter station in each area connecting it to the MT-HVDC grid is designed to secure 30% extra capacity of the steady state import/export power mentioned in Table I.
[image:5.612.48.300.46.142.2] [image:5.612.335.544.57.155.2] [image:5.612.314.564.637.729.2](c)
(d)
Figure 8. a) Frequency response of the AC area, and dynamics of WTG providing three support methods; b) output, c) rotor speed, and d) pitch angle.
The capacities of the OWFs are selected to achieve 40% penetration similar to the case of single AC area. The penetration in MT-HVDC is calculated based on the aggregate capacity of the three AC areas, hence the OWFs are composed of 597 WTGs at 50% capacity factor.
The available control methods are modified to produce a preliminary picture of the proposed coordination and its impact on frequency stability. The consensus controller [24] is integrated to regulate the power exchange, and provide mutual frequency support to the three AC areas. This controller provides an increment change to the set-points of the power exchange in the AC areas and the OWFs output during frequency events, and when the WTGs are not able to match the new set-points no support is provided. In this paper, this approach is enhanced, where the proposed support controllers are adapted to receive the increment signal (ΔPOWF) from the
MT-HVDC holistic controller as a replacement to frequency signal used in the previous case studies. ΔPOWF is compared to
the OWF output at the beginning of the frequency event, and when it exceeds a certain lower limit (ΔPl
OWF) the support
operation starts. Active power support ramps up to its peak when ΔPOWF reaches a certain upper limit (ΔPhOWF). ΔPlOWF and
ΔPh
OWF replace flow and fmd in the proposed methods, and they
are set to 0.5% and 5% of the normal OWF generation at the start of the event resp. In such approach, the droop relation is following the increment signal from the holistic controller not the frequency deviations. ΔPl
OWF and ΔPhOWF can be tuned to
match the required primary reserve from the OWF (e.g. ΔPl OWF
can be evaluated when flow is violated in one of the AC areas).
[image:6.612.49.299.43.320.2]A frequency deviation deadband of ±0.05 Hz is applied to the MT-HVDC holistic controller to avoid undesirable transients at minor drops, and 10ms telecom delay is applied [25].
Figure 9. The implemented MT-HVDC grid. 2) Scenarios
The same frequency event occurred in Area 2 in the previous case study is applied to test the responses of the AC areas under the mutual frequency support from the OWFs and the AC areas and the WS is kept constant at 9 m/s.
3) Results
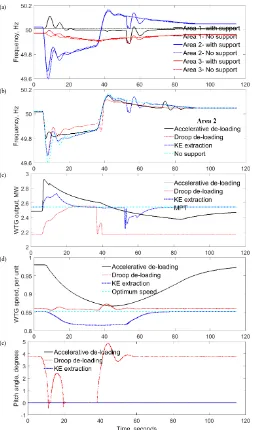
The frequency responses of Areas 2 and 3 reflect the major amounts of active power exported by the OWFs to tackle the frequency event in Area 2 relying on the regulation signals sent by the holistic controller as shown in Figure 10(a). However, Area 1 is affected by a slight frequency spike because the power balance across the MT-HVDC grid is temporarily violated due to the fast response of the holistic controller and the OWFs to provide frequency support and tackle the event in Area 2. The same area suffered a minor drop in frequency when the OWFs support started to retreat, which creates another power imbalance in the MT-HVDC grid for a very short duration. The three areas do not converge to the same frequency compared to [24], because the converter stations of the AC areas in this modified test system do not have the same power capacity. In addition, the maximum expected power support from the OWFs was assumed to be 10% of its rated capacity in [24], and in this paper it is reduced to 5% to acknowledge the 50% capacity factor of the OWFs. The improvements in Area 2 frequency response shown in Figure 10(b) are not as strong as the case of being isolated as shown in Figure 8(a). This returns to the key contribution of the MT-HVDC holistic support controller, which enhances the frequency response in all areas even if the OWFs are not able to provide frequency support.
The WTG output and speed dynamics coincide with the obtained results in the previous case studies, but more transients are observed due to the fast changing set-points (ΔPOWF) from
the holistic controller. The extractable KE is depleted at around t = 56s, hence the system suffers minor power imbalance as the OWFs start a synchronized recovery stage leading to minor frequency drops in the three AC areas. This is reflected on the WTG output and rotor speed in Figure 10(c) and d, where the output gradually drops (τref < τoref) to enable the rotor speed
[image:6.612.311.537.49.197.2]8(c) and Figure 10(d) as well as in pitching in Figure 10(e). Nevertheless, when frequency reaches the holistic controller deadband, there are one or two rapid switching events to support mode as shown in Figure 10(c) due to the fast responsive nature of the consensus controller, and the MT-HVDC grid. The obtained results show the need of potential coordination between different controllers that have the same key objective, as if they act concurrently, it could jeopardize their responses.
VI. COMPREHENSIVE COMPARISON
The obtained results are integrated to highlight the major findings. Moreover, the aggregate dynamic inertia of the single AC area in Section III, and the virtual inertia of the MT-HVDC grid are estimated.
A. Power systems frequency stability
Dynamic inertia (Hd) of an AC area could be estimated using
(4) under certain conditions of RoCoF and frequency deviation, Hd is obtained during the first 4s of the event.
𝐻𝑑=
𝑓𝑜
2 · 𝑅𝑜𝐶𝑜𝐹×
𝑃𝑐+ 𝑃𝑤− 𝑃𝑙
𝑃𝑐𝑜+ 𝑃𝑤
(4)
at RoCoF ≤ - 20 mHz and f < 𝑓0.
Additionally, a simplified method is proposed to evaluate the virtual inertia of a MT-HVDC grid (HMT-HVDC) aiming to reach
an acceptable analogy with a conventional synchronous AC area. This inertia reflects the cumulative changes in power imbalance between generation and demand across the dc grid within a certain time interval during the frequency event with respect to the available generation capacity under certain constrains. HMT-HVDC is estimated using (5),
𝐻𝑀𝑇−𝐻𝑉𝐷𝐶=
∑ ∫ |𝑃𝑑𝑐𝑛 (𝑡) − 𝑃 𝑑𝑐𝑛 (𝑡𝑜)| 𝑡𝑒𝑛𝑑
𝑡𝑜 𝑁 𝑛=1
∑𝑁𝑛=1𝑃𝐴𝐶−𝐷𝐶𝑛
(5)
where Pdc is the imported/exported power (i.e. reflects to its
polarity) by an AC area or OWF, to is the instant at which the
frequency in one of the AC areas violates the holistic controller frequency deviation deadband, tend is the instant at which the
critical stage of the frequency event ends, approximately 4s in this paper, PAC-DC is the capacity of the converter station
connecting each AC area or OWF to the dc grid, and N is the number of the interconnected areas and OWFs where N= 5. An advantage of the proposed method to evaluate HMT-HVDC is
taking into account the capacity of the converter stations, which could be analog to the installed synchronous generation capacity in an AC system. HMT-HVDC is evaluated for the
investigated cases in Section IV.
The results in Figure 11 are the averages of sets of Hd values
each 0.5s to improve the figure clarity. The improvements in the aggregate inertia of the single AC area are marginal in spite of the moderate penetration of wind power in load feed during the event. The overall improvements are achieved by Pitch de-loading due to the higher and sustainable power surge compared to the other two methods. During the first 0.5s of the event, Hd
value is not recorded for KE extraction method achieving a key improvement as the RoCoF is better than the constraint in (4). The Accelerative de-loading leads to marginal reduction in Hd.
In case of the MT-HVDC grid, KE extraction leads to a relatively higher HMT-HVDC of 12.4s as shown in Figure 12. This
method provides a fast response almost similar to Accelerative de-loading and slightly less magnitude, but more sustained as noticed in Figure 10(c). Similarly, Pitch de-loading secured higher power surge compared to the other two methods, which compensates the relatively slower response with a tight margin for the favor of Pitch de-loading on Accelerative de-loading.
(a)
(b)
(c)
(d)
[image:7.612.313.566.147.577.2](e)
Figure 10. Frequency response of a) AC areas under KE extraction support, and b) Area 2 only under different support methods; dynamics of WTG under three support methods; c) output, d) rotor speed, and e) pitch angle.
[image:7.612.313.561.613.721.2]Figure 12. Aggregate virtual inertia of the MT-HVDC grid.
Accelerative de-loading is slightly slower when it recovers to normal operation (i.e. WTG acceleration to recover the higher rotor speed), hence it releases more supportive energy in the early stage of the event then it does not match the set-point provided by the holistic controller as fast as the other methods. Generally, the high virtual inertia is caused by the responsive dc interconnectors and its holistic controller that react rapidly to alleviate any power imbalance in the AC areas, using support from OWFs and regulating the power exchange of the AC areas.
B. WTG mechanical response
The responses of the WTG shaft and tower deflection torques are brought to focus as a provisional investigation of the impact of support methods on the WTG structure. This is one of the reasons to apply the detailed model of the NREL WTG, which is widely applied. The tower deflection is modeled as a spring-damper system with spring constant and damping. The shaft torque is obtained from a third order drive train model of two rotating masses connected through a gearbox with a torsion spring constant. The risks of highly fluctuating shaft torque include the probability of coinciding with the resonance frequency of one of the WTG components, and it affects the rotor angle stability of the generator if it is not completely decoupled similar to the case of a full-rated WTGs. It also reduces the lifetime of the gearbox and bearings, and increases friction and heating losses reducing the overall efficiency and reliability of the WTG. These risks are more vigilant in case of Accelerative and Pitch de-loading due to the continuous variations of shaft torque as shown in Figure 13(a) under intermittent WS. In the case of constant WS while the WTG is responding to system frequency, Accelerative de-loading caused steep increase with a highly fluctuating reaction at the early 3-4s as shown in Figure 14(a). In Pitch de-loading, pitching mitigates the stress applied on the shaft. These oscillations are much curtailed in KE extraction as this method represents conventional MPT at normal frequency, even during the extraction process the shaft torque transients are smoother.
The risks of tower torque are highly related to the robustness of the WTG structure and stability of its nacelle. The responses in Figure 13(b) and Figure 14(b) reflect the key drawback of Pitch de-loading, mainly during normal operation, when the available power is de-loaded by continuous pitching, which applies higher stress on the tower as the wind thrust is applied to the torque instead of being converted into KE to produce more electrical energy. This is clear in Figure 14(b), at constant WS, when the tower torque increases by 50% during pitching down at the early stage of the frequency event. Nevertheless, the minor frequency fluctuations of the test system do not have major implications on both torques.
[image:8.612.313.564.53.267.2](b)
Figure 13. Shaft and tower torques resp. variable WS (case of Section III.A).
(a)
[image:8.612.311.565.84.417.2](b)
Figure 14. Shaft and tower torques resp. during the provision of support to the single AC area (case of Section IV.A).
C. Economic implications
The obtained results have potential economic impact that worth being highlighted. Kinetic energy extraction can provide support without curtailing energy production at normal operation compared to the key amount of wasted energy in case of continuous de-loading. The amount of wasted energy relies on the incident WS profile at the WTG location; the applied de-loading method; and ratio. But, the side effect of short and uncertain support provision by KE extraction when compared to Pitch and Accelerative de-loading should be considered. The latest two methods are more supportive but there is a need of changing the market rules in order to facilitate wind power participation in frequency support markets. For example, the power generation incentives are based on the available power reserve within a certain time window, and the actual provided support during the event. These two parameters are easy to define for a conventional power plant, but for intermittent wind power it is a challenging process especially that the supportive power surge cannot be maintained constant for 30s [26].
MPT. However, the proposed technique ensures that the rated rotor speed is not exceeded, hence this method is restricted to incident WSs that are lower than the rated WS of the WTG. In addition, the deviation between the accelerated rotor speed and the nominal speed is small as shown in the obtained results, which mitigates the risks of wear and tear. The other mechanical effects could also play a key role to improve or worsen the expected life-time and correlated maintenance cost and the availability of the WTGs, which curtails energy production and investment profile of wind farms. Transmission systems operators need to know the minimum output of each power plant and its sustainable output before the event, which also require re-designing the market to adapt wind power as a key participant. The authors had expanded their research work on this aspect to develop and estimate novel market indices to compensate wind power assets as they participate in primary reserve market [27]. This cited work also considered the three support methods proposed in this paper.
VII. CONCLUSIONS
The presented wide and detailed analysis touched upon the provision of frequency support by wind power from different aspects, which include frequency stability, comprehensive comparison between the key concepts and the potential risks on the structure of the wind turbine. The parameters of the proposed support controllers are tunable relying on the requirements of the transmission systems operators, and to comply with grid code obligations. The concept of Accelerative de-loading shows slightly faster response with a higher initial power surge, meanwhile Pitch de-loading provides more sustainable support and smoother recovery. The over-speeding of wind turbine in accelerative de-loading could have implications on the mechanical stability of the WTG, however it wastes less energy compared to pitch de-loading. The key merit of kinetic energy extraction is that it does not deviate from MPT at normal operation, however, most likely the system suffers a second minor frequency dip when the wind turbines recover to the nominal rotor speed. A compromise is required between the amount of wasted energy, the mechanical resilience, and the secured virtual inertia and primary reserve to decide the applied support concept as well as its incorporated parameters; de-loading ratio and the corresponding maximum frequency drop to release the complete available reserve.
VIII. REFERENCES
[1] P. J. C. Vogler-Finck and W.-G. Früh, "Evolution of primary frequency control requirements in Great Britain with increasing wind generation," International Journal of Electrical Power & Energy Systems, vol. 73, no. 0, pp. 377-388, 12// 2015.
[2] European Network of Transmission System Operators for Electricity (ENTSO-e), "Research, innovation and development roadmap 2017-2026," European Network of Transmission System Operators for Electricity (ENTSO-e),2017.
[3] P. Kundur, Power system stability and control. New York: McGraw-Hill Inc., 1994.
[4] M. F. M. Arani and E. F. El-Saadany, "Implementing Virtual Inertia in DFIG-Based Wind Power Generation," IEEE Trans. on Power Systems, vol. 28, no. 2, pp. 1373-1384, 2013.
[5] F. Díaz-González, M. Hau, A. Sumper, and O. Gomis-Bellmunt, "Participation of wind power plants in system frequency control: Review
of grid code requirements and control methods," Renewable and Sustainable Energy Reviews, vol. 34, pp. 551-564, 6// 2014.
[6] A. B. Attya, J. L. Dominguez-Garcia, and O. Anaya-Lara, "A review on frequency support provision by wind power plants: Current and future challenges," Renewable and Sustainable Energy Reviews [Online: https://doi.org/10.1016/j.rser.2017.06.016]
[7] L.-R. Chang-Chien and Y.-C. Yin, "Strategies for Operating Wind Power in a Similar Manner of Conventional Power Plant," IEEE Transactions on Energy Conversion, vol. 24, no. 4, pp. 926-934, Dec 2009.
[8] M. Bhuiyan and S. Dinakar, "Comparing and Evaluating Frequency Response characteristics of Conventional Power Plant with Wind Power Plant," MSc, Chalmers University of Technology, Goteborg, 2008. [9] L.-R. Chang-Chien, W.-T. Lin, and Y.-C. Yin, "Enhancing frequency
response control by DFIGs in the high wind penetrated power systems," IEEE Trans. on Power Systems, vol. 26, no. 2, pp. 710-718, May 2011. [10] W. Lei and D. G. Infield, "Towards an Assessment of Power System
Frequency Support From Wind Plant-Modeling Aggregate Inertial Response," IEEE Transactions on Power Systems, vol. 28, no. 3, pp. 2283-2291, 2013.
[11] O. Anaya-Lara, F. M. Hughes, N. Jenkins, and G. Strbac, "Contribution of DFIG-based wind farms to power system short-term frequency regulation," IET -Generation Transmission and Distribution, vol. 153, no. 2, pp. 164-170, 2006.
[12] A. B. Attya and T. Hartkopf, "Wind farms dispatching to manage the activation of frequency support algorithms embedded in connected wind turbines," International Journal of Electrical Power & Energy Systems, vol. 53, pp. 923-936, Dec 2013.
[13] I. D. Margaris, S. A. Papathanassiou, N. D. Hatziargyriou, A. D. Hansen, and P. Sorensen, "Frequency Control in Autonomous Power Systems With High Wind Power Penetration," IEEE Transactions on Sustainable Energy, vol. 3, no. 2, pp. CP2-199, Apr 2012.
[14] A. B. Attya and T. Hartkopf, "Wind turbine contribution in frequency drop mitigation - modified operation and estimating released supportive energy," IET Generation Transmission & Distribution, vol. 8, no. 5, pp. 862-872, May 2014.
[15] P.-K. Keung, P. Li, H. Banakar, and B. T. Ooi, "Kinetic Energy of Wind-Turbine Generators for System Frequency Support," IEEE Transactions on Power Systems, vol. 24, no. 1, pp. 279-287, Feb 2009.
[16] M. Cheng and Y. Zhu, "The state of the art of wind energy conversion systems and technologies: A review," Energy Conversion and Management, vol. 88, pp. 332-347, 12// 2014.
[17] A. B. T. Attya and T. Hartkopf, "Control and quantification of kinetic energy released by wind farms during power system frequency drops," IET Renewable Power Generation, vol. 7, no. 3, pp. 210-224, May 2013. [18] Y. Wang, G. Delille, H. Bayem, X. Guillaud, and B. Francois, "High Wind Power Penetration in Isolated Power Systems-Assessment of Wind Inertial and Primary Frequency Responses," IEEE Transactions on Power Systems, vol. 28, no. 3, pp. 2412-2420, Aug 2013.
[19] M. Singh, E. Muljadi, J. Jonkman, V. Gevorgian, I. Girsang, and J. Dhupia, "Simulation for Wind Turbine Generators—With FAST and MATLAB-Simulink Modules," National Renewable Energy Laboratory (NREL), United States, 2014.
[20] Aeolus FP7. Simplified NREL5MW turbine for Simulink [Online]. Available: http://www.ict-aeolus.eu/SimWindFarm/index.html
[21] The Commission for Energy Regulation, "Rate of Change of Frequency (RoCoF) Modification to the Grid Code," Republic of Ireland2014. [22] European Network of Transmission System Operators for Electricity,
"Supporting document for the network code on load-frequency control and reserve," 2013.
[23] H. Liu and Z. Chen, "Contribution of VSC-HVDC to frequency regulation of power systems with offshore wind generation," IEEE Trans. on Energy Conversion, vol. 30, no. 3, pp. 918-926, 2015.
[24] F. D. Bianchi and J. L. Dominguez-Garcia, "Coordinated Frequency Control Using MT-HVDC Grids With Wind Power Plants," IEEE Trans. on Sustainable Energy, vol. 7, no. 1, pp. 213-220, 2016.
[25] K. Narendra and T. Weekes, "Phasor Measurement Unit (PMU) communication experience in a utility environment," presented at the Conference on Power Systems, 2008.
[26] EirGrid. (2015). DS3:System Services Review. Available:
http://www.eirgridgroup.com/site-files/library/EirGrid/System-Services-TSO-Recommendations-May2013.pdf
degress from Ain Shams University, Egypt in 2005 and 2008 respectively. He was awarded the DAAD full PhD scholarship in 2010, and the title of Dr.-Ing. from TU Darmstadt, Germany in 2014. He is currently a post-doctor at the Wind Energy and Control Centre, University of Strathclyde, UK. He is an investigator of several European and National resreach proposlas which focus on the realization of high penetartion levels of non-conventional generation to current and future power and energy systems. He was a Visitng Researcher for Catalonia Institute for Energy Research (IREC), Spain, and the Offshore Renewable Energy Catapult (ORE-C), UK in 2016 and 2017 respectively. His research interests include but not limited to power and energy systems modelling and dynamics, renewable energy, electricity markets and energy storage.