primary research
commentary
review
reports
meeting abstracts
Primary research
Performance of the score systems Acute Physiology and Chronic
Health Evaluation II and III at an interdisciplinary intensive care
unit, after customization
Rainer Markgraf*, Gerd Deutschinoff
†, Ludger Pientka
‡, Theo Scholten
†and Cristoph Lorenz
§*Department of Internal Medicine II and Clinical Geriatrics, Ev Krankenhaus Bethanien, Iserlohn, Germany †Department of Internal Medicine, Allgemeines Krankenhaus, Hagen, Germany
‡Department of Geriatrics, Augusta-Kranken-Anstalt, Bochum, Germany
§Institut für Sozialmedizin, Epidemiologie und Gesundheitssystemforschung, Witten, University Witten-Herdecke, Germany
Correspondence:Priv.-Doz. Dr med Rainer Markgraf, Department of Internal Medicine II and Clinical Geriatrics, Ev Krankenhaus Bethanien,
Hugo-Fuchs-Allee 3, D-58644, Iserlohn, Germany. Tel: +49 2371 2120; fax: +49-2371 212298; e-mail: rainer.markgraf@t-online.de
Abstract
Background: Mortality predictions calculated using scoring scales are often not accurate in populations other than those in which the scales were developed because of differences in case-mix. The present study investigates the effect of first-level customization, using a logistic regression technique, on discrimination and calibration of the Acute Physiology and Chronic Health Evaluation (APACHE) II and III scales.
Method: Probabilities of hospital death for patients were estimated by applying APACHE II and III and comparing these with observed outcomes. Using the split sample technique, a customized model to predict outcome was developed by logistic regression. The overall goodness-of-fit of the original and the customized models was assessed.
Results:Of 3383 consecutive intensive care unit (ICU) admissions over 3 years, 2795 patients could be analyzed, and were split randomly into development and validation samples. The discriminative powers of APACHE II and III were unchanged by customization (areas under the receiver operating characteristic [ROC] curve 0.82 and 0.85, respectively). Hosmer–Lemeshow goodness-of-fit tests showed good calibration for APACHE II, but insufficient calibration for APACHE III. Customization improved calibration for both models, with a good fit for APACHE III as well. However, fit was different for various subgroups.
Conclusions:The overall goodness-of-fit of APACHE III mortality prediction was improved significantly by customization, but uniformity of fit in different subgroups was not achieved. Therefore, application of the customized model provides no advantage, because differences in case-mix still limit comparisons of quality of care.
Keywords: Acute Physiology and Chronic Health Evaluation, customization, logistic regression, mortality prediction, severity of illness
Received: 5 June 1998
Revisions requested: 6 December 1999 Revisions received: 6 August 2000 Accepted: 18 November 2000 Published: 5 January 2001
Critical Care2001, 5:31–36
This article may contain supplementary data which can only be found online at http://ccforum.com/content/5/1/031
© 2001 Markgraf et al, licensee BioMed Central Ltd (Print ISSN 1364-8535; Online ISSN 1466-609X)
Introduction
Scoring systems are used in intensive care to control for various case-mix factors in order to compare patient popu-lations. Score-based predictions of mortality in ICU patients may be used for quality assurance and compari-son of quality of care [1–3]. If a scoring system is intended to be used in a patient population that is different from the original population used in the development of the system (development sample), then it should be validated in this new population [4–7].
Calibration measures how closely mortality prognosis fits the observed mortality. Poor calibration in a patient sample does not necessarily mean that the quality of care in that particular ICU is better or worse than in the development sample.
Several clinical case-mix as well as nonclinical factors are not accounted for by such scoring systems [8]. The overall fit of a score in a particular patient sample can be improved by customization using logistic regression. This is possible for the whole population in question [9], but can also be done independently for specific subgroups [10,11]. In the latter case, the customized score can only be used in this subset of patients. If a customized model derived from the whole population is used, then uniformity of fit for the relevant subgroups should still be tested. Knowledge of the influence of subgroups is important, because future changes in case-mix may compromise the improvement achieved by customization.
The aim of the present study was to test the performance of APACHE II and III, after customization of these scales for use in future assessment of quality of care in our unit.
Patients and methods
Patients
Over a 3-year period (October 1991–October 1994), 3382 patients were consecutively admitted to the 12-bed interdiciplinary ICU of a 571-bed, university-affiliated com-munity hospital. For the APACHE II analysis, 274 patients who were readmitted to the ICU, 208 patients who were in the ICU for less than 4 h, 16 patients who were admit-ted for dialysis only, two patients who were younger than 16 years and 87 patients with missing data were excluded. Thus, 2795 patients were included in the analy-sis. For APACHE III, 79 patients who were admitted to rule out myocardial infarction and 55 cardiosurgical patients were excluded, leaving 2661 for analysis.
Data collection
Data collection was done according to the criteria and definitions described by the developers of APACHE II and III [12,13]. The data were collected by ward doctors after 4 weeks training in how to use the APACHE system. They had access to a detailed manual, including definitions and procedures. Constant supervision by a documentation
assistant included regular comparison of the original with the collected data, and review of completeness. In order to assess reliability of data collection, data from a random sample of 50 patients were recorded by two data collec-tors independently. Interobserver reliability was analyzed by Kendall’s coefficient of concordance and κstatistics. In addition, data collection software, which was provided by APACHE Medical Systems Inc (Washington, DC), auto-matically checked that the data were plausible. The whole data set was tested using a box-plot technique in order to analyze extreme values seperately. Vital status at hospital discharge was recorded.
Statistical analysis
The sample was split randomly into a development (n= 1863 for APACHE II and n = 1772 for APACHE III) and a validation sample (n = 932 for APACHE II and
n= 889 for APACHE III). Development of the original model by logistic regression [14] led to the following equation:
logit(or) = β0+ Σβi× xi (1)
where β0is a constant, βiare coefficients, and xi encom-passes the various patient factors that are included in the model. The probability of hospital death is calculated as follows:
P(or) = elogit(or)/1 + elogit(or) (2)
In the present study the APACHE II equation was used as indicated by the developers [12]. The APACHE III equa-tion was provided by APACHE Medical Systems Inc, and it has not been published for commercial reasons. In cus-tomizing the scales, the original logit was used as the independent variable and hospital death was used as the dependent variable. The new probability of hospital death was calculated as follows:
P(cust) = elogit(cust)/1 + elogit(cust) (3)
and logit(cust) is calculated as follows:
logit(cust) = βc
0+ [βc1× logit(or)] (4)
where βc
0is the constant and βc1the coefficient derived by logistic regression. The customized coefficients were calculated to be those shown in Table 1.
primary research
commentary
review
reports
meeting abstracts
was done by χ2test and Mann–Whitney U test, because values were not normally distributed.
Statistical analysis was performed using the SPSS 6.1 software package (SPSS, Chicago, IL, USA). P < 0.05 was considered statistically significant.
Results
Completeness of data was good; excluding just one vari-able (24-h urine), 94.6% of all necessary data were col-lected on average for each patient; 24-h urine was available in only 78.1% of patients. Reliability analysis revealed Kendall’s coefficients for clinical and laboratory data above 0.9 except for blood gas values (0.878) and 24-h urine (0.870). κvalues were low only for diagnosis of renal failure (0.49) and Glasgow Coma Scale score (0.54). Despite that, differences in calculated scores were very low, with Kendall’s coefficients above 0.92. Thus, overall reliability of data collection was good.
Demographic and clinical characteristics were very similar for the development and validation samples (Table 2), and no significant differences were detected. Both models showed good discrimination, which was unchanged by customization.
The original APACHE II prediction calibrated adequately in the patients studied, with minor improvements after cus-tomization. APACHE III originally showed inadequate cali-bration, which was considerably improved by customization, and was adequate afterwards (Table 3). The calibration curves (Fig. 1) reveal that calibration after customization was good for APACHE II up to the 70–80% mortality risk decile, but was still far from ideal for APACHE III. When interpreting the greater deviations from the ideal line in the 80–90% and 90–100% deciles, the small numbers of cases in these groups have to be borne in mind.
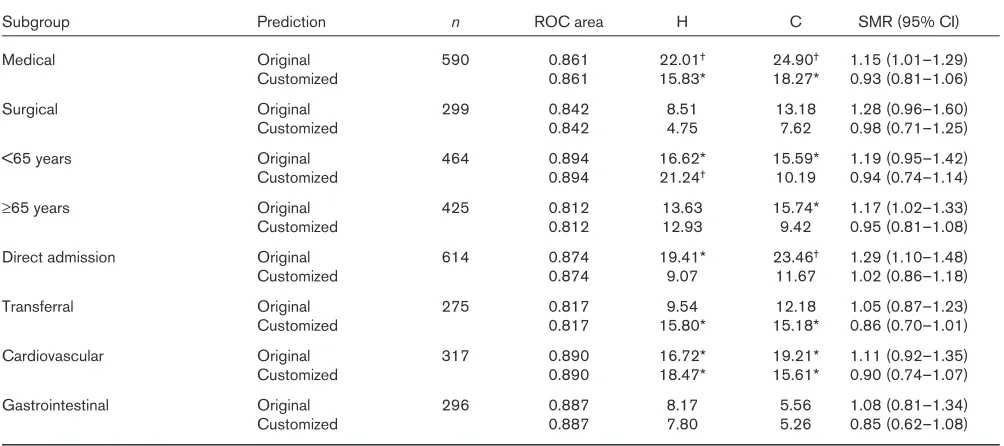
Subgroup analysis of the validation sample is shown in Table 4 for APACHE II and in Table 5 for APACHE III. Fit was not uniform for APACHE II, with varying SMRs. Good-ness-of-fit was insufficient for patients younger than 65 years and for those directly admitted. Although goodness-of-fit improved for most subgroups after customization, it
was still not uniform. These findings were similar for APACHE III. Goodness-of-fit was insufficient for medical, younger, directly admitted and cardiovascular patients. Fit was improved for all but younger and transferred patients. However, it was still not uniform after customization.
Discussion
Customization of APACHE II and III in a large patient pop-ulation from a single unit led to an improvement in the overall goodness-of-fit of APACHE III, which showed poor calibration in its original version. Despite a similar improve-ment of fit in several subgroups that were large enough to be tested, good uniformity of fit was not achieved.
[image:3.612.315.556.117.372.2]These results are comparable with those of a large multi-center study [9] that analyzed customization of the Mortal-ity Prediction Model. In that study, a second-level customization, in which new coefficients were developed for all single patient factors included in the original model, improved calibration even further. Second-level customiza-tion was not attempted in the present patient sample because there were not enough patients for that purpose. Time to collect data in a sufficiently large patient sample in a single unit would probably be so great that real changes in case-mix or ICU treatment might occur during the study, which would confound the results. First-level customiza-tion will probably be a more practical method for single Table 1
Customized coefficients used in the calculation of probability of hospital death
Coefficient
Model βc
0 βc1
APACHE II 0.1926 1.0686
[image:3.612.58.300.131.203.2]APACHE III 0.4022 1.0177
Table 2
Demographic and clinical data for APACHE II sample
Patient characteristic Development Validation
Cases (n) 1863 932
Age (mean ± SD) 62.5 ± 16.1 61.8 ± 16.3
Medical (%) 65.5 66.0
Surgical (%) 34.5 34.0
Direct admission (%) 69.9 68.1
Referral (%) 30.1 31.9
<65 years (%) 49.1 52.0
≥65 years (%) 50.9 48.0
Cardiovascular (%) 38.9 38.6
Gastrointestinal (%) 32.9 31.8
DOS ICU (mean ± SD) 3.95 ± 7.0 3.48 ± 5.4 DOS hospital (mean ± SD) 25.35 ± 22.4 25.26 ± 22.5
Hospital mortality (%) 18.5 17.2
APACHE II prediction (%) 17.3 16.6
APACHE III prediction (%) 14.7 14.7
units to improve the overall fit of score systems that are to be used for quality assessment.
At present, however, we would not recommend cus-tomization routinely. This is because a major problem is still unresolved; although good calibration can be achieved for the whole patient sample, uniformity of fit remains unsatisfactory. This is the case even for APACHE
[image:4.612.57.552.99.389.2]III, which accounts for more case-mix factors, such as diagnostic categories and lead time, than do the other models. Nevertheless, achievement of uniformity is impor-tant, because change in case-mix over time will otherwise lead to a loss of accuracy of a customized model. It would be difficult to interpret whether a change in the mortality ratio over time would be due to a change in quality of care or in case-mix.
Table 3
Discrimination and calibration of APACHE II and III before and after customization
Prediction Sample n ROC area H C SMR (95% CI)
APACHE II original Development 1863 0.817 10.46 9.38 1.07 (0.98–1.16)
Validation 932 0.826 8.02 10.68 1.04 (0.91–1.16)
APACHE II customized Development 1863 0.817 9.37 5.53 1.00 (0.92–1.08)
Validation 932 0.826 6.23 8.59 0.97 (0.85–1.09)
APACHE III original Development 1772 0.849 34.30† 34.96† 1.25 (1.15–1.34)
Validation 889 0.863 20.13* 20.19* 1.18 (1.05–1.31)
APACHE III customized Development 1772 0.849 7.29 6.14 1.00 (0.92–1.08)
Validation 889 0.863 15.10 11.72 0.94 (0.83–1.06)
[image:4.612.56.555.481.606.2]*P= 0.01, †P< 0.001. C, Hosmer–Lemeshow goodness-of-fit C test; H, Hosmer–Lemeshow goodness-of-fit H test; CI, confidence interval. Figure 1
If a customized model still has a poor fit for a certain sub-group at a specific unit, then customization for this sample can be attempted separately [10,11]. This could be attempted in medical and cardiovascular patients at our
unit for APACHE III, because these groups are sufficiently large and because general customization did not lead to a good fit. However, the practicality of such an approach is questionable.
primary research
commentary
review
reports
[image:5.612.56.559.118.342.2]meeting abstracts
Table 4
Discrimination and calibration of APACHE II before and after customization for various subgroups of the validation sample
Subgroup Prediction n ROC area H C SMR (95% CI)
Medical Original 615 0.842 5.89 12.08 1.08 (0.94–1.23)
Customized 0.842 7.90 9.65 1.01 (0.88–1.15)
Surgical Original 317 0.758 5.48 7.15 0.91 (0.65–1.18)
Customized 0.758 6.87 7.53 0.86 (0.60–1.11)
<65 years Original 485 0.859 14.31 20.13† 0.91 (0.70–1.13)
Customized 0.859 8.82 19.90* 0.86 (0.66–1.07)
≥65 years Original 447 0.774 8.09 8.31 1.11 (0.96–1.27)
Customized 0.774 7.16 7.27 1.04 (0.89–1.19)
Direct admission Original 635 0.816 12.12 16.01* 0.99 (0.82–1.10)
Customized 0.816 7.98 15.57* 0.93 (0.77–1.10)
Transferral Original 297 0.814 3.05 3.90 1.10 (0.87–1.23)
Customized 0.814 7.06 2.74 1.03 (0.85–1.20)
Cardiovascular Original 360 0.879 9.21 11.13 1.05 (0.86–1.24)
Customized 0.879 10.44 8.83 0.99 (0.80–1.17)
Gastrointestinal Original 296 0.855 11.12 12.82 0.76 (0.53–0.98)
Customized 0.855 12.31 13.73 0.71 (0.49–0.92)
Direct admission is defined as admission from emergency room, operating theatre, or recovery room; and transferral is defined as admission from other hospital, other ICU, or floor. C, Hosmer–Lemeshow goodness-of-fit C test; H, Hosmer–Lemeshow goodness-of-fit H test; CI, confidence interval. *P< 0.05, †P= 0.01.
Table 5
Discrimination and calibration of APACHE III before and after customization for various subgroups of the validation sample
Subgroup Prediction n ROC area H C SMR (95% CI)
Medical Original 590 0.861 22.01† 24.90† 1.15 (1.01–1.29)
Customized 0.861 15.83* 18.27* 0.93 (0.81–1.06)
Surgical Original 299 0.842 8.51 13.18 1.28 (0.96–1.60)
Customized 0.842 4.75 7.62 0.98 (0.71–1.25)
<65 years Original 464 0.894 16.62* 15.59* 1.19 (0.95–1.42)
Customized 0.894 21.24† 10.19 0.94 (0.74–1.14)
≥65 years Original 425 0.812 13.63 15.74* 1.17 (1.02–1.33)
Customized 0.812 12.93 9.42 0.95 (0.81–1.08)
Direct admission Original 614 0.874 19.41* 23.46† 1.29 (1.10–1.48)
Customized 0.874 9.07 11.67 1.02 (0.86–1.18)
Transferral Original 275 0.817 9.54 12.18 1.05 (0.87–1.23)
Customized 0.817 15.80* 15.18* 0.86 (0.70–1.01)
Cardiovascular Original 317 0.890 16.72* 19.21* 1.11 (0.92–1.35)
Customized 0.890 18.47* 15.61* 0.90 (0.74–1.07)
Gastrointestinal Original 296 0.887 8.17 5.56 1.08 (0.81–1.34)
Customized 0.887 7.80 5.26 0.85 (0.62–1.08)
[image:5.612.56.558.425.648.2]We conclude that the customized models of APACHE II and III did not provide an advantage over the original ver-sions. First-level customization did not solve the problem of differences in case-mix, leading to different score results, which do not necessarily reflect differences in quality of care [18]. Data collection is ongoing to test vari-ation in the original and customized scores over time in a second large sample from our unit.
References
1. Bodmann KF, Ehlers B, Häbel U, Ritschel P, Rühmkorf K: Epi-demiologic and prognostic data of 2054 patients in a medical
intensive care unit.Dtsch Med Wochenschr 1997, 122:919–
925.
2. Knaus WA, Draper EA, Wagner DP, Zimmerman JE: An evalua-tion of outcome from intensive care in major medical centers.
Ann Intern Med1986, 104:410–418.
3. Shortell SM, Zimmerman JE, Rousseau DM, Gillies RR, Wagner DP, Draper EA, Knaus WA, Duffy J: The performance of inten-sive care units: does good management make a difference?
Med Care1994, 32:508–525.
4. Beck DH, Taylor BL, Millar B, Smith GB: Prediction of outcome from intensive care: a prospective cohort study comparing Acute Physiology and Chronic Health Evaluation II and III prognostic systems in a United Kingdom intensive care unit.
Crit Care Med1997, 25:9–15.
5. Moreno R, Miranda DR, Fidler V, Van Schilfgaarde R: Evaluation of two outcome prediction models on an independent
data-base.Crit Care Med1998, 26:50–61.
6. Rowan KM, Kerr JH, Major E, McPherson K, Short A, Vessey MP: Intensive Care Society’s APACHE II study in Britain and Ireland-II: outcome comparisons of intensive care units after
adjust-ment for case mix by the American APACHE II method.Br Med
J1993, 307: 977–981
7. Rowan KM, Kerr JH, Major E, McPherson K, Short A, Vessey MP: Intensive Care Society’s APACHE II study in Britain and Ireland-I: variations in case mix of adult admissions to
general intensive care units and impact on outcome.Br Med J
1993, 307:972–977.
8. Lemeshow S, Le Gall JR: Modeling the severity of illness of ICU
patients. A systems update.JAMA1994, 272:1049–1055.
9. Moreno R, Apolone G: Impact of different customization
strate-gies in the performance of a general severity score.Crit Care
Med1997, 25:2001–2008.
10. Le Gall JR, Lemeshow S, Leleu G, Klar J, Huillard J, Rué M, Teres D, Artigas A: Customized probability models for early severe
sepsis in adult intensive care patients. JAMA 1995,
273:644–650.
11. Sarmiento X, Rué M, Guardiola JJ, Toboso JM, Soler M, Artigas A: Assessment of the prognosis of coronary patients.
Perfor-mance and customization of generic severity indexes.Chest
1997, 111:1666–1671.
12. Knaus WA, Draper EA, Wagner DP, Zimmerman JE: APACHE II:
a severity of disease classification system. Crit Care Med
1985, 13:818–829.
13. Knaus WA, Wagner DP, Draper EA, Zimmerman JE, Bergner M, Bastos PG, Sirio CA, Murphy DJ, Lotring T, Damiano A, Harrell
FE: The APACHE III prognostic scoring system: risk prediction
of hospital mortality for critically ill hospitalized adults.Chest
1991, 100:1619–1636.
14. Hosmer DW, Lemeshow S: Applied Logistic Regression. New York: John Wiley & Sons; 1989.
15. Hanley JA, McNeil BJ: The meaning and use of the area under
a receiver operating characteristic (ROC) curve. Radiology
1982, 143:29–36.
16. Rapoport J, Teres D, Lemeshow S, Gehlbach S: A method for assessing the clinical performance and cost-effectiveness of
intensive care units: a multicenter inception cohort study.Crit
Care Med1994, 22:1385–1391.
17. Lemeshow S, Hosmer DW: A review of goodness of fit statis-tics for use in the development of logistic regression models.
Am J Epidemiol1982, 115:92–106.
18. Markgraf R, Deutschinoff G, Pientka L, Scholten T: Comparison of Acute Physiology and Chronic Health Evaluations II and III and Simplified Acute Physiology Score II: a prospective cohort study evaluating these methods to predict outcome in
a German interdisciplinary intensive care unit.Crit Care Med