R E S E A R C H
Open Access
The prognostic value of optic nerve sheath
diameter in patients with subarachnoid
hemorrhage
Sangkil Lee
1, Yong Oh Kim
2, Ji Sun Baek
3and Jeong-Am Ryu
2,4*Abstract
Background:We evaluated the role of optic nerve sheath diameter (ONSD) using brain computed tomography
(CT) in predicting neurological outcomes of patients with subarachnoid hemorrhage (SAH).
Methods:This was a retrospective, multicenter, observational study of adult patients with SAH admitted between January 2012 and June 2017. Initial brain CT was performed within 12 h from onset of SAH, and follow-up brain CT was performed within 24 h from treatment of a ruptured aneurysm. Primary outcome was neurological status at 6-month follow-up assessed with the Glasgow Outcome Scale (GOS, 1 to 5).
Results:Among 223 SAH patients, 202 (90.6%) survived until discharge. Of these survivors, 186 (83.4%) manifested favorable neurological outcomes (GOS of 3, 4, or 5). In this study, the ONSDs in the group of patients with poor neurological outcome were significantly greater than those in the favorable neurological outcome group (allp< 0.01). Intracranial pressure (ICP) was monitored in 21 (9.4%) patients during the follow-up CT. A linear correlation existed between the average ONSD and ICP in simple correlation analysis (r= 0.525,p= 0.036). Analysis of the receiver operating characteristic curve for prediction of poor neurological outcome showed that ONSD had considerable predictive value (C-statistics, 0.735 to 0.812). In addition, the performance of a composite of Hunt and Hess grade and ONSD was increasingly associated with poor neurological outcomes than the use of each marker alone.
Conclusions:ONSD measured with CT may be used in combination with clinical grading scales to improve prognostic accuracy in SAH patients.
Keywords:Optic nerve sheath diameter, Brain computed tomography, Subarachnoid hemorrhage
Key messages
In this study, patients with poor-grade SAH showed considerable survival (79.5%) and favorable neuro-logical prognoses (61.4%).
Concurrent measurement of ONSDs using brain CT
and ICP was moderately correlated.
The ONSDs of patients with poor neurological
outcome were significantly greater than those with a favorable neurological outcome.
A composite parameter of H-H grade and ONSD
measured with CT may increase the accuracy of prognosis in patients diagnosed with SAH (H-H grade > 3 and follow-up ONSDindex> 6.22).
Background
Subarachnoid hemorrhage (SAH) is a complex neurovas-cular syndrome and a devastating condition associated with high mortality and morbidity rates for those who survive the initial hemorrhage [1–3]. In SAH patients, the level of consciousness at admission is the most crit-ical early predictor of clincrit-ical outcome [1, 4]. Patients with poor-grade SAH (grades 4 to 5) based on Hunt and
* Correspondence:[email protected]
2Department of Critical Care Medicine, Samsung Medical Center,
Sungkyunkwan University School of Medicine, 81 Irwon-ro, Gangnam-gu, Seoul 06351, Republic of Korea
4Department of Neurosurgery, Samsung Medical Center, Sungkyunkwan
University School of Medicine, 81 Irwon-ro, Gangnam-gu, Seoul 06351, Republic of Korea
Full list of author information is available at the end of the article
Hess [5] or World Federation of Neurosurgical Societies (WFNS) grading scales [6] show high mortality and poor neurological outcomes [7]. However, recent reports sug-gest that patients with poor-grade SAH treated early and aggressively with coil embolization and neurointensive care achieved favorable neurological outcomes [3, 7]. Therefore, new predictors other than the initial level of consciousness are needed to accurately evaluate the prognosis of these patients.
Poor neurological outcomes of SAH patients are usu-ally secondary to early brain injury, rebleeding, or de-layed cerebral ischemia [1, 8, 9]. Early brain injury is associated with intracranial hypertension [1, 9, 10]. Therefore, early monitoring of intracranial hypertension may allow prediction of neurological outcomes in these patients. Optic nerve sheath diameter (ONSD) has been proposed as an alternative measure for the detection of intracranial hypertension [11, 12]. The ONSD may be associated with neurological outcomes of SAH patients. However, it has not been reported whether ONSD may facilitate systemic evaluation of neurological outcomes of patients with SAH. Therefore, the objective of this study is to investigate if ONSD with some modifications could be used to predict neurological outcomes of pa-tients with SAH.
Methods
Study population and design
This was a retrospective, multicenter, observational study of adult patients with SAH admitted to the
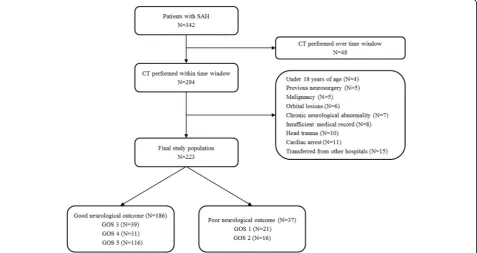
neurosurgical intensive care unit at ChungBuk National University Hospital (CBNUH) and Samsung Medical Center (SMC) between January 2012 and June 2017. The study was approved by the institutional review boards of CBNUH (CBNUH 2018-08-014-001) and SMC (SMC 2018-07-154). The requirement for informed consent was waived due to the retrospective study design. We in-cluded patients with (1) SAH admitted to the neurosur-gical intensive care unit during the study period, (2) brain computed tomography (CT) within 12 h from the onset of SAH, (3) follow-up brain CT within 24 h of treatment for ruptured aneurysm, and (4) follow-up brain CT within 48 h from the onset of SAH if they were not treated for aneurysm. Of these patients, we excluded patients (1) under age 18; (2) with malignancy and whose expected life span was less than 1 year; (3) with insufficient medical records; (4) with a history of head trauma, neurosurgery, cardiac arrest, or chronic neuro-logical abnormality on admission; (5) transferred from other hospitals after more than 24 h of SAH onset; or (6) with orbital anomaly, orbital mass lesions, and ocular or retro-orbital injury. We analyzed a total of 223 patients diagnosed with SAH in this study (Fig.1).
Measurements and outcomes
In this study, we defined poor-grade SAH as grades 4 to 5 according to Hunt and Hess (H-H) [1,4, 5]. The pri-mary outcome was neurological status 6 months later assessed with a Glasgow Outcome Scale (GOS, 1 to 5) [12]. Patients with GOS scores of 3, 4, and 5 indicated
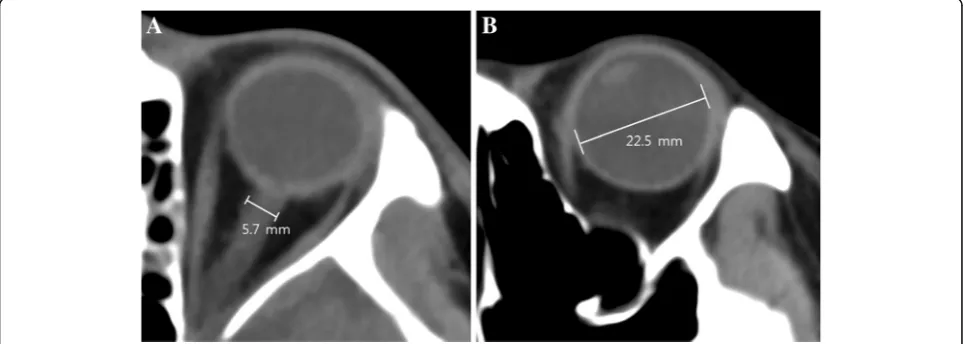
[image:2.595.61.539.460.713.2]favorable neurological outcomes whereas GOS scores of 1 and 2 indicated poor neurological outcomes. We thor-oughly reviewed medical records, and two independent neurologists measured the patients’ GOS scores. Initial brain CT angiography and follow-up CT were performed within a specified time window. All the CT studies were performed using 64-channel scanners (Brilliance 64, Phi-lips Medical Systems, Best, the Netherlands, at CBNUH and Light Speed VCT, GE Healthcare, Milwaukee, WI, USA, at SMC) with a 5-mm-slice width. Brain CT im-ages were reviewed by two independent neurologists (SL and JAR). Investigators who were blinded to clinical in-formation evaluated each of the patients’CT scans using commercial image-viewing software (Picture Archiving and Communication System; Maroview 5.3 Infinitt Co., Seoul, Republic of Korea, at CBNUH and Centricity RA1000 PACS Viewer, GE Healthcare at SMC). The ONSD and eyeball transverse diameter (ETD) were mea-sured using the same initial CT and subsequent scans. The ONSD was measured at a distance of 3 mm behind the eyeball, immediately below the sclera in a perpen-dicular vector with reference to the linear axis of the nerve (Fig.2a) [11–13]. The images were changed to the “chest/abdomen” window (window width 300 and win-dow level 10) and magnified fourfold on the particular image slice that demonstrated the largest diameter of the optic nerve sheath [12]. The ONSD was measured from one side of the optic nerve sheath to the other as a section through the center of the optic nerve [13]. The transverse diameter of the eyeball was chosen because the ONSD is usually measured in the transverse plane [14]. ETD was defined as the maximal transverse diameter of the eyeball measured from one side of the retina to the other (in-to-in, Fig. 2b) [14, 15]. The ONSDaverage and the
ETDaverage measured for the patient’s left and right eyes
were averaged to yield a mean value. The ONSDindex was
defined as median ETD (22.7 mm) multiplied by the
average value of bilateral ONSDs divided by the average value of bilateral ETDs (22.7 × ONSDaverage/ETDaverage).
The intracranial pressure (ICP) at the time of follow-up CT was designated as the immediate ICP after the CT scan.
Statistical analyses
Clinical and laboratory data were collected by a trained study coordinator using a standardized case report form. All data are presented as means ± standard deviations (SD) for continuous variables and numbers (percentages) for categor-ical variables. We compared data using the Student’st-test for continuous variables and chi-square test or Fisher’s exact test for categorical variables. A scatter plot was drawn to as-certain the relationship between simultaneously measured ONSD and ICP. We calculated Pearson’s correlation coeffi-cient (r) to evaluate the correlation between ONSD and ICP. We assessed the predictive performance of ONSDs and ONSD indices using the areas under the curve (AUCs) of the receiver operating characteristic (ROC) curves for sensitivity vs. 1-specificity. We compared AUCs using the nonparametric approach published by DeLong et al. [16] for two correlated AUCs. We obtained optimal cutoffs for each ONSD and their modifications to predict poor neurological outcomes by ROC curve and Youden index [17, 18]. We used the bidirectional elimination technique in the stepwise selection method to select clinically and statistically mean-ingful predictor variables. The adequacy of the prediction model was also determined using the Osius and Rojek test of goodness-of-fit [19]. All tests were two-sided, andp< 0.05 was statistically significant. We analyzed the data using IBM SPSS version 20 (IBM, Armonk, NY, USA).
Results
Baseline characteristics and clinical outcomes
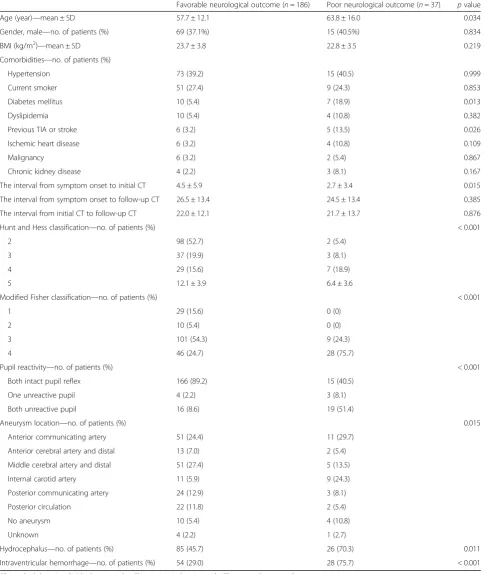
The mean age of patients was 58.7 ± 13.0 years, and 84 (37.7%) patients were males. Hypertension (39.5%) and smoking (26.9%) were the most common comorbidities
[image:3.595.57.540.542.714.2]among the SAH patients. Eighty-three (37.2%) patients were H-H grades 4 or 5, and 96 (43.0%) were WFNS grades 4 or 5. WFNS grade was higher in patients in-cluded under the poor neurological outcome group compared with the favorable neurological outcome group (4.4 ± 1.1 vs. 2.4 ± 1.5, p< 0.001). Fisher grade and modified Fisher grade were also higher in the poor logical outcome group compared with favorable neuro-logical outcome group (3.9 ± 0.3 vs. 3.2 ± 0.7, p < 0.001 and 3.8 ± 0.4 vs. 2.9 ± 1.0,p< 0.001, respectively). Baseline characteristics of SAH patients are presented in Table1. Anterior communicating artery (29.6%) and middle cere-bral artery (25.1%) were the most common locations of a ruptured aneurysm. However, no aneurysm or ruptured aneurysm was detected in 14 patients (6.3%). Ruptured aneurysm was treated within 72 h in most patients (88.8%). Endovascular coiling of the ruptured aneurysm was performed in 124 (55.6%) patients, and surgical clip-ping was performed in 75 (33.6%) patients; delayed cere-bral ischemia was observed in 46 (20.6%) patients. Treatment characteristics of SAH patients are presented in Table2. Two hundred two patients (90.6%) survived to discharge. Of these 202 survivors, 186 (83.4%) had favor-able neurological outcomes (GOS of 3, 4, or 5, Fig. 1). Among the 83 (37.2%) patients with poor-grade SAH, 66 survived to discharge (79.5%), and 51 (61.4%) had favor-able neurological outcomes.
Optic nerve sheath diameters and their modifications
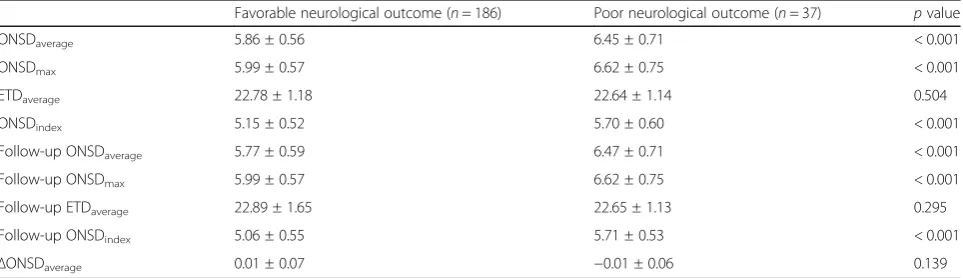
In this study, initial and follow-up ONSDs in the poor neurological outcome group were significantly greater than in the favorable outcome group (Table3). However, initial ETD and follow-up ETD did not differ signifi-cantly between the favorable and poor neurological out-come groups (P= 0.504 and P= 0.295, respectively). In addition, changes in ONSD (ΔONSDaverage) between
ini-tial and follow-up CT were not associated with progno-sis. Although invasive ICP monitoring was performed in 80 (35.9%) patients during hospitalization, the ICP was measured in only 21 (9.4%) patients at the time of follow-up CT. Based on simple correlation analysis, the ICP showed a linear correlation with follow-up ONS-Daverage and follow-up ONSDindex (r= 0.525, P= 0.036
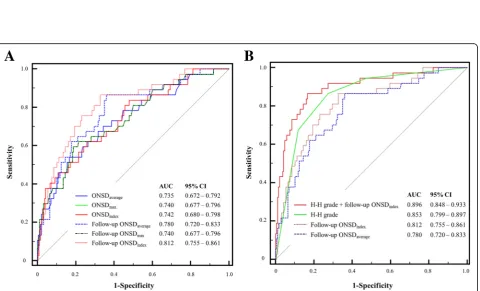
and r= 0.500, P= 0.048, respectively) (Fig. 3). In ROC curve analysis for prediction of poor neurological out-comes (Fig. 4a), the AUCs of ONSDindex were greater
than those of ONSDaverage during the initial CT and
follow-up CT. However, no significant differences existed between the predictive performance of ONSD in-dex and ONSDaverageduring the initial CT and follow-up
CT (P= 0.764, P= 0.086, respectively). The performance of ONSDindex in follow-up CT was significantly better
than that of ONSDindex and ONSDaverage in initial CT
(P= 0.033, P= 0.022, respectively). The C-statistic of
follow-up ONSDindex was 0.812 (95% confidence
inter-val (CI) 0.754 to 0.861). A cutoff > 6.22 had a sensitivity of 70.3% (95% CI 53.0 to 84.1%) and a specificity of 80.7% (95% CI 74.2 to 86.1%). The C-statistic of H-H grade was 0.853 (95% CI 0.799 to 0.897). A cutoff > 3 had a sensitivity of 86.5% (95% CI 71.2 to 95.5%) and a specificity of 72.6% (95% CI 65.6 to 78.9%). Although no significant differences existed between the AUCs of H-H grade, the follow-up ONSDaverage, and the follow-up
ONSDindex, the composite of H-H grade and the
follow-up ONSDindex [AUC 0.896, Brier score 0.078,
goodness-of-fit (Osius-Rojek) Z=−0.5052, p= 0.613] showed the highest ability to correctly predict poor neurological outcomes rather than either marker alone (all p< 0.006, Fig. 4b). Based on our definitions of poor markers as H-H grade > 3 and follow-up ONSDindex >
6.22, 107 (48.0%) patients had one or more poor markers (sensitivity 91.9% and specificity 60.8%). Of these patients, 39 (17.5%) carried two poor markers (H-H grade > 3 [poor-grade SAH] and follow-up ONSDindex> 6.22,
sensi-tivity 64.9%, and specificity 91.9%).
Discussion
In this study, we evaluated whether ONSDs and their modifications could be used to predict neurological out-comes of patients with SAH. The major study findings were as follows: (1) Patients with poor-grade SAH mani-fested considerable survival rate (79.5%) and favorable neurological prognoses (61.4%); (2) simultaneous mea-surements of ONSDs with brain CT and ICP were mod-erately correlated; (3) during initial and follow-up CT, the ONSDs of patients in the poor neurological outcome group were significantly greater than in those of the fa-vorable neurological outcome group, and these markers might predict neurological outcomes of SAH patients. In addition, follow-up ONSDs predicted prognosis better than the initial ONSDs; (4) the combined H-H grade and ONSD measured with CT was strongly associated with poor neurological outcomes than the use of either marker alone (H-H grade > 3 [poor-grade SAH] and follow-up ONSDindex> 6.22).
Although it is difficult to predict the outcomes following SAH, the level of consciousness at admission is associated with patient prognosis [1,3,7]. The widely accepted predictors include H-H grade [5], WFNS grade based on the level of consciousness assessed using the Glasgow coma scale [6, 7], and more recently, VASOGRADE-Red [20]. In particular, patients with poor-grade SAH historically showed high mortality and poor neurological outcomes [7]. However, in re-cent years, a considerable number of patients with poor-grade SAH treated aggressively with early coil
embolization and supportive neurointensive care
[3, 7]. Therefore, to accurately evaluate the prognosis of patients with poor-grade SAH, predictors other than the initial level of consciousness are needed.
[image:5.595.57.543.101.676.2]In SAH patients, poor neurological outcome is usually secondary to early brain injury, rebleeding, or delayed cerebral ischemia [1,8,9]. Although rebleeding, cerebral Table 1Baseline characteristics
Favorable neurological outcome (n= 186) Poor neurological outcome (n= 37) pvalue
Age (year)—mean ± SD 57.7 ± 12.1 63.8 ± 16.0 0.034
Gender, male—no. of patients (%) 69 (37.1%) 15 (40.5%) 0.834
BMI (kg/m2)—mean ± SD 23.7 ± 3.8 22.8 ± 3.5 0.219
Comorbidities—no. of patients (%)
Hypertension 73 (39.2) 15 (40.5) 0.999
Current smoker 51 (27.4) 9 (24.3) 0.853
Diabetes mellitus 10 (5.4) 7 (18.9) 0.013
Dyslipidemia 10 (5.4) 4 (10.8) 0.382
Previous TIA or stroke 6 (3.2) 5 (13.5) 0.026
Ischemic heart disease 6 (3.2) 4 (10.8) 0.109
Malignancy 6 (3.2) 2 (5.4) 0.867
Chronic kidney disease 4 (2.2) 3 (8.1) 0.167
The interval from symptom onset to initial CT 4.5 ± 5.9 2.7 ± 3.4 0.015
The interval from symptom onset to follow-up CT 26.5 ± 13.4 24.5 ± 13.4 0.385
The interval from initial CT to follow-up CT 22.0 ± 12.1 21.7 ± 13.7 0.876
Hunt and Hess classification—no. of patients (%) < 0.001
2 98 (52.7) 2 (5.4)
3 37 (19.9) 3 (8.1)
4 29 (15.6) 7 (18.9)
5 12.1 ± 3.9 6.4 ± 3.6
Modified Fisher classification—no. of patients (%) < 0.001
1 29 (15.6) 0 (0)
2 10 (5.4) 0 (0)
3 101 (54.3) 9 (24.3)
4 46 (24.7) 28 (75.7)
Pupil reactivity—no. of patients (%) < 0.001
Both intact pupil reflex 166 (89.2) 15 (40.5)
One unreactive pupil 4 (2.2) 3 (8.1)
Both unreactive pupil 16 (8.6) 19 (51.4)
Aneurysm location—no. of patients (%) 0.015
Anterior communicating artery 51 (24.4) 11 (29.7)
Anterior cerebral artery and distal 13 (7.0) 2 (5.4)
Middle cerebral artery and distal 51 (27.4) 5 (13.5)
Internal carotid artery 11 (5.9) 9 (24.3)
Posterior communicating artery 24 (12.9) 3 (8.1)
Posterior circulation 22 (11.8) 2 (5.4)
No aneurysm 10 (5.4) 4 (10.8)
Unknown 4 (2.2) 1 (2.7)
Hydrocephalus—no. of patients (%) 85 (45.7) 26 (70.3) 0.011
Intraventricular hemorrhage—no. of patients (%) 54 (29.0) 28 (75.7) < 0.001
vasospasm, and delayed cerebral ischemia may occur in patients with initially normal ICP, early brain injury within the first 72 h after the hemorrhage associated with acute consequences of SAH induced sudden intra-cranial hypertension [1, 9]. Severely increased ICP, one of the major mechanisms of early brain injury, leads to decreased cerebral perfusion pressure, cessation of cere-bral blood flow, and ultimately global ischemia and edema [9,10]. Early brain injury may increase the risk of developing delayed cerebral ischemia [9, 21]. Therefore, early monitoring of intracranial hypertension may facili-tate the prediction of neurological outcomes in patients with SAH. In addition, it may be also used to identify a subgroup of SAH patients with uncontrolled refractory intracranial hypertension, who are at risk of death or de-layed neurological impairment and benefit from different management strategies such as decompressive craniect-omy or barbiturate coma therapy. Eventually, early mon-itoring of intracranial hypertension based on the
measurement of ONSD may be useful to treat SAH patients.
[image:6.595.56.537.98.295.2]ONSD has been proposed as an alternative parameter for detection of increased intracranial pressure [11]. The optic nerve is surrounded by cerebrospinal fluid because it is a part of the central nervous system. Therefore, in-creased ICP is transmitted through the subarachnoid space surrounding the optic nerve within the nerve sheath, especially the retrobulbar segment, unless circu-lation of cerebrospinal fluid is not blocked [11]. The ONSD measured during the initial brain CT may be cor-related with neurologic outcomes after traumatic brain injury [12, 22]. Simultaneous measurement of ONSD with initial CT and intracranial pressure were correlated, and ONSD was indicative of intracranial hypertension in patients with severe traumatic brain injury [12, 22]. In this study, ONSD measured with CT was also a good predictive marker associated with ICP and prognosis in SAH patients.
Table 2Treatment characteristics
Favorable neurological outcome (n= 186) Poor neurological outcome (n= 37) pvalue
Aneurysm treatment and timing—no. of patients (%) < 0.001
Early treatment within 72 h 174 (93.5) 24 (64.9)
Early but non-aneurysm detection 8 (4.3) 0 (0)
Late treatment 1 (0.5) 1 (2.7)
No treatment 3 (1.6) 12 (32.4)
Aneurysm management—no. of patients (%)
Coiling 108 (58.1) 16 (43.2) 0.140
Clipping 66 (35.5) 9 (24.3) 0.262
Endotracheal intubation during over 24 h 38 (20.4%) 33 (89.2%) < 0.001
External ventricular drainage—no. of patients (%) 64 (34.4) 16 (43.2) 0.403
Delayed cerebral ischemia—no. of patients (%) 39 (21.0) 7 (18.9) 0.953
Decompressive craniectomy—no. of patients (%) 12 (6.5) 8 (21.6) 0.008
Barbiturate coma therapy—no. of patients (%) 2 (1.1) 3 (8.1) 0.042
Table 3The optic nerve sheath diameters and their modifications according to neurological outcomes
Favorable neurological outcome (n= 186) Poor neurological outcome (n= 37) pvalue
ONSDaverage 5.86 ± 0.56 6.45 ± 0.71 < 0.001
ONSDmax 5.99 ± 0.57 6.62 ± 0.75 < 0.001
ETDaverage 22.78 ± 1.18 22.64 ± 1.14 0.504
ONSDindex 5.15 ± 0.52 5.70 ± 0.60 < 0.001
Follow-up ONSDaverage 5.77 ± 0.59 6.47 ± 0.71 < 0.001
Follow-up ONSDmax 5.99 ± 0.57 6.62 ± 0.75 < 0.001
Follow-up ETDaverage 22.89 ± 1.65 22.65 ± 1.13 0.295
Follow-up ONSDindex 5.06 ± 0.55 5.71 ± 0.53 < 0.001
ΔONSDaverage 0.01 ± 0.07 −0.01 ± 0.06 0.139
[image:6.595.58.540.584.723.2]Fig. 3Scatter plot of intracranial pressure (ICP, mmHg) and optic nerve sheath diameter (ONSD, mm). Follow-up ONSDaverageand follow-up ONSDindexwere used in simple correlation analysis
[image:7.595.57.537.88.342.2] [image:7.595.60.541.383.674.2]Although ONSD is considered an indirect marker for ICP, the optimal cutoff for an abnormal ONSD indicat-ing elevated ICP and its associated factors have been unclear [23]. In addition, there are limited reports in-vestigating the role of ONSD modifications or indices in detecting intracranial hypertension compared with
absolute ONSD [14, 15]. The ONSD correlates
strongly with ETD in healthy people, and the ONSD/ ETD ratio may provide highly reliable data than the absolute ONSD as a marker of ICP [23]. However, in this study, there were no significant differences be-tween the ONSD/ETD ratio and absolute ONSD in predicting poor neurological outcomes. Therefore, fu-ture studies with larger cohorts are needed to confirm these findings.
In this study, we evaluated the potential usefulness of ONSD in detecting intracranial hypertension non-invasively and rapidly and determined its value in clin-ical decision-making for the management of SAH patients. ONSD has been proposed as an indirect and alternative parameter for detection of intracranial hypertension [11, 12]. However, ICP alone is not the only determinant of poor neurological outcome. Therefore, ONSD alone cannot be considered as the ideal predictor of neurological outcomes in SAH pa-tients. Eventually, ONSD may be used in combination with clinical grading scales to improve prognostic accuracy.
This study has several limitations. First, it was a retrospective review of medical records. Therefore, the GOS was also retrospectively determined based on medical records. Second, the non-randomized nature of the registry data may have resulted in selection bias. Although brain CT scans were performed within 48 h after SAH, a major limitation of this study may be re-lated to the CT scans performed at different times. Third, the brain CT scan was performed by two differ-ent scanners, and ONSDs were also obtained using
two different commercial image-viewing software
products, which might have resulted in bias. In addition, ONSD measurement requires high image resolution and specific CT settings such as optimal slice thickness and slice angle with the skull base. The heterogeneity of CT scan protocols may explain the relatively weak correlation between ONSD and ICP in this study [24]. Fourth, invasive ICP monitoring was performed in a limited number of patients after aneurysmal treatment. Finally, our study has limited statistical power due to the small sample size. Al-though it still provides valuable insight, prospective large-scale studies are needed to evaluate the useful-ness of ONSD using brain CT in predicting neuro-logical outcomes of patients with SAH to arrive at evidence-based conclusions.
Conclusion
ONSDs measured with CT may be used to predict neuro-logical outcomes of SAH patients. Furthermore, a com-posite parameter of H-H grade and ONSD may be helpful to more accurately assess the prognosis of SAH patients.
Abbreviations
AUC:Area under the curve; CT: Computed tomography; ETD: Eyeball transverse diameter; GOS: Glasgow Outcome Scale; H-H: Hunt and Hess; ICP: Intracranial pressure; IQR: Interquartile range; ONSD: Optic nerve sheath diameter; ROC: Receiver operating characteristic; SAH: Subarachnoid hemorrhage
Acknowledgements
We appreciate the excellent statistical support of Keumhee C. Carriere, PhD, and Joonghyun Ahn, MS, of Samsung Biomedical Research Institute.
Funding Not applicable.
Availability of data and materials
Regarding data availability, our data are available on the Harvard Dataverse Network (https://doi.org/10.7910/DVN/DVJHBX) as recommended repositories of critical care.
Authors’contributions
SL participated in the study design, data collection, drafting of the manuscript, and the statistical analysis. YOK participated in the statistical analysis and helped draft the manuscript. JSB participated in the study design and coordination and helped draft the manuscript. JAR participated in the study conception and design, data collection, and drafting of the manuscript. All authors read and approved the final manuscript.
Ethics approval and consent to participate
This study was approved by the institutional review boards of ChungBuk National University Hospital (CNUH 2018-08-014-001) and Samsung Medical Center (SMC 2018-07-154), and patients’records were reviewed and published according to the Declaration of Helsinki. Informed consent was waived because of the retrospective nature of the study.
Consent for publication
Not applicable. This study did not contain any individual or personal data in any form (including individual details, images, or videos).
Competing interests
The authors declare that they have no competing interests.
Publisher’s Note
Springer Nature remains neutral with regard to jurisdictional claims in published maps and institutional affiliations.
Author details
1Department of Neurology, ChungBuk National University Hospital,
Cheongju, Republic of Korea.2Department of Critical Care Medicine, Samsung Medical Center, Sungkyunkwan University School of Medicine, 81 Irwon-ro, Gangnam-gu, Seoul 06351, Republic of Korea.3Department of Ophthalmology, Konyang University, Kim’s Eye Hospital, Myung-Gok Eye Research Institute, Seoul, Republic of Korea.4Department of Neurosurgery, Samsung Medical Center, Sungkyunkwan University School of Medicine, 81 Irwon-ro, Gangnam-gu, Seoul 06351, Republic of Korea.
Received: 10 December 2018 Accepted: 14 February 2019
References
2. Naval NS, Chang T, Caserta F, Kowalski RG, Carhuapoma JR, Tamargo RJ. Improved aneurysmal subarachnoid hemorrhage outcomes: a comparison of 2 decades at an academic center. J Crit Care. 2013;28:182–8. 3. Konczalla J, Seifert V, Beck J, Guresir E, Vatter H, Raabe A, et al. Outcome
after Hunt and Hess grade V subarachnoid hemorrhage: a comparison of pre-coiling era (1980-1995) versus post-ISAT era (2005-2014). J Neurosurg. 2018;128:100–10.
4. Wartenberg KE. Critical care of poor-grade subarachnoid hemorrhage. Curr Opin Crit Care. 2011;17:85–93.
5. Hunt WE, Hess RM. Surgical risk as related to time of intervention in the repair of intracranial aneurysms. J Neurosurg. 1968;28:14–20.
6. Teasdale GM, Drake CG, Hunt W, Kassell N, Sano K, Pertuiset B, et al. A universal subarachnoid hemorrhage scale: report of a committee of the World Federation of Neurosurgical Societies. J Neurol Neurosurg Psychiatry. 1988;51:1457. 7. Taylor CJ, Robertson F, Brealey D, O'Shea F, Stephen T, Brew S, et al.
Outcome in poor grade subarachnoid hemorrhage patients treated with acute endovascular coiling of aneurysms and aggressive intensive care. Neurocrit Care. 2011;14:341–7.
8. Rowland MJ, Hadjipavlou G, Kelly M, Westbrook J, Pattinson KT. Delayed cerebral ischaemia after subarachnoid haemorrhage: looking beyond vasospasm. Br J Anaesth. 2012;109:315–29.
9. Flynn L, Andrews P. Advances in the understanding of delayed cerebral ischaemia after aneurysmal subarachnoid haemorrhage. F1000Res. 2015;4. https://doi.org/10.12688/f1000research.6635.1. PMID: 26937276. 10. Johnson U, Engquist H, Lewen A, Howells T, Nilsson P, Ronne-Engstrom E,
et al. Increased risk of critical CBF levels in SAH patients with actual CPP below calculated optimal CPP. Acta Neurochir. 2017;159:1065–71. 11. Hwan Kim Y, Ho Lee J, Kun Hong C, Won Cho K, Hoon Yeo J, Ju Kang M, et
al. Feasibility of optic nerve sheath diameter measured on initial brain computed tomography as an early neurologic outcome predictor after cardiac arrest. Acad Emerg Med. 2014;21:1121–8.
12. Sekhon MS, Griesdale DE, Robba C, McGlashan N, Needham E, Walland K, et al. Optic nerve sheath diameter on computed tomography is correlated with simultaneously measured intracranial pressure in patients with severe traumatic brain injury. Intensive Care Med. 2014;40:1267–74.
13. Legrand A, Jeanjean P, Delanghe F, Peltier J, Lecat B, Dupont H. Estimation of optic nerve sheath diameter on an initial brain computed tomography scan can contribute prognostic information in traumatic brain injury patients. Crit Care. 2013;17:R61.
14. Vaiman M, Gottlieb P, Bekerman I. Quantitative relations between the eyeball, the optic nerve, and the optic canal important for intracranial pressure monitoring. Head Face Med. 2014;10:32.
15. Bekerman I, Sigal T, Kimiagar I, Ben Ely A, Vaiman M. The quantitative evaluation of intracranial pressure by optic nerve sheath diameter/eye diameter CT measurement. Am J Emerg Med. 2016;34:2336–42. 16. DeLong ER, DeLong DM, Clarke-Pearson DL. Comparing the areas under
two or more correlated receiver operating characteristic curves: a nonparametric approach. Biometrics. 1988;44:837–45.
17. Schisterman EF, Perkins NJ, Liu A, Bondell H. Optimal cut-point and its corresponding Youden Index to discriminate individuals using pooled blood samples. Epidemiology. 2005;16:73–81.
18. Ruopp MD, Perkins NJ, Whitcomb BW, Schisterman EF. Youden Index and optimal cut-point estimated from observations affected by a lower limit of detection. Biom J. 2008;50:419–30.
19. Chen P, Tebbs JM, Bilder CR. Global goodness-of-fit tests for group testing regression models. Stat Med. 2009;28:2912–28.
20. de Oliveira Manoel AL, Jaja BN, Germans MR, Yan H, Qian W, Kouzmina E, et al. The VASOGRADE: a simple grading scale for prediction of delayed cerebral ischemia after subarachnoid hemorrhage. Stroke. 2015;46:1826–31. 21. Sabri M, Lass E, Macdonald RL. Early brain injury: a common mechanism in subarachnoid hemorrhage and global cerebral ischemia. Stroke Res Treat. 2013;2013:394036.
22. Sekhon MS, McBeth P, Zou J, Qiao L, Kolmodin L, Henderson WR, et al. Association between optic nerve sheath diameter and mortality in patients with severe traumatic brain injury. Neurocrit Care. 2014;21:245–52. 23. Kim DH, Jun JS, Kim R. Ultrasonographic measurement of the optic nerve
sheath diameter and its association with eyeball transverse diameter in 585 healthy volunteers. Sci Rep. 2017;7:15906.