R E S E A R C H
Open Access
Heterogeneity of regional inflection points
from pressure-volume curves assessed by
electrical impedance tomography
Gaetano Scaramuzzo
1, Savino Spadaro
1*, Andreas D. Waldmann
2, Stephan H. Böhm
2, Riccardo Ragazzi
1,
Elisabetta Marangoni
1, Valentina Alvisi
1, Elena Spinelli
3, Tommaso Mauri
3and Carlo Alberto Volta
1Abstract
Background:The pressure-volume (P-V) curve has been suggested as a bedside tool to set mechanical ventilation; however, it reflects a global behavior of the lung without giving information on the regional mechanical properties.
RegionalP-V(PVr) curves derived from electrical impedance tomography (EIT) could provide valuable clinical
information at bedside, being able to explore the regional mechanics of the lung. In the present study, we
hypothesized that regionalP-Vcurves would provide different information from those obtained from globalP-V
curves, both in terms of upper and lower inflection points. Therefore, we constructed pressure-volume curves for each pixel row from non-dependent to dependent lung regions of patients affected by acute hypoxemic respiratory failure (AHRF) and acute respiratory distress syndrome (ARDS).
Methods:We analyzed slow-inflationP-Vmaneuvers data from 12 mechanically ventilated patients. During the inflation, the pneumotachograph was used to record flow and airway pressure while the EIT signals were recorded
digitally. From each maneuver, global respiratory systemP-Vcurve (PVg) and PVr curves were obtained, each one
corresponding to a pixel row within the EIT image. PVg and PVr curves were fitted using a sigmoidal equation, and the upper (UIP) and lower (LIP) inflection points for each curve were mathematically identified; LIP and UIP from PVg were respectively called LIPg and UIPg. From each measurement, the highest regional LIP (LIPrMAX) and the lowest regional UIP (UIPrMIN) were identified and the pressure difference between those two points was defined as
linear driving pressure (ΔPLIN).
Results:A significant difference (p< 0.001) was found between LIPrMAX(15.8 [9.2–21.1] cmH2O) and LIPg
(2.9 [2.2–8.9] cmH2O); in all measurements, the LIPrMAX was higher than the corresponding LIPg. We found a
significant difference (p< 0.005) between UIPrMIN (30.1 [23.5–37.6] cmH2O) and UIPg (40.5 [34.2–45] cmH2O),
the UIPrMIN always being lower than the corresponding UIPg. Median ΔPLIN was 12.6 [7.4–20.8] cmH2O and in
56% of cases was < 14 cmH2O.
Conclusions: Regional inflection points derived by EIT show high variability reflecting lung heterogeneity.
Regional P-V curves obtained by EIT could convey more sensitive information than global lung mechanics on
the pressures within which all lung regions express linear compliance.
Trial registration: Clinicaltrials.gov, NCT02907840. Registered on 20 September 2016.
Keywords: Pressure-volume curve, Electrical impedance tomography, Mechanical ventilation, Acute respiratory failure, acute respiratory distress syndrome, Personalized medicine
© The Author(s). 2019Open Access This article is distributed under the terms of the Creative Commons Attribution 4.0 International License (http://creativecommons.org/licenses/by/4.0/), which permits unrestricted use, distribution, and reproduction in any medium, provided you give appropriate credit to the original author(s) and the source, provide a link to the Creative Commons license, and indicate if changes were made. The Creative Commons Public Domain Dedication waiver (http://creativecommons.org/publicdomain/zero/1.0/) applies to the data made available in this article, unless otherwise stated.
* Correspondence:savinospadaro@gmail.com
1Department of Morphology, Surgery and Experimental Medicine, Intensive Care Unit, University of Ferrara, Azienda Ospedaliera - Universitaria Sant’Anna Hospital, Via Aldo Moro, Ferrara, Italy
Background
Although mechanical ventilation (MV) might be neces-sary to maintain adequate gas exchanges in patients with acute respiratory failure, ventilator-induced lung injury (VILI) can amplify local and systemic inflammation and contribute to disease progression [1–3]. VILI is caused by multiple mechanisms such as high volumes, high pressures, and cyclic opening and closing of the periph-eral airways [4]. Moreover, lungs with patchy infiltrates are heterogeneous and have considerable parenchyma loss of volume available for ventilation [5]. The gravita-tional increasing weight of the parenchyma and the inhomogeneous inflammation process create differences between lung units located in different regions of the lungs, with different distending pressures, dynamic be-havior, and therefore physiologic needs [6, 7]. Informa-tion coming from mechanical respiratory properties assessed through airway pressure (Paw) characterize the global behavior of the lung but possibly cannot identify regional peculiarities.
The pressure-volume (P-V) curve is a respiratory mon-itoring technique that explores changes in the respira-tory system compliance along a wide range of Paw (e.g., between 0 and 40 cmH2O). A P-V curve usually has
sigmoidal shape [8] with two inflection points—the lower (LIP) and the upper (UIP)—and an almost linear part in between. The physiological interpretation of the
P-V curve classically considers the region between the boundaries of the LIP and UIP as safe for mechanical ventilation (i.e., a PEEP level higher than LIP and plateau pressure lower than UIP) to prevent both atelectrauma and barotrauma [9, 10]. However, one can question whether that this approach is able to prevent VILI since it considers the respiratory system as a whole and does not take into account the local mechanical behavior which is influenced by gravity and super-imposed pres-sures [11]. In fact, it is possible that the same airway pressure might overinflate parts of the lung while being harmless for others or that a certain level of positive end-expiratory pressure (PEEP) is able to keep parts of the lung ventilated not being enough for others.
Electrical impedance tomography (EIT) is a radiation-free lung imaging technique, which allows continuous bedside monitoring of the regional mechanical proper-ties by measuring changes in impedance associated with ventilation [12–15]. In the present study, we hypothe-sized that regional P-V curves would provide different information from those obtained from globalP-Vcurves, both in terms of upper and lower inflection points. To confirm this hypothesis, we constructed pressure-volume curves for each pixel row from non-dependent to dependent lung regions of patients affected by acute hyp-oxemic respiratory failure (AHRF) and acute respiratory distress syndrome (ARDS) [16].
Methods
Patient enrollment
We performed a new and additional analysis of data collected during a prospective study carried out in the inten-sive care unit (ICU) of Azienda Ospedaliera Universitaria Sant’Anna (Ferrara, Italy) between December 2015 and October 2016. We enrolled adult patients (aged≥18 years) with AHRF or ARDS, who were deeply sedated and paralyzed as per clinical decision with a ratio of par-tial pressure of oxygen in arterial blood to fraction of inspired oxygen (PaO2/FiO2)≤300 mmHg and clinical
PEEP ≥5 cmH2O. Exclusion criteria were (a) refusal
to participate to the study, (b) pregnancy, (c) pulmon-ary cardiogenic edema, (d) unstable hemodynamics (defined by a systolic arterial pressure of 90 mmHg or less or mean arterial pressure of 60 mmHg or less), (e) pneumothorax, (f) severe chronic obstructive pulmonary disease, (g) impossibility to correctly position the EIT belt (e.g., chest drainage, surgical wound dressings), and (h) contraindications to EIT monitoring (e.g., pacemaker, automatic implantable cardioverter defibrillator). The ethical committee of Ferrara, (protocol no. 141285) Italy, approved the study, and informed consent was obtained following local regulations. At enrollment, we collected demographic and clinical data of each patient.
Patient monitoring
Patients were in supine position, deeply sedated with pro-pofol and morphine, and paralyzed with rocuronium bromide during the study protocol. A heated pneumo-tachograph (Fleisch no. 2, Fleisch, Lausanne, Switzerland) was positioned at the airway opening to record Paw and flow. Volumes were derived by integrating the flow signal. An oblique textile electrode belt with 32 active electrodes was placed around the chest along the 4th and the 6th intercostal space, and EIT recordings were performed using the Swisstom BB2 system (Swisstom, Landquart, Switzerland) [17]. The EIT device selected the dimension of the belt based on the circumference of the patient’s hemithorax and adapted the thorax contour according to the entered height, weight, and gender. Heart rate, arterial pressure, SpO2, and EtCO2were continuously monitored
during the study. Additional details have been published in a previous study [18].
Pressure-volume maneuvers
EachP-Vcurve maneuver was carried out using the con-stant slow-flow inflation technique, as previously described [19]. During the inflation, the pneumotachograph was used to record flow and Paw while the EIT signals were digitally recorded on a dedicated USB drive. The P-V
curves were performed at three different PEEP levels: 5 cmH2O, 10 cmH2O, and 15 cmH2O. At each
parameters (peak pressure, plateau pressure, PEEPtot, respiratory system compliance), obtained by an end-inspiratory and end-expiratory occlusions [18].
Regional pressure-volume curves and data analysis The new analysis was performed only on measurements simultaneously recorded by EIT and pneumotachograph. For each pressure-volume curve maneuver, a global P-V
curve (PVg) was built, plotting Paw versus volume. EIT dynamic images recorded during inflation were analyzed as follows: to obtain regionalP-Vcurves, the impedance change (ΔZ) in the predefined lung region of the dy-namic EIT images was grouped into regions of interest (ROIs), according to the gravitational vector, in a cranio-caudal direction (region 1: non-dependent area, region 1 +n: dependent lung). The analysis was conducted in 19 gravity-dependent regions of interest, each one corre-sponding to a row of pixels. On each ROI, theΔZduring the slow inflation maneuver was plotted against the cor-responding Paw. In this way, we obtained regional P-V
(PVr) curves, one for each ROI [19–22]. To compare different ROIs, both ΔV and ΔZ during the maneuver were normalized to 1. Lower and upper inflection points were estimated by fitting a sigmoidal equation (Eq. 1) into the PVg, as previously described [8].
V¼aþbþe−ðP−cÞ=d ð1Þ
To fit the PVr, we adapted Eq. 1 assuming that
ΔZ=ΔV (Eq. 2); we also limited the values of a and
b to keep their value in a physiological range.
ΔZ¼aþbþe−ðP−cÞ=d ð2Þ
The pressures at which the function rapidly changes slope can be defined from the intersections between a tan-gent to theP-Vcurve at the point of maximal compliance (P=c) and the lower (lower inflection point, LIP) and upper (upper inflection point, UIP) asymptotes, respect-ively. In Eqs.1and2, these points can be obtained as:
LIP¼c−2d
UIP¼cþ2d
From each measurement, we therefore obtained the following data:
One fitted equation for the PVg and n equations for the PVr (n =number of ROIs). From each equation, we obtained global (global UIP = UIPg; global LIP = LIPg) and regional inflection points (regional UIP = UIPr; regional LIP = LIPr)
The difference in each ROI between the UIPr and LIPr, defined as regional range of linear
compliance (RLC)
The minimum UIPr, corresponding to the lowest level of pressure linked to the disappearance of the linear part of the corresponding PVr, defined as UIPrMIN
The maximum LIPr, corresponding to the highest level of pressure linked to the start of the linear part of the corresponding PVr, defined as LIPrMAX The average of UIPr for each measurement
(UIPrAVE)
The average of LIPr for each measurement (LIPrAVE)
The pressure difference between the LIPrMAXand
the UIPrMINwas defined as linear driving pressure
(ΔPLIN); this value corresponds to a pressure
interval in which every PVr is on its linear part
The regional P-V curves were considered valid if the quality of the fittingR2> 0.9. Measurements with negative inflection points were considered invalid. An illustrative analysis of one measurement from a representative patient is shown in Fig.1.
Statistics
Data are presented as median and interquartile range (IQR). Wilcoxon matched-pairs signed rank test was used to evaluate differences between paired data. Mann-Whitney test was used to compare unpaired groups of data. Statis-tical analyses were performed using SPSS 20.0 statisStatis-tical software (IBM, Armonk, NY, USA) and GraphPad Prism 6 for Windows (GraphPad Software, La Jolla, CA, USA,
www.graphpad.com). In all statistical analyses, a two-tailed test was performed and thepvalue equal or less than 0.05 was considered statistically significant.
Results
Patients’characteristics and analysis
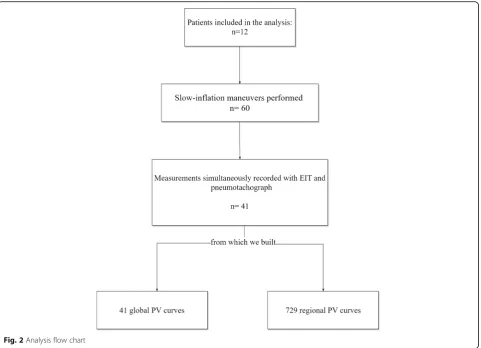
Patients’ characteristics are summarized in Table 1. Of note, 5/12 (42%) had ARDS. Forty-one measurements from 12 patients were considered of sufficient technical quality for the analysis. The PaO2/FiO2 at enrollment
was 218 [170–262] cmH2O, and the median clinical
PEEP used was 7.5 cmH2O. From the 41 measurements,
we built 729 PVr and 41 PVg (Fig.2).
Regional and global lower inflection points
A valid LIPg was found in 37% of measurements; its median value was 2.9 [2.2–8.9] cmH2O. LIPr values
LIPrMAX was in the last five most dependent ROIs in
77% of measurements (Fig.4).
Regional and global upper inflection points
The median UIPg value was 40.5 [34.2–45] cmH2O. A
statistically significant difference was found between UIPg and UIPrMIN(30.1 [23.5–37.6] cmH2O;p< 0.05),
with UIPrMINlocated in the four most non-dependent
regions in 55% of measurements (Fig. 4). A supple-mental analysis, based on the level of PEEP, can be found in the supplemental digital content (Add-itional file1: Table S1).
Regional linear driving pressure
The pressure interval between LIPrMAX and UIPrMIN
(ΔPrLIN; Fig. 1) was 12.6 [7.4–20.8] cmH2O (Fig. 3). In
56% of measurements, ΔPrLIN was lower than 14
cmH2O. The pressure interval between each regional
LIPr and UIPr (RLC) is reported in Additional file 2: Figure S1; we found a high variability in this value, which was higher in the central lung and lower in both the most dependent and the non-dependent lung.
Discussion
The main results of this study are as follows: (1) The global P-V and the regional P-V curves do not pro-vide the same information, and inflection points of the global P-V curve are different from those of the PVr (i.e., higher LIP and lower UIP); (2) the analysis of the regionalP-Vcurves allows to detect the heterogen-eity of the inflection points of the different lung regions;
regional inflection points are gravity dependent with UIPrMIN located in the most non-dependent lung and
LIPrMAX in the most dependent; (3) the “safe” limit
of pressure between LIPrMAX and UIPrMIN was
re-duced compared to the one obtained by global P-V
curve (Table 2).
Different attempts have been made in the last 30 years for use of theP-Vcurve of the respiratory system to set mechanical ventilation [9, 10]. The inflection points of this curve express changes in compliance, reflecting a rise in ventilated alveolar units—due to alveolar recruit-ment or airway opening or both, or a pressure that ex-ceed intrinsic PEEP—(for LIP) and the overstretching of already ventilated lung (for UIP). Hence, setting mech-anical ventilation in the linear part of the curve between these two points could be protective against both intra-tidal alveolar opening and closing (atelectrauma) and overinflation (barotrauma/volutrauma). Despite the physiological background, this approach considers the lung as a homogenous mono-compartimental system without taking the entity of regional inflammation [23] and the gravitational superimposed pressure on each re-gion into account [11].
On the one hand, the LIP of the global P-Vcurve has been classically considered the critical opening pressure at which alveoli start to open or to be fully recruited but this concept has recently been questioned. A mathemat-ical model of ARDS [24] and CT scans on patients af-fected by ALI/ARDS [25] showed that recruitment of new units occurs also beyond the LIP, influencing the slope of the P-V curve. Moreover, alveolar opening
Fig. 1Example of regional pressure-volume curves. A slow inflation maneuver was recorded simultaneously using electrical impedance
[image:4.595.58.539.88.321.2]pressure (i.e., recruitment) is not a fixed threshold but a continuous range of pressure, progressively increas-ing from the non-dependent to the dependent lung. Finally, LIP could represent reversal of airway closure rather than alveolar recruitment [26]. We confirmed these findings since we found a gradient of regional lower inflection points from the non-dependent to the dependent lung: moving toward the vertebral-dependent lung, the LIPr increases, probably as an effect of the highest alveolar (or small airways pressure) pressure needed to overcome the resultant superimposed pres-sure (Fig. 3). Moreover, we found a significant differ-ence between the LIPg, the regional minimum LIP (LIPrMIN), and the LIPr in the most non-dependent
lung (ROIs 1, 2, 3). Therefore, the LIP on the global
P-V curve may express the behavior of the uppermost compartment that receives air at the beginning of in-flation, as already suggested by Hickling using a mathematical model [24]. This would, however, imply that information about the LIPr in the central and dependent lung is not adequately reflected by the glo-bal P-V curve. Since the dependent lung is the region most affected by intra-tidal recruitment and airway closure due to the higher pressure needed to start
inflation, using the global LIP—that expresses the be-havior of the non-dependent lung—to set PEEP would leave large dependent regions prone to atelectrauma. Our data show that the minimal pressure needed to ventilate above all regional LIP (LIPrMAX) was 15.8
[9.25–21.1] cmH2O, a value much higher than that
derived from the LIPg. If we hypothesize that the ideal ventilation should occur on the linear part of each regional P-Vcurve and that the starting point of the respiratory cycle is PEEP, then LIPg would under-estimate the value to achieve this target.
On the other hand, alveolar overdistension leads to compression of pulmonary vessels and capillaries, disruption of alveolar epithelium, and physical breaks in endothelial plasma membranes [27] triggering the proinflammatory signaling cascade which results in inflammation, edema, and cell death [28]. Titrate tidal volume to keep a plateau pressure below the “overdistension threshold” can be useful to avoid lung inflammation.
Amato et al. [10] found a massive reduction of 28-day mortality (38% vs 71%) in patients ventilated with low tidal volumes (6 ml/kg/PBW); this finding was later con-firmed by large-scale RCTs [29] and meta-analysis [30]
[image:6.595.59.541.87.435.2]proposing low tidal volume ventilation as the standard of care. Despite this potential advantage, PBW is not an accurate index of the actual lung size since it does not express the dimension of the baby lung [5, 31]. The upper inflection point is considered the beginning of lung overstretch and, ideally, could be used to ti-trate indirectly TV on the lung size. Roupie et al. [9] found that, in a ventilation based on a TV = 10 ml/kg, in 80% of the studied population the TV needed to be reduced to 7.8 ± 0.9 ml/kg to obtain a Pplat below the UIP. We found that UIPg was not able to highlight the regional overstretch since UIPg differed from UIPrMIN,
a value that corresponds to the lowest pressure at which regional overinflation starts. Moreover, UIPg was different from UIPr in the non-dependent lung (Fig.3); using the UIPg to limit pressure can therefore underestimate the potential damage on this region.
In our population, UIPrMIN was 30.1 [23.5–37.6]
cmH2O, not far from the suggested as protective
Pplat threshold found in AHRF patients affected by sepsis [32, 33]. In addition, a recent multilevel medi-ation analysis on 3562 ARDS patients showed that a reduction of Pplat < 30 H2O could not further
im-prove survival rate. It is important to underline that in our population the range was wide, from a mini-mum of 13.9 cmH2O to a maximum of 49.7 cmH2O,
being below 30 cmH2O in 44% of measurements. A
fixed value, 30 cmH2O in this case, cannot represent
therefore the universal safe number, suggesting that a tailored safe threshold should be set based on the pa-tient’s characteristics.
In this analysis, we introduced two variables: LIPrMAX—
the minimal pressure able to overcome all regional lower inflection points—and UIPrMIN—the maximal pressure
to avoid a ventilation above all regional upper inflec-tion points. We hypothesize that LIPrMAX can be
helpful in setting PEEP while UIPrMINcan represent a
pressure limit to avoid regional overstretch.
Recently, respiratory driving pressure (DP) has been found to predict mortality in ARDS patients [34] and a titration of TV on DP has been suggested to reduce VILI [35, 36]. The connection between DP and over-distension has been furthermore confirmed by a CT scan study on humans [37]. In the current analysis, we introduced a new variable: ΔPLIN. Its value reflects the maximal pressure range which avoids regional overinflation and derecruitment, thereby allowing a ventilation simultaneously above every regional LIP and below every regional UIP. ΔPLIN expresses,
there-fore, individual threshold pressures, above which VILI might occur. In our study population, although mean
ΔPLIN was 12.6 [7.4–20.8] cmH2O and therefore close
to the value defined as protective in a recent pro-spective study [38], in 56% of the cases, it was below
Fig. 3Results: regional and global inflection points. Regional inflection points are in gravitational order (row 1 = most non-dependent; row 19 =
[image:7.595.61.538.87.357.2]14 cmH2O, the limit value of driving pressure
sug-gested by Amato et al. [34]. This indicates that, in some patients, a driving pressure threshold of 14 cmH2O,
despite generally considered protective, would be slightly too high in order to prevent regional damage (Fig.4).
Our results underline that the traditional P-V
curve could give partial information on the way pa-tients should be ventilated. The linear part of
pressure-volume relationship does not pertain to all lung regions, being instead a compromise between the mechanical characteristics of the dependent and not dependent part of the lung. Since it is funda-mental to select the correct amount of PEEP to limit atelectrauma, while avoiding overcoming the UIP to limit overdistension, patients could be ventilated in the linear portion of the P-V curves taking into
Fig. 4Results: comparison between regionally derived parameters, global inflection points, and location of LIPrMAXand UIPrMIN.aValues
[image:8.595.59.536.88.564.2]account all lung regions. We were able to find this linearity in the entire lung regions by simply using the maximal LIP and the minimal UIP. LIP and UIP exhibited a huge variability among patients, under-lining that mechanical ventilation must be personal-ized. It is tempting to say that the analysis of the regional P-Vcurves could help in achieving this goal. In particular, it remains to be elucidated whether the VT associated with linear regional DP is able to con-trol CO2 and if this new approach could lead to a
novel indication for extracorporeal lung assist [39]. Our study has several limitations. Firstly, we per-formed only inspiratory pressure-volume curve, as it is the most used for evaluating the variability of the com-pliance of the respiratory system. Alternatively, a phys-ician could examine the expiratory limb of the curve to evaluate closure pressure. However, we decided to use the same methodology used in a RCT to set PEEP using the P-Vcurve [10]. Secondly, the study population con-sisted of a limited number of patients with heteroge-neous diseases; therefore, no inferences on the patient outcome can be derived from our data. Thirdly, we did not measure transpulmonary pressure: this tool would have been useful to distinguish between the respiratory system and lung regional inflection points. Fourthly, the lack of randomization of PEEP levels and the return to zero pressure at the end of each step could have influ-enced the results of this study [18].
Conclusions
Regional inflection points derived by EIT show high vari-ability, reflecting the heterogeneity of the lung. Regional
P-Vcurves obtained by EIT could convey more sensitive information than global lung mechanics on pressures within which all lung regions express linear compliance. Future studies will explore if setting mechanical ventila-tion based on regional P-Vcurves could impact on pa-tients’outcome.
Additional files
Additional file 1:Regional inflection points from pressure-volume curves assessed by electrical impedance tomography as a guide to mechanical ventilation. Supplemental digital content. Additional results; Table S1.LIPg, UIPg, LIPrMAX, UIPrMIN, andΔPLINat the 3 different levels of PEEP. (DOCX 16 kb)
Additional file 2:Figure S1.Ventrodorsal distribution of the regional difference between LIPr and UIPr. Regional differences between LIPr and UIPr in the different regions of interests (ROI); ROI1 = non-dependent; ROI1 + n = dependent lung. Values expressed as median [IQR]. (JPG 257 kb)
Abbreviations
ΔV:Variation of volume;ΔZ: Variation of impedance; AHRF: Acute hypoxic respiratory failure; ARDS: Acute respiratory distress syndrome; CT: Computed tomography; DP: Driving pressure; EIT: Electrical impedance tomography; EtCO2: End tidal CO2; FiO2: Inspiratory fraction of oxygen; ICU: Intensive care unit; IQR: Interquartile range; LIP: Lower inflection point; LIPrMAX: Regional maximal lower inflection point; MV: Mechanical ventilation; PaO2: Arterial partial pressure of oxygen; Paw: Airway opening pressure; PBW: Predicted body weight; PEEP: Positive end-expiratory pressure; PEEPtot: Total PEEP; Pplat: Plateau pressure;P-V: Pressure-volume; PVg: Global pressure-volume; PVr: Regional pressure-volume; RCT: Randomized controlled trial;
RLC: Regional range of linear compliance; ROI: Region of interest; SpO2: Peripheral oxygen saturation; UIP: Upper inflection point;
UIPrMIN: Regional minimum upper inflection point; USB: Universal serial bus; VILI: Ventilator-induced lung injury; VT: Tidal volume;ΔPLIN: Regional linear driving pressure
Acknowledgements
We thank the nursing and medical staff of the intensive care unit at Sant’Anna Hospital, Ferrara, Italy.
Funding
The present study was supported by institutional funding of the Department of Morphology, Surgery and Experimental Medicine, Section of Anesthesia and Intensive Care, University of Ferrara, Italy. The company Swisstom AG supported the study by granting use of an electrical impedance tomography system free of charge but it had no role in study conception, design and completion.
Availability of data and materials
The datasets used and/or analyzed during the current study are available from the corresponding author on reasonable request.
Authors’contributions
GS, SS, and CAV conceived of and coordinated the study, participated in its design, and helped to draft and review the manuscript. TM contributed to the interpretation of the data and was involved in revising the manuscript. GS, SS, RR, and EM contributed to the analysis and interpretation of the data and were involved in revising the manuscript. SHB and ADW contributed technical help during data analysis and revision of the final manuscript. GS and SS performed the statistical analysis and helped to carry out the data analysis. EM and ES reviewed the manuscript constructively. All authors meet all authorship requirements of the International Committee of Medical Journal Editors. All authors read and approved the final manuscript.
Ethics approval and consent to participate
This manuscript is a secondary analysis of data coming from a prospective trial. The study was approved by the ethics committee of the Sant’Anna Hospital, Ferrara, Italy (Protocol n. 141285).
Consent for publication
Written informed consent was obtained from the patients or their relatives for publication of their individual details. The consent forms are help by the authors and are available for review by the editor-in-chief of this journal.
Competing interests
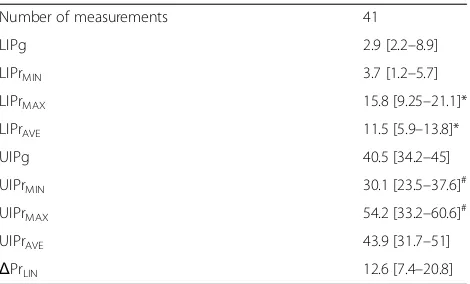
[image:9.595.57.292.97.239.2]The authors declare that they have no competing interests. Table 2Results
Number of measurements 41
LIPg 2.9 [2.2–8.9]
LIPrMIN 3.7 [1.2–5.7]
LIPrMAX 15.8 [9.25–21.1]*
LIPrAVE 11.5 [5.9–13.8]*
UIPg 40.5 [34.2–45]
UIPrMIN 30.1 [23.5–37.6]
#
UIPrMAX 54.2 [33.2–60.6]
#
UIPrAVE 43.9 [31.7–51]
ΔPrLIN 12.6 [7.4–20.8]
Data expressed as median [IQR]. Mann-Whitney test (unpairedttest) *Different from LIPg (p< 0.01)
#
Publisher’s Note
Springer Nature remains neutral with regard to jurisdictional claims in published maps and institutional affiliations.
Author details
1Department of Morphology, Surgery and Experimental Medicine, Intensive Care Unit, University of Ferrara, Azienda Ospedaliera - Universitaria Sant’Anna Hospital, Via Aldo Moro, Ferrara, Italy.2Department of Anesthesiology and Intensive Care Medicine, Rostock University Medical Center, Rostock, Germany.3Department of Anesthesia, Critical Care and Emergency, Fondazione IRCCS (Istituto di Ricovero e Cura a Carattere Scientifico) Ca’ Granda, University of Milan, Milan, Italy.
Received: 27 November 2018 Accepted: 1 April 2019
References
1. Brochard L, Slutsky A, Pesenti A. Mechanical ventilation to minimize progression of lung injury in acute respiratory failure. Am J Respir Crit Care Med. 2017;195(4):438–42.https://doi.org/10.1164/rccm.201605-1081CP. 2. Webb HH, Tierney DF. Experimental pulmonary edema due to intermittent
positive pressure ventilation with high inflation pressures. Protection by positive end-expiratory pressure. Am Rev Respir Dis. 1974;110:556–65.
https://doi.org/10.1164/arrd.1974.110.5.556.
3. Spadaro S, Park M, Turrini C, Tunstall T, Thwaites R, Mauri T. Biomarkers for acute respiratory distress syndrome and prospects for personalised medicine. J Inflamm (Lond). 2019;16:1.
4. Tonetti T, Cressoni M, Collino F, Maiolo G, Rapetti F, Quintel M, et al. Volutrauma, atelectrauma, and mechanical power. Crit Care Med. 2017;45: e327–8.https://doi.org/10.1097/CCM.0000000000002193.
5. Gattinoni L, Pesenti A. The concept of“baby lung”. Intensive Care Med. 2005;31:776–84.https://doi.org/10.1007/s00134-005-2627-z.
6. Grasso S, Stripoli T, Sacchi M, Trerotoli P, Staffieri F, Franchini D, et al. Inhomogeneity of lung parenchyma during the open lung strategy: a computed tomography scan study. Am J Respir Crit Care Med. 2009;180(5): 415–23.https://doi.org/10.1164/rccm.200901-0156OC.
7. Silva PL, Gama de Abreu M. Regional distribution of transpulmonary pressure. Ann Transl Med. 2018;6:385.https://doi.org/10.21037/atm.2018.10.03. 8. Venegas JG, Harris RS, Simon BA. A comprehensive equation for the
pulmonary pressure-volume curve. J Appl Physiol (1985). 1998;84:389–95.
https://doi.org/10.1152/jappl.1998.84.1.389.
9. Roupie E, Dambrosio M, Servillo G, Mentec H, el Atrous S, Beydon L, et al. Titration of tidal volume and induced hypercapnia in acute respiratory distress syndrome. Am J Respir Crit Care Med. 1995;152:121–8.https://doi. org/10.1164/ajrccm.152.1.7599810.
10. Amato MBP, Barbas CSV, Medeiros DM, Magaldi RB, Schettino GP, Lorenzi-Filho G, et al. Effect of a protective-ventilation strategy on mortality in the acute respiratory distress syndrome. N Engl J Med. 1998;338:347–54.https:// doi.org/10.1056/NEJM199802053380602.
11. Pellegrini M, Derosa S, Tannoia A, Rylander C, Fiore T, Larsson A, et al. Effects of superimposed tissue weight on regional compliance of injured lungs. Respir Physiol Neurobiol. 2016;228:16–24.https://doi.org/10.1016/j.resp.2016.03.005. 12. Victorino JA, Borges JB, Okamoto VN, Matos GFJ, Tucci MR, Caramez MPR, et
al. Imbalances in regional lung ventilation: a validation study on electrical impedance tomography. Am J Respir Crit Care Med. 2004;169:791–800.
https://doi.org/10.1164/rccm.200301-133OC.
13. Santini A, Spinelli E, Langer T, Spadaro S, Grasselli G, Mauri T. Thoracic electrical impedance tomography: an adaptive monitor for dynamic organs. J Emerg Crit Care Med. 2018;2:1-11.
14. Mauri T, Turrini C, Eronia N, Grasselli G, Volta CA, Bellani G, et al. Physiologic effects of high-flow nasal cannula in acute hypoxemic respiratory failure. Am J Respir Crit Care Med. 2017;195:1207–15.https://doi.org/10.1164/rccm. 201605-0916OC.
15. Mauri T, Eronia N, Abbruzzese C, Marcolin R, Coppadoro A, Spadaro S, et al. Effects of sigh on regional lung strain and ventilation heterogeneity in acute respiratory failure patients undergoing assisted mechanical ventilation. Crit Care Med. 2015;43:1823–31.https://doi.org/10.1097/CCM.0000000000001083. 16. Definition Task Force ARDS, Ranieri VM, Rubenfeld GD, Thompson BT,
Ferguson ND, Caldwell E, et al. Acute respiratory distress syndrome: the Berlin definition. JAMA. 2012;307:2526–33.https://doi.org/10.1001/jama.2012.5669.
17. Waldmann AD, Wodack KH, März A, Ukere A, Trepte CJ, Böhm SH, Reuter DA. Performance of novel patient interface for electrical impedance tomography applications. J Med Biol Eng. 2017;37:561–6.
18. Spadaro S, Mauri T, Böhm SH, Scaramuzzo G, Turrini C, Waldmann AD, et al. Variation of poorly ventilated lung units (silent spaces) measured by electrical impedance tomography to dynamically assess recruitment. Crit Care. 2018;22:26.https://doi.org/10.1186/s13054-017-1931-7.
19. Ranieri VM, Giuliani R, Fiore T, Dambrosio M, Milic-Emili J. Volume-pressure curve of the respiratory system predicts effects of PEEP in ARDS:“occlusion” versus“constant flow”technique. Am J Respir Crit Care Med. 1994;149:19– 27.https://doi.org/10.1164/ajrccm/149.2_Pt_2.S19.
20. Kunst PW, Böhm SH, Vazquez de Anda G, Amato MB, Lachmann B, Postmus PE, et al. Regional pressure volume curves by electrical impedance tomography in a model of acute lung injury. Crit Care Med. 2000;28:178–83. 21. Hinz J, Moerer O, Neumann P, Dudykevych T, Frerichs I, Hellige G, et al.
Regional pulmonary pressure volume curves in mechanically ventilated patients with acute respiratory failure measured by electrical impedance tomography. Acta Anaesthesiol Scand. 2006;50:331–9.https://doi.org/10. 1111/j.1399-6576.2006.00958.x.
22. Beda A, Carvalho AR, Carvalho NC, Hammermüller S, Amato MBP, Muders T, et al. Mapping regional differences of local pressure-volume curves with electrical impedance tomography. Crit Care Med. 2017;45:679–86.https:// doi.org/10.1097/CCM.0000000000002233.
23. Retamal J, Hurtado D, Villarroel N, Bruhn A, Bugedo G, Amato MBP, et al. Does regional lung strain correlate with regional inflammation in acute respiratory distress syndrome during nonprotective ventilation? An experimental porcine study. Crit Care Med. 2018;46:e591–9.https://doi.org/ 10.1097/CCM.0000000000003072.
24. Hickling KG. The pressure-volume curve is greatly modified by recruitment. A mathematical model of ARDS lungs. Am J Respir Crit Care Med. 1998;158: 194–202.https://doi.org/10.1164/ajrccm.158.1.9708049.
25. Crotti S, Mascheroni D, Caironi P, Pelosi P, Ronzoni G, Mondino M, et al. Recruitment and derecruitment during acute respiratory failure: a clinical study. Am J Respir Crit Care Med. 2001;164:131–40.https://doi.org/10.1164/ ajrccm.164.1.2007011.
26. Jain M, Sznajder JI. Bench-to-bedside review: distal airways in acute respiratory distress syndrome. Crit Care Lond Engl. 2007;11:206.https://doi. org/10.1186/cc5159.
27. Vlahakis NE, Hubmayr RD. Cellular stress failure in ventilator-injured lungs. Am J Respir Crit Care Med. 2005;171:1328–42.https://doi.org/10.1164/rccm. 200408-1036SO.
28. Ridge KM, Linz L, Flitney FW, Kuczmarski ER, Chou Y-H, Omary MB, et al. Keratin 8 phosphorylation by protein kinase C delta regulates shear stress-mediated disassembly of keratin intermediate filaments in alveolar epithelial cells. J Biol Chem. 2005;280:30400–5.https://doi.org/10.1074/jbc.
M504239200.
29. Acute Respiratory Distress Syndrome Network, Brower RG, Matthay MA, Morris A, Schoenfeld D, Thompson BT, et al. Ventilation with lower tidal volumes as compared with traditional tidal volumes for acute lung injury and the acute respiratory distress syndrome. N Engl J Med. 2000;342:1301–8.
https://doi.org/10.1056/NEJM200005043421801.
30. Petrucci N, De Feo C. Lung protective ventilation strategy for the acute respiratory distress syndrome. Cochrane Database Syst Rev. 2013:CD003844.
https://doi.org/10.1002/14651858.CD003844.pub4.
31. Umbrello M, Marino A, Chiumello D. Tidal volume in acute respiratory distress syndrome: how best to select it. Ann Transl Med. 2017;5.https://doi. org/10.21037/atm.2017.06.51.
32. Martin-Loeches I, de Haro C, Dellinger RP, Ferrer R, Phillips GS, Levy MM, et al. Effectiveness of an inspiratory pressure-limited approach to mechanical ventilation in septic patients. Eur Respir J. 2013;41:157–64.https://doi.org/10. 1183/09031936.00221611.
33. Slutsky AS. Consensus conference on mechanical ventilation--January 28-30, 1993 at Northbrook, Illinois, USA. Part I. European Society of Intensive Care Medicine, the ACCP and the SCCM. Intensive Care Med. 1994;20(1):64–79. 34. Amato MBP, Meade MO, Slutsky AS, Brochard L, Costa ELV, Schoenfeld DA,
et al. Driving pressure and survival in the acute respiratory distress syndrome. N Engl J Med. 2015;372:747–55.https://doi.org/10.1056/ NEJMsa1410639.
36. Pelosi P, Ball L. Should we titrate ventilation based on driving pressure? Maybe not in the way we would expect. Ann Transl Med. 2018;6(19):389.
https://doi.org/10.21037/atm.2018.09.48.
37. Chiumello D, Carlesso E, Brioni M, Cressoni M. Airway driving pressure and lung stress in ARDS patients. Crit Care. 2016;20:276.https://doi.org/10.1186/ s13054-016-1446-7.
38. Bellani G, Laffey JG, Pham T, Fan E, Brochard L, Esteban A, et al. Epidemiology, patterns of care, and mortality for patients with acute respiratory distress syndrome in intensive care units in 50 countries. JAMA. 2016;315:788–800.https://doi.org/10.1001/jama.2016.0291.