R E S E A R C H
Open Access
A novel non-invasive method to detect
excessively high respiratory effort and
dynamic transpulmonary driving pressure
during mechanical ventilation
Michele Bertoni
1,2, Irene Telias
3,4, Martin Urner
3,5, Michael Long
6, Lorenzo Del Sorbo
3,5, Eddy Fan
3,5,7,
Christer Sinderby
3,4, Jennifer Beck
3,4, Ling Liu
8, Haibo Qiu
8, Jenna Wong
5, Arthur S. Slutsky
3,4,
Niall D. Ferguson
3,5,7,9,10, Laurent J. Brochard
3,4and Ewan C. Goligher
3,5,10,11*Abstract
Background:Excessive respiratory muscle effort during mechanical ventilation may cause patient self-inflicted lung injury and load-induced diaphragm myotrauma, but there are no non-invasive methods to reliably detect elevated transpulmonary driving pressure and elevated respiratory muscle effort during assisted ventilation. We hypothesized that the swing in airway pressure generated by respiratory muscle effort under assisted ventilation when the airway is briefly occluded (ΔPocc) could be used as a highly feasible non-invasive technique to screen for these conditions. Methods:Respiratory muscle pressure (Pmus), dynamic transpulmonary driving pressure (ΔPL,dyn, the difference
between peak and end-expiratory transpulmonary pressure), andΔPoccwere measured daily in mechanically
ventilated patients in two ICUs in Toronto, Canada. A conversion factor to predictΔPL,dynandPmusfromΔPoccwas
derived and validated using cross-validation. External validity was assessed in an independent cohort (Nanjing, China).
Results:Fifty-two daily recordings were collected in 16 patients. In this sample,PmusandΔPLwere frequently
excessively high:Pmusexceeded 10 cm H2O on 84% of study days andΔPL,dynexceeded 15 cm H2O on 53% of
study days.ΔPoccmeasurements accurately detectedPmus> 10 cm H2O (AUROC 0.92, 95% CI 0.83–0.97) and ΔPL,dyn> 15 cm H2O (AUROC 0.93, 95% CI 0.86–0.99). In the external validation cohort (n= 12), estimatingPmusand ΔPL,dynfromΔPoccmeasurements detected excessively highPmusandΔPL,dynwith similar accuracy (AUROC≥0.94). Conclusions:MeasuringΔPoccenables accurate non-invasive detection of elevated respiratory muscle pressure and
transpulmonary driving pressure. Excessive respiratory effort and transpulmonary driving pressure may be frequent in spontaneously breathing ventilated patients.
Keywords:Mechanical ventilation, Artificial respiration, Acute lung injury, Myotrauma, Respiratory monitoring
© The Author(s). 2019Open AccessThis article is distributed under the terms of the Creative Commons Attribution 4.0 International License (http://creativecommons.org/licenses/by/4.0/), which permits unrestricted use, distribution, and reproduction in any medium, provided you give appropriate credit to the original author(s) and the source, provide a link to the Creative Commons license, and indicate if changes were made. The Creative Commons Public Domain Dedication waiver (http://creativecommons.org/publicdomain/zero/1.0/) applies to the data made available in this article, unless otherwise stated.
* Correspondence:ewan.goligher@utoronto.ca 3
Interdepartmental Division of Critical Care Medicine, University of Toronto, Toronto, Canada
5Division of Respirology, Department of Medicine, University Health Network
and University of Toronto, Toronto, Canada
Introduction
Patient inspiratory effort during mechanical ventilation may have both beneficial and deleterious effects. Inspira-tory effort increases tidal volume and global dynamic lung stress (quantified by transpulmonary driving pressure,
ΔPL) in pressure-targeted modes of ventilation, potentially
leading to lung injury. Vigorous inspiratory efforts can generate pendelluft and amplify regional lung stress and strain, causing regional lung injury even in volume-cycled modes of ventilation [1,2]. The amplitude of this regional stress is reflected by the dynamic transpulmonary driving pressure, ΔPL,dyn [3]. Excess diaphragmatic loading may
impair systemic oxygen delivery and cause diaphragm muscle injury [4,5]. The level of inspiratory effort during the first 3 days of ventilation was recently shown to pre-dict the duration of ventilation and ICU admission [6]. Respiratory drive and effort are frequently elevated in patients with respiratory failure because of pain, anxiety, delirium, inadequate ventilatory assistance, and dyspnea [7,8]. Therefore, patient inspiratory effort merits close at-tention during mechanical ventilation.
Inspiratory effort (quantified by respiratory muscle pres-sure, Pmus) is not routinely monitored during mechanical
ventilation. Although several monitoring techniques are available (e.g., esophageal manometry [9], diaphragm elec-trical activity (Edi) [10], diaphragm ultrasound [11]), they require appropriate equipment, proficiency, and time, making it difficult for busy clinicians to assess inspiratory effort as part of routine respiratory monitoring. P0.1 is a
simple and widely available method for estimating respira-tory drive during mechanical ventilation [12], but it pro-vides little information about the magnitude of dynamic lung stress generated by the combined effects of the venti-lator and patient respiratory effort. Plateau pressure and driving pressure are used to detect excess lung stress during controlled mechanical ventilation [13], but these measurements may not be reliable in the presence of in-spiratory effort as they can underestimate the true magni-tude of stress and strain applied to the lung both globally and regionally [14]. Moreover, these measurements repre-sent the total elastic pressure of the respiratory system (combining the lung and the chest wall); elevated values therefore do not necessarily entail excess lung stress when chest wall elastance is increased. A rapid and non-invasive technique for detecting excess respiratory effort and dy-namic lung stress would substantially increase the feasibil-ity of detecting injurious spontaneous breathing during mechanical ventilation.
During a randomly applied end-expiratory airway occlu-sion on the ventilator, the airway pressure deflection gener-ated by the patient’s respiratory effort against the occluded airway (ΔPocc) is correlated with the pressure generated by
the respiratory muscles to expand the lungs and chest wall during mechanically assisted breaths because a single
end-expiratory occlusion does not alter respiratory drive [15]. Hence,ΔPoccmay provide a non-invasive means of
detect-ing excessive inspiratory effort and dynamic lung stress during assisted mechanical ventilation.
We hypothesized that excessive patient inspiratory ef-fort (Pmus) and excessive dynamic lung stress (ΔPL,dyn)
could be detected rapidly and non-invasively by measur-ingΔPocc.
Methods
This study was conducted in two medical-surgical inten-sive care units at the University Health Network, Toronto, Canada. The findings presented in this paper represent an
ancillary analysis on an ongoing clinical study
(MYOTRAUMA, ClinicalTrials.gov NCT03108118)
char-acterizing diaphragm activity and function longitudinally during mechanical ventilation. Informed consent was ob-tained from substitute decision makers prior to enrolment. If no substitute decision maker was available, eligible pa-tients were enrolled by deferred consent and consent for the use of study data was obtained from study participants once they regained capacity. The Research Ethics Board at University Health Network approved the study protocols, and the study was performed in accordance with the eth-ical standards laid down in the 2008 Declaration of Helsinki. The study findings were validated in a dataset collected from a previously published cohort of patients in China [16].
Study subjects
Patients were enrolled in the MYOTRAUMA study if they were intubated for fewer than 36 h and if the reason for intubation was one of acute brain injury (i.e., stroke or traumatic brain injury), acute respiratory distress syn-drome (ARDS), septic shock, or pneumonia. Patients were excluded if they were deemed unlikely to remain on the ventilator for at least 7 days, if there was a contra-indication to esophageal catheterization (recent upper GI surgery, bleeding varices), or if they had a concomi-tant acute exacerbation of obstructive airways disease. Recordings obtained in MYOTRAUMA study subjects were included from days when the subjects were breath-ing spontaneously (triggerbreath-ing the ventilator).
Study protocol
Study methods are detailed in an online supplement (see Additional file 1). Flow, airway pressure (Paw),
esopha-geal pressure (Pes), and diaphragm electrical activity (Edi)
deflection in Paw from PEEP during each occlusion
was recorded as a measurement of occlusion pressure (ΔPocc) (note: not to be confused with the airway
oc-clusion pressure at 100 milliseconds after the onset of inspiration, P0.1).
Signal analysis
Transpulmonary pressure (PL) was measured by real-time
digital subtraction ofPesfromPaw. The airway driving
pres-sure (ΔPaw,dyn) was quantified as the difference between
peak Paw and PEEP. The dynamic transpulmonary
driv-ing pressure (ΔPL,dyn) was quantified for each breath as the
increase inPLfrom onset to peak during inspiration. Chest
wall elastic recoil pressure at end-inspiration (Pcw) was
esti-mated for each breath from the product of tidal volume
and the empirically estimated chest wall elastance (see Additional file 1, Additional file 2, Additional file 3, Additional file4, and Additional file5). The pressure gen-erated by the respiratory muscles during inspiration (Pmus)
(i.e., the pressure that expands the lung and chest wall dur-ing inspiration) was quantified for each breath as the peak
difference between Pcw and Pes during inspiration.
Pressure-time product of Pmus per breath (PTPmus)—the
reference standard for quantifying inspiratory effort [17]—was computed from Pcw and the integral of Pes
during inspiration (see Additional file1, Additional file2, Additional file3, Additional file4, and Additional file5).
To avoid measurement error due to inaccuratePes
mea-surements, recordings where the ratio of ΔPocc/ΔPes was
greater than 1.3 or less than 0.7 were excluded from analysis.
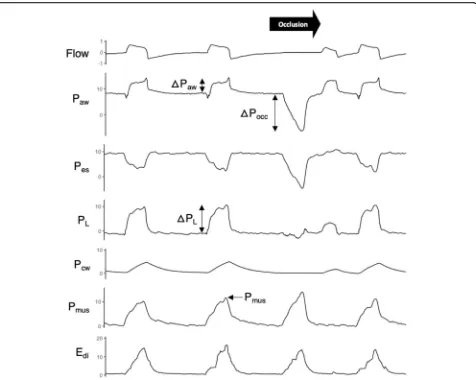
Fig. 1Representative tracings obtained during the airway occlusion maneuver. Flow, airway pressure (Paw), esophageal pressure (Pes), and
diaphragm electrical activity (Edi) were recorded while a one-way end-expiratory occlusion permitting expiratory flow but not inspiratory flow
(black arrow) was applied at a random interval. Transpulmonary pressure (PL), obtained by digital subtraction ofPesfromPaw, signifies the
dynamic stress applied to the lung. Chest wall elastic recoil pressure (ΔPcw) was estimated by multiplying tidal volume by predicted chest wall
elastance. Inspiratory effort was quantified by the peak inspiratory muscle pressure,Pmus, estimated as the difference betweenΔPcwandΔPes
[image:3.595.61.537.86.466.2]Defining excessivePmusandΔPL
Thresholds defining excessive Pmus and ΔPL,dyn were
se-lected a priori based on available physiological and clinical observations (see Additional file1 for detailed rationale).
Pmus normally ranges between 4 and 10 cm H2O, and
ΔPL,dyn normally ranges between 4 and 8 cm H2O [18–
20]. Given some uncertainty in the optimal definitions for excessive Pmus and ΔPL,dyn, discriminative accuracy was
assessed for two different possible definitions of “ exces-sive”values: forPmus, 10 cm H2O and 15 cm H2O, and for
ΔPL,dyn, 15 cm H2O and 20 cm H2O.
Statistical analysis
The goal of the analysis was to determine whetherΔPocc
measured during airway occlusions could be used to pre-dict the average values of ΔPL,dyn and Pmus for
non-occluded (assisted) breaths during each daily 10-min re-cording and to detect when the average values ofΔPL,dyn
and Pmus for non-occluded (assisted breaths) exceeded
the cut-off values defined above.
For internal validation, we employed a cross-validation
procedure (100 repetitions). During each
cross-validation, patients were randomly divided into deriv-ation (n= 10, 50%) and internal validation (n= 10, 50%) cohorts. In the derivation cohort (step 1), the ratios of
mean Pmus (during all non-occluded breaths) to the
meanΔPocc(k1=Pmus/ΔPocc) and meanΔPes (during all
non-occluded breaths) to the mean ΔPocc (k2=ΔPes/
ΔPocc) were computed in each daily recording using
lin-ear mixed-effects models to account for repeated record-ings within subjects.
In the internal validation cohort (step 2), the derived values of k1and k2 were used to predict Pmus and ΔPes
(and henceΔPL,dyn asΔPaw−ΔPes) from three randomly
selected measurements of ΔPocc in each recording (to
mimic the use of just three occlusion maneuvers for pre-diction in clinical practice) according to Eqs. 1 and 2.
Pmus;predicted¼k1ΔPocc ð1Þ
ΔPL;dyn;predicted¼ΔPaw−k2ΔPocc ð2Þ
Predicted and observed values ofPmusandΔPL,dynwere
compared using Bland-Altman limits of agreement. To ac-count for repeated measures within patients, linear mixed-effects models were employed to estimate within-patient limits of agreement as a proportion of the estimated value (LA%,within) [21]. Values were log-transformed because of
non-normality in the distribution of differences between
predicted and estimated values [22]. The mean and
between-patient standard deviation of the bias between measured and predicted Pmus and ΔPL (SDbias,btw) were
also computed in linear mixed-effects models. Total limits of agreement for Pmus and ΔPL across the range of
esti-mated values were estimated as 1.96 × SDbias,btw+
LA%,within× estimated value. The ability of predictedPmus
andΔPL,dyn to detect excessivePmus andΔPL,dyn(defined
by above threshold values) was evaluated in the internal validation cohort by receiver operating characteristic curve analysis and by computing sensitivity and specificity.
The cross-validation procedure (steps 1 and 2) was re-peated 100 times to evaluate the stability of validity
esti-mates during repeated random sampling [23]. All
statistical analyses were conducted using R version 3.4.3 (www.r-project.org).
External validation
The discriminative validity and sensitivity and specificity of predicted Pmus and ΔPL to detect excessive Pmus and
ΔPL,dyn were independently quantified in a separate
pre-viously published cohort of patients studied in a differ-ent cdiffer-enter (Nanjing, China) receiving partially assisted ventilation in whom random expiratory airway occlu-sions were applied at varying levels of ventilator support (n= 13) [16].
Results
Prevalence of excessive respiratory effort and dynamic lung stress
After excluding 30 recordings because the ratio of
ΔPocc/ΔPeswas greater than 1.3 or less than 0.7, a total
of 52 daily recordings were available in 16 subjects
(median 3, IQR 2–5 daily recordings per patient);
representative tracings are shown in Fig.1. Twelve pa-tients were available in the external validation cohort. Patient characteristics in both cohorts are summarized in Table1.
Pmus and ΔPL,dyn during assisted ventilation ranged
widely in the cohort (Fig. 2). Pmus exceeded 10 cm H2O
on 84% of patient-days in the study and exceeded 15 cm H2O on 53% of patient-days. In 14 patients (88%),
Pmus exceeded 10 cm H2O on at least one study day.
There was no evidence of a correlation between Pmus
and pH (p= 0.21) or PaO2 (p= 0.57). The correlations
between Pmus and SAS score (p= 0.07, R2= 0.06) and
SOFA score (p= 0.08, R2= 0.09) did not reach signifi-cance. Pmus was inversely correlated with PaCO2 (p=
0.03, R2= 0.11). Pmus was higher under partially assisted
modes (mean difference 8 cm H2O,p= 0.02) and higher
in patients admitted for pneumonia compared to pa-tients with non-pulmonary admission diagnoses (mean difference 11 cm H2O,p= 0.05).
ΔPL,dyn exceeded 15 cm H2O on 69% of patient-days
and exceeded 20 cm H2O on 40% of patient-days. In 13
patients (81%), ΔPL,dyn exceeded 15 cm H2O on at least
one study day. ΔPL,dyn was generally substantially higher
than ΔPaw because pleural pressure (represented by Pes)
decreases during inspiration even whilePawincreases
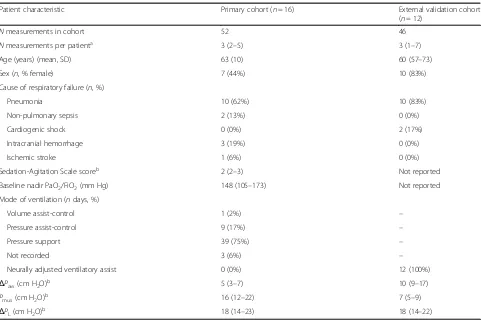
Table 1Patient characteristics
Patient characteristic Primary cohort (n= 16) External validation cohort
(n= 12)
Nmeasurements in cohort 52 46
Nmeasurements per patienta 3 (2–5) 3 (1–7)
Age (years) (mean, SD) 63 (10) 60 (57–73)
Sex (n, % female) 7 (44%) 10 (83%)
Cause of respiratory failure (n, %)
Pneumonia 10 (62%) 10 (83%)
Non-pulmonary sepsis 2 (13%) 0 (0%)
Cardiogenic shock 0 (0%) 2 (17%)
Intracranial hemorrhage 3 (19%) 0 (0%)
Ischemic stroke 1 (6%) 0 (0%)
Sedation-Agitation Scale scoreb 2 (2–3) Not reported
Baseline nadir PaO2/FiO2(mm Hg) 148 (105–173) Not reported
Mode of ventilation (ndays, %)
Volume assist-control 1 (2%) –
Pressure assist-control 9 (17%) –
Pressure support 39 (75%) –
Not recorded 3 (6%) –
Neurally adjusted ventilatory assist 0 (0%) 12 (100%)
ΔPaw(cm H2O)b 5 (3–7) 10 (9–17)
Pmus(cm H2O)b 16 (12–22) 7 (5–9)
ΔPL(cm H2O)b 18 (14–23) 18 (14–22)
Results are presented as median and interquartile range unless otherwise reported a
In the primary cohort, one measurement was obtained per day; in the external validation cohort, multiple measurements were obtained on the same day at varying NAVA support levels
b
Values reported include repeated measurements within subjects over different study days
0 10 20 30 40 50
1 2 3 4 5 6 7 8 Study Day Pmus
(cm H
2
O)
0 10 20 30 40 50
1 2 3 4 5 6 7 8 Study Day
Δ
PL
(cm H
2
O) 0
10 20 30 40 50
Controlled Partially assisted Mode of Ventilation
P
eak P
aw
(cm H
2
O)
0 10 20 30 40 50
Controlled Partially assisted Mode of Ventilation
Δ
Paw
(cm H
2
O)
0 10 20 30 40 50
Controlled Partially assisted Mode of Ventilation
Δ
PL
(cm H
2
O)
0 10 20 30 40 50
Controlled Partially assisted Mode of Ventilation Pmus
(cm H
2
O)
Fig. 2Distribution ofΔPL(dynamic transpulmonary driving pressure) andPmus(respiratory muscle pressure) during mechanical ventilation.
Pressures frequently exceeded“probably excessive”and“definitely excessive”thresholds (dotted and dashed lines, respectively) irrespective of the
duration of the study or the mode of ventilation. While peak and driving airway pressures were lower under partially assisted modes of
[image:5.595.59.538.494.683.2]Although peak airway pressure and airway driving pres-sure were lower on days when patients were ventilated in pressure support ventilation mode compared to volume or pressure-control ventilation (p< 0.005 for both com-parisons),ΔPL,dynwas not significantly different (p= 0.16)
(Fig.2).ΔPL,dynwas higher in patients admitted for
pneu-monia compared to patients with a non-pulmonary diag-nosis (mean difference 9 cm H2O,p= 0.05).
Pmus andΔPL,dynwere both within ideal limits (Pmus≤
10 cm H2O and ΔPL,dyn< 15 cm H2O) on only 8% of
patient-days.
Validity ofΔPoccas a non-invasive marker of respiratory effort
There was no systematic difference in peak Edibetween
occluded and non-occluded breaths (mean difference 0μV, limits of agreement ± 4μV) confirming that re-spiratory drive was unaffected by the randomly applied intermittent airway occlusion. ΔPocc was highly
corre-lated with PTPmus(Additional file2: Figure S1,
between-subjectsR2= 0.71, within-subjectsR2= 0.85).
Detecting excessivePmusandΔPLfromΔPocc
In the derivation cohorts,k1(ratio ofPmus/ΔPocc) was−
0.74 (95% CI−0.69, −0.78) andk2(ratio of ΔPes/ΔPocc)
was 0.66 (0.61–0.70).
Agreement between predicted and measured values of
PmusandΔPL,dynin the internal validation cohorts was
mar-ginally acceptable: bias (the magnitude of difference between predicted and measured values) varied between subjects and the within-subject limits of agreement were relatively wide (Additional file 3: Figure S2, Additional file 4: Table S1). Nevertheless, predictedPmusandΔPL,dynaccurately detected
excessivePmusandΔPL,dynwith areas under the receiver
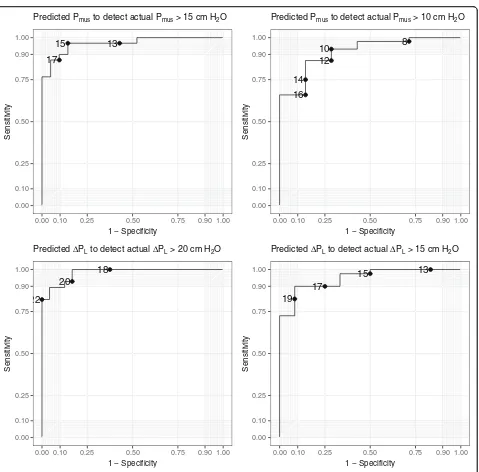
op-erating characteristic curves (AUROC) suggesting strong discriminative performance (AUROC > 0.9 in all cases, Fig.3, Additional file 5: Table S2). Sensitivity and specificity
of different cut-off values of predicted Pmus and
ΔPL,dyn for excessive measured Pmus and ΔPL,dyn are
shown in Additional file 5: Table S2.
Based on the findings in the primary cohort, the utility of ΔPocc was tested in the external validation cohort
using values of k1= -3/4 and k2= 2/3. Discriminative
performance, sensitivity, and specificity for excessive
Pmus and ΔPL,dyn were similarly strong (AUROC ≥0.94
for both excessive Pmus and ΔPL,dyn, Additional file 5:
Table S2).
Discussion
We demonstrate for the first time that measurement of
ΔPocc from three randomly applied end-expiratory
oc-clusion maneuvers can detect excessivePmusandΔPL,dyn
with high sensitivity and specificity, even though agree-ment between predicted and measured values are not
sufficiently reliable to provide direct estimates of Pmus
and ΔPL,dyn. Second, we report for the first time that in
spontaneously breathing patients under mechanical ven-tilation, inspiratory effort and dynamic lung stress fre-quently exceed putative safe thresholds, irrespective of the depth of sedation or mode of ventilation. Patients only infrequently exhibited the “ideal” combination of lung and diaphragm-protective ventilation parameters (Pmus≤10 cm H2O andΔPL,dyn ≤15 cm H2O). The
mag-nitude of dynamic lung stress during spontaneous breathing was often seriously underestimated by airway pressures available on the ventilator, confirming that air-way pressures on the ventilator are an unreliable marker of dynamic lung stress when patients are spontaneously breathing.
Our method relies on predicting the swing in pleural pressure (quantified by Pes) under dynamic conditions
(airway open) from the swing in airway pressure under static conditions (airway occluded). Under quasi-static conditions, the swing in pleural pressure matches the swing in airway pressure exactly. The swing in pleural pressure is smaller during inspiration than under quasi-static conditions because of the force-velocity rela-tion of muscle and because of differences in chest wall mechanics and thoracoabdominal motion [24, 25]. Des-pite these sources of heterogeneity, we found that the conversion factors k1 and k2for converting quasi-static
conditions to dynamic conditions were fairly stable be-tween patients and over time. These conversion factors provide the physiological basis for predicting Pmus and
ΔPL,dyn from ΔPocc. Of note, a substantial proportion of
recordings had to be excluded becauseΔPoccdiffered from
ΔPes during the occlusion maneuver—this highlights the
importance of carefully considering esophageal balloon catheter placement when usingPesfor monitoring.
Inspiratory effort and dynamic lung stress during assisted mechanical ventilation
The transition to partially assisted modes of ventilation is often regarded as a sign of recovery and progress to-wards liberation from the ventilator. However, important new insights about the potential for lung injury due to excessive inspiratory effort and the associated increase in global and regional lung stress (a phenomenon referred to as patient self-inflicted lung injury, P-SILI [26]) mo-tivate efforts to avoid excessive effort and lung stress.
Our data suggest that greater attention should be paid to the potential risks of excessive inspiratory effort and dynamic lung stress during assisted mechanical ventila-tion. ObservedPmusandΔPL,dyn frequently exceeded
airway pressures, these parameters can seriously under-estimate the true magnitude of lung stress during spon-taneous breathing due to the negative pleural pressure generated by the respiratory muscles, which is usually not measured. Clinicians should therefore avoid relying on airway pressure measurements alone to assess the safety of mechanical ventilation in spontaneously breath-ing patients.
Measurement of ΔPocc as described for the first time
in this study offers a highly feasible and sensitive means of detecting excessive inspiratory effort and dynamic lung stress. It is important to note thatΔPL,dyncan only
be predicted if ΔPocc < 0 cm H2O; when inspiratory
ef-fort is absent, the inspiratory swing inΔPeswill be
posi-tive, and hence,ΔPL,dynwill not be correlated toΔPocc.
Limitations
This study has several limitations. First,PmusandΔPL,dyn
were estimated from measurements of airway and esophageal pressure. Due to the presence of active in-spiratory efforts, we did not perform end-inin-spiratory holds to obtain quasi-static pressure measurements al-though some observations suggest that such measure-ments are feasible in the presence of inspiratory effort 13
15
17
0.00 0.10 0.25 0.50 0.75 0.90 1.00
0.00 0.10 0.25 0.50 0.75 0.90 1.00 1 − Specificity
Sensitivity
Predicted Pmus to detect actual Pmus > 15 cm H2O
8 10
12
14 16
0.00 0.10 0.25 0.50 0.75 0.90 1.00
0.00 0.10 0.25 0.50 0.75 0.90 1.00 1 − Specificity
Sensitivity
Predicted Pmus to detect actual Pmus > 10 cm H2O
18 20
22
0.00 0.10 0.25 0.50 0.75 0.90 1.00
0.00 0.10 0.25 0.50 0.75 0.90 1.00 1 − Specificity
Sensitivity
Predicted ΔPL to detect actual ΔPL > 20 cm H2O
13 15
17 19
0.00 0.10 0.25 0.50 0.75 0.90 1.00
0.00 0.10 0.25 0.50 0.75 0.90 1.00 1 − Specificity
Sensitivity
Predicted ΔPL to detect actual ΔPL > 15 cm H2O
Fig. 3Discriminative accuracy assessed by receiver operating characteristic curves. Threshold values are shown as points on the ROC curves.Pmus,
[image:7.595.61.540.82.554.2]provided expiratory muscle activity is minimal [27, 28]. Consequently, ΔPL,dyn as measured in this study
repre-sents a “dynamic” measure that may overestimate the
actual mechanical stress applied to the lung during tidal ventilation. On the other hand, while ΔPL at the
inspira-tory plateau corresponds to the time of maximal alveolar distension in the non-dependent lung, peak ΔPL,dyn is
reached at the time point when dependent lung—the
region most at risk during spontaneous breathing—is
maximally distended by vigorous spontaneous efforts [3]. It may therefore be the more clinically relevant marker of dynamic lung stress in this context. Future studies should determine whether dynamic or quasi-static measurements ofΔPLbest reflect regional distending pressures.
Second, Pmus measurements require measurement of
elastic chest wall recoil pressure; owing to the absence of recordings of passive ventilation in most subjects, we re-lied on empirical estimates of chest wall elastance derived from predicted lung volumes. The reliability of this empiric approach is uncertain, but reassuringly, we found that predicted values of chest wall elastic recoil pressure approximated measured values in patients where direct measurements of chest wall elastance were available (as reported in the Additional file1).
Third, the number of patients in the primary dataset (n= 16) is relatively small, possibly limiting the generalizability of the validation findings. The study population is represen-tative of a broad range of ventilated patients with acute hypoxemic respiratory failure. To avoid overfitting the pre-dicted values ofk1andk2to our dataset and to estimate the
precision of our estimates of the limits of agreement, we employed a cross-validation technique. Importantly, the ap-proach to detecting excessivePmusandΔPL,dyn fromΔPocc
performed extremely well in the independent external validation cohort from a different country (China). The generalizability of these findings is also supported by the fact that the value of k1 estimated in this study (median
0.74) corresponds closely to the value estimated by Bellani et al. when they derived the Pmus−Edi index (0.66) in an
Italian study [29].
Clinical implications
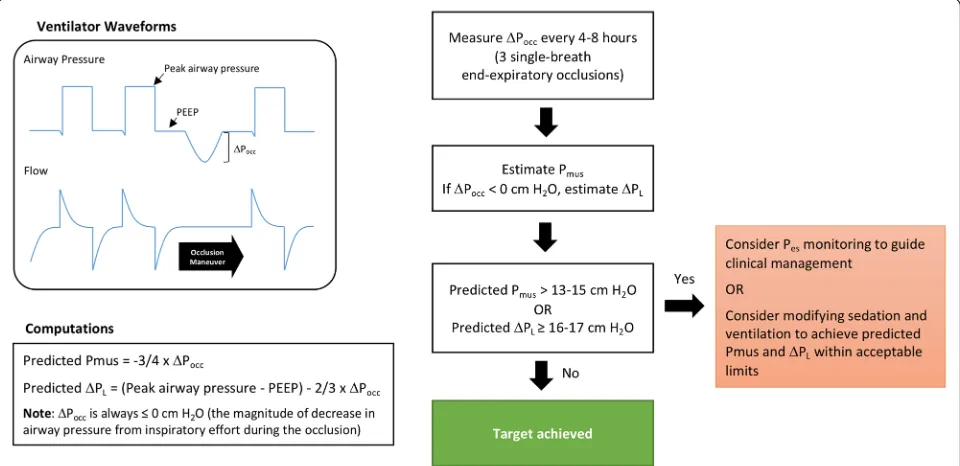
Regular measurements of ΔPocc to estimate Pmus and
ΔPL,dyn during mechanical ventilation provide a highly
feasible means of detecting excessive respiratory effort and excessive dynamic lung stress directly from ventila-tor waveforms. Most modern ventilaventila-tors have capacity to apply an end-expiratory occlusion during ventilation
in controlled or partially assisted modes. Pmus and
ΔPL,dyn values predicted from ΔPocc are not sufficiently
accurate to replace direct clinical monitoring (i.e., esophageal pressure) if desired by clinicians. Rather, these estimates could be used as a highly feasible, rapid, non-invasive “screening test” for excessive Pmus and
ΔPL,dyn. These data could be employed as an indication
to deploy more direct monitoring techniques (i.e., esophageal manometry) or to guide adjustments to ven-tilator assist level, sedation, and opioids (Fig. 4). The maneuver was well-tolerated in our study.
Fig. 4Proposed clinical algorithm for monitoring respiratory muscle pressure (Pmus) and dynamic transpulmonary pressure swings (ΔPL) based on
[image:8.595.58.538.469.702.2]Conclusions
Inspiratory effort and dynamic lung stress often exceed safe limits in patients breathing spontaneously under mechanical ventilation. The airway pressure deflection resulting from patient inspiratory effort during a transi-ent end-expiratory occlusion maneuver (ΔPocc) can be
used to detect excessive (potentially injurious) inspira-tory effort and dynamic lung stress.
Supplementary information
Supplementary informationaccompanies this paper athttps://doi.org/10. 1186/s13054-019-2617-0.
Additional file 1.Supplemental description of methods.
Additional file 2: Figure S1.ΔPocc is correlated with inspiratory effort quantified by the pressure-time product of Pmus.
Additional file 3: Figure S2.Accuracy of predicting Pmus andΔPL
fromΔPocc assessed by Bland-Altman plots.
Additional file 4: Table S1.Agreement between measured and
predicted Pmus andΔPL.
Additional file 5: Table S2.Discriminative performance of predicted
Pmus andΔPLvalues to detect excessive Pmus andΔPL.
Abbreviations
ΔPaw,dyn:Inspiratory swing in pressure (difference between peakPawand
PEEP);ΔPL,dyn: Dynamic transpulmonary driving pressure; increase in PLfrom
onset to peak during inspiration;ΔPL,dyn: Dynamic transpulmonary driving
pressure swing from end-expiration to peak transpulmonary pressure;
ΔPocc: Airway pressure deflection generated by the patient’s respiratory effort
against the occluded airway; airway pressure from PEEP. The time of
occlusion is as long as the duration of a single breath;Edi: Diaphragm
electrical activity;k1: The ratio of meanPmus(during all non-occluded
breaths) to the meanΔPocc(k1=Pmus/ΔPocc);k2: The ratio of meanΔPes
(during all non-occluded breaths) to the meanΔPocc(k2=ΔPes/ΔPocc);
P0.1: The airway occlusion pressure at 100 milliseconds after the onset of
inspiration;Paw: Airway pressure;Pcw: Chest wall elastic recoil pressure at
end-inspiration;Pes: Esophageal pressure;PL: Transpulmonary pressure;
Pmus: Respiratory muscle pressure(inspiratory effort); peak difference
betweenPcwandPesduring inspiration; PTPmus: Pressure-time product of
Pmusper breath; SAS score: Sedation-Agitation Scale score; SOFA
score: Sequential Organ Failure Assessment score
Authors’contributions
The study was conceived by MB and EG. Measurements were collected by EG. Signal analysis was conducted by MB and EG. Statistical analysis was conducted by EG. MB and EG drafted the manuscript. All authors critically revised the manuscript for important intellectual content. All authors read and approved the final manuscript.
Funding
This research was sponsored by PSI Foundation. Dr. Goligher is supported by an Early Career Investigator Award from the Canadian Institutes of Health Research. Dr. Fan is supported by a New Investigator Award from the Canadian Institutes of Health Research. The funders played no role in the design, analysis, or reporting of the results. The authors have no financial relationship with the organizations that funded the research.
Availability of data and materials
The datasets generated and/or analyzed during the current study are not publicly available due to ongoing analysis in the primary study but are available from the corresponding author on reasonable request.
Ethics approval and consent to participate
Approval for the study procedures and data collected for this report was obtained from the research ethics board at the University Health Network (12-5582).
Consent for publication
Not applicable.
Competing interests
Dr. Goligher’s laboratory receives support in the form of equipment from
Getinge, and Dr. Goligher has received speaking honoraria from Getinge. The other authors declare that they have no competing interests.
Author details
1Department of Anesthesia, Critical Care and Emergency, Spedali Civili di
Brescia, University of Brescia, UNIBS, Brescia, Italy.2Department of Medical and Surgical Specialities, Radiological Sciences and Public Health, University of Brescia, UNIBS, Brescia, Italy.3Interdepartmental Division of Critical Care
Medicine, University of Toronto, Toronto, Canada.4Keenan Centre for
Biomedical Research, Li Ka Shing Knowledge Institute, St. Michael’s Hospital, Toronto, Canada.5Division of Respirology, Department of Medicine,
University Health Network and University of Toronto, Toronto, Canada.
6Respiratory Therapy, University Health Network, Toronto, Canada.7Institute
for Health Policy, Management, and Evaluation, University of Toronto, Toronto, Canada.8Department of Critical Care Medicine, Zhongda Hospital,
Southeast University, Nanjing, China.9Department of Physiology, University
of Toronto, Toronto, Canada.10Toronto General Hospital Research Institute,
Toronto, Canada.11Toronto General Hospital, 585 University Ave., Peter Munk Building, 11th Floor, Room 192, Toronto, ON M5G 2N2, Canada.
Received: 5 July 2019 Accepted: 20 September 2019
References
1. Yoshida T, Nakahashi S, Nakamura M, Koyama Y, Roldan R, Torsani V, et al.
Volume-controlled ventilation does not prevent injurious inflation during
spontaneous effort. Am J Resp Crit Care. 2017;196:590–601.
2. Papazian L, Forel J-M, Gacouin A, Penot-Ragon C, Perrin G, Loundou A, et al.
Neuromuscular blockers in early acute respiratory distress syndrome. New
Engl J Medicine. 2010;363:1107–16.
3. Yoshida T, Amato MB, Kavanagh BP. Understanding spontaneous vs
ventilator breaths: impact and monitoring. Intens Care Med. 2018;164:43.
4. Orozco-Levi M, Lloreta J, Minguella J, Serrano S, Broquetas J, Gea J. Injury of
the human diaphragm associated with exertion and chronic obstructive
pulmonary disease. Am J Resp Crit Care. 2001;164:1734–9.
5. Hussain S, Roussos C. Distribution of respiratory muscle and organ blood
flow during endotoxic shock in dogs. J Appl Physiol. 1985;59:1802–8.
6. Goligher EC, Dres M, Fan E, Rubenfeld GD, Scales DC, Herridge MS, et al.
Mechanical ventilation-induced diaphragm atrophy strongly impacts clinical
outcomes. Am J Resp Crit Care. 2018;197:204–13.
7. Vaporidi K, Akoumianaki E, Telias I, Goligher EC, Brochard L, Georgopoulos
D. Respiratory drive in critically ill patients: pathophysiology and clinical implications. Am J Respir Crit Care Med 2019;0.
8. Gentzler ER, Derry H, Ouyang DJ, Lief L, Berlin DA, Xu C, et al.
Underdetection and undertreatment of dyspnea in critically ill patients. Am J Resp Crit Care. 2019;199:1377-1384.
9. Mauri T, Yoshida T, Bellani G, Goligher EC, Carteaux G, Rittayamai N, et al.
Esophageal and transpulmonary pressure in the clinical setting: meaning,
usefulness and perspectives. Intens Care Med. 2016;42:1360–73.
10. Beck J, Gottfried SB, Navalesi P, Skrobik Y, Comtois N, ROSSINI M, et al.
Electrical activity of the diaphragm during pressure support ventilation in
acute respiratory failure. Am J Resp Crit Care. 2001;164:419–24.
11. Goligher EC, Laghi F, Detsky ME, Farias P, Murray A, Brace D, et al.
Measuring diaphragm thickness with ultrasound in mechanically ventilated patients: feasibility, reproducibility and validity. Intens Care Med. 2015;41:734.
12. Telias I, Damiani F, Brochard L. The airway occlusion pressure (P0.1) to
monitor respiratory drive during mechanical ventilation: increasing
awareness of a not-so-new problem. Intens Care Med. 2018;195:438–4.
13. Amato MB, Meade MO, Slutsky AS, Brochard L, Costa EL, Schoenfeld DA,
et al. Driving pressure and survival in the acute respiratory distress
syndrome. New Engl J Med. 2015;372:747–55.
14. Bellani G, Grasselli G, Teggia-Droghi M, Mauri T, Coppadoro A, Brochard L,
15. Xirouhaki N, Kondili E, Mitrouska I, Siafakas N, Georgopoulos D. Response of respiratory motor output to varying pressure in mechanically ventilated
patients. Eur Respiratory J. 1999;14:508–16.
16. Liu L, Liu S, Xie J, Yang Y, Slutsky AS, Beck J, et al. Assessment of
patient-ventilator breath contribution during neurally adjusted patient-ventilatory assist in patients with acute respiratory failure. Crit Care. 2015;19:43.
17. Jubran A, Tobin M. Pathophysiologic basis of acute respiratory distress in
patients who fail a trial of weaning from mechanical ventilation. Am J Resp
Crit Care. 1997;155:906–15.
18. Carteaux G, Mancebo J, Mercat A, Dellamonica J, Richard J-CM,
Aguirre-Bermeo H, et al. Bedside adjustment of proportional assist ventilation to target a predefined range of respiratory effort. Crit Care Med. 2013;
41:2125–32.
19. Mancebo J, Isabey D, Lorino H, Lofaso F, Lemaire F, Brochard L.
Comparative effects of pressure support ventilation and intermittent positive pressure breathing (IPPB) in non-intubated healthy subjects. Eur
Respir J. 1995;8:1901–9.
20. Jubran A, Grant BJ, Laghi F, Parthasarathy S, Tobin MJ. Weaning prediction:
esophageal pressure monitoring complements readiness testing. Am J Resp Crit Care. 2005;171:1252 1259.
21. Myles P, CUI J. Using the Bland-Altman method to measure agreement with
repeated measures. Bja Br J Anaesth. 2007;99:309–11.
22. Euser AM, Dekker FW, le Cessie S. A practical approach to Bland-Altman
plots and variation coefficients for log transformed variables. J Clin
Epidemiol. 2008;61:978–82.
23. Altman DG, Royston P. What do we mean by validating a prognostic
model? Stat Med. 2000;19:453–73.
24. Grassino A, Goldman, Mead J, Sears T. Mechanics of the human diaphragm
during voluntary contraction: statics. J Appl Physiol. 1978;44:829–39.
25. Goldman GA, Mead J, Sears T. Mechanics of the human diaphragm during
voluntary contraction: dynamics. J Appl Physiol. 1978;44:840–8.
26. Brochard L, Slutsky A, Pesenti A. Mechanical ventilation to minimize
progression of lung injury in acute respiratory failure. Am J Resp Crit Care.
2017;195:438–42.
27. Bellani G, Grassi A, Sosio S, Gatti S, Kavanagh BP, Pesenti A, et al. Driving
pressure is associated with outcome during assisted ventilation in acute
respiratory distress syndrome. Anesthesiology. 2019;131:594–604.
28. Bellani G, Grassi A, Sosio S, Foti G. Plateau and driving pressure in the
presence of spontaneous breathing. Intens Care Med. 2019;45:97–8.
29. Bellani G, Mauri T, Coppadoro A, Grasselli G, Patroniti N, Spadaro S, et al.
Estimation of patient’s inspiratory effort from the electrical activity of the
diaphragm. Crit Care Med. 2013;41:1483–91.
Publisher’s Note