R E S E A R C H A R T I C L E
Open Access
MicroRNA-29 family expression and its relation to
antiviral immune response and viro-immunological
markers in HIV-1-infected patients
Katia Monteleone
1, Carla Selvaggi
1, Giulia Cacciotti
1, Francesca Falasca
1, Ivano Mezzaroma
2, Gabriella D
’
Ettorre
3,
Ombretta Turriziani
1, Vincenzo Vullo
3, Guido Antonelli
1and Carolina Scagnolari
1*Abstract
Background:Severalin vitrostudies suggested the microRNA-29 (miRNA-29) family is involved in regulating HIV-1 and modulating the expression of interleukin (IL)-32, an anti-HIV-1 cytokine.
Methods:To investigate the contribution of the miRNA-29 family to HIV-1 infectionin vivo, we compared miRNA-29 expression in PBMC collected from 58 HIV-1-infected patients, naïve for antiretroviral therapy, and 21 gender- and age-matched HIV-1 seronegative healthy donors, using RT-Taqman assays. The relation between miRNA-29 levels and HIV-1 viro-immunological markers and the activation rate of antiviral immune response were also evaluated. In addition, we profiled miRNA-29 expression in CD4+ T lymphocytes and CD14+ monocytes collected from 5 antiretroviral treated HIV-1 infected patients.
Results:miRNA-29b levels were higher in HIV-1-infected patients than in the control group (p < 0.001). There were no correlations with either HIV-1 RNA levels or CD4+ T count, whereas a significant correlation was found between miRNA-29-a/c levels and integrated HIV-1 DNA (miRNA-29a: p = 0.009, r =−0.448; miRNA-29c: p = 0.029; r =−0.381). When the HIV-1-infected patients were grouped on the basis of their plasma HIV-1 RNA and CD4+ T cell count, we also found that patients expressing the lowest levels of miRNA-29c showed high viraemia, low CD4+ T cell count and high levels of integrated HIV-1 DNA. Moreover, miRNA-29b levels were correlated with those of IL-32nonα(p = 0.028; r =−0.298). Patients expressing higher levels of miRNA-29b showed lower levels of MxA, an interferon-stimulated gene, also induced by IL-32 (p = 0.006 r =−0.397). Lastly, we found that CD4+ T lymphocytes and CD14+ monocytes shared similar miRNA-29a/b/c expression patterns but the amount of miRNA-29a/b/c, IL-32 isoforms and MxA were highly variable in these two cellular subsets.
Conclusions:The miRNA-29 family could influence the clinical progression of HIV-1 infection, the HIV-1 proviral load and the innate immune response against HIV-1.
Keywords:miRNA-29, HIV-1, IL-32, MxA
Background
MicroRNAs (miRNAs) are small RNA molecules of ~22 nucleotides involved in the regulation of several bio-logical processes [1]. Recently, miRNAs have also been shown to target and inhibit viral gene expression. Sev-eral interactions between HIV-1 and cellular miRNAs
have been described, suggesting that altered miRNA profile expression could contribute to the pathogenesis of HIV-1 infection and HIV-1 latency in primary CD4+ T lymphocytes [2-5].
Among all the identified miRNAs, the miRNA-29 family has been suggested to play a pivotal role in regu-lating viral replication. The miRNA-29 family consists of four closely related members, 29a, miRNA-29b-1, miRNA-29b-2 and miRNA-29c, although the mature sequences of miRNA-29b-1 and miRNA-29b-2 are identical. They are characterized by the same“seed
* Correspondence:carolina.scagnolari@uniroma1.it
1Pasteur Institute-Cenci Bolognetti Foundation, Department of Molecular
Medicine, Laboratory of Virology, Sapienza University of Rome, Viale di Porta Tiburtina n 28, 00185 Rome, Italy
Full list of author information is available at the end of the article
region”and are expressed in both T and B cells [6]. Re-cent reports showed that miRNA-29a downregulates nef expression interfering with HIV-1 replication in Jurkat cells [7,8]. Moreover it has been shown that miRNA-29a is highly expressed in human CD4+ T cells and is able to target the HIV-1 3'UTR regionin vitro[9]. MiRNA-29a inhibition enhanced HIV-1 viral produc-tion and infectivity, whereas expression of miRNA-29a mimics suppressed viral replication [9]. In agreement with this observation, Sun et al. found that miRNA-29a/ b, miRNA-155 and miRNA-21 levels were significantly reduced in HIV-1-infected CD4(+)CD8(−) peripheral blood mononuclear cells [10]. Furthermore,ex vivo ex-periments using HIV-1 infected lymphocytes reported a reduced expression of miRNA-29a, miRNA-29b, and miRNA-29c [10,11]. However, few studies have investi-gated the role of the miRNA-29 family in HIV-1 infection in vivo. Houzet and colleagues analyzed the expression of several miRNAs, including the miRNA-29 family, in PBMC from 36 HIV-1-infected individuals classified into four classes based on their CD4+ T cell counts and viral loads. They found miRNA profiles specific for those different classes of patients that plaus-ibly correlate stage-specific miRNA alterations with the in vivocourse of HIV-1 infection [12]. Moreover, Witwer and coworkers analysed miRNA profiles from healthy individuals, elite HIV-1 controllers, and untreated vir-aemic HIV-1 patients, also showing that HIV positive patients have an altered expression of the miRNA-29 family [13].
Interestingly, miRNA-29b was found to be involved in regulating the expression of interleukin (IL)-32, a cyto-kine with antiviral properties against HIV-1 [14-17], by directly targeting the IL-32 mRNA 3'-untranslated re-gion [18], that can induce IFN-λ1, IFN-β and IFN-induced genes, such as MxA, PKR and APOBEC3G/3 F [17-20].
In order to investigate the contribution of the miRNA-29 family to HIV-1 regulation in vivo, we analysed miRNA-29a/b/c expression in HIV-1 positive patients naïve for antiretroviral therapy. Then we evaluated the influence of the miRNA-29 family on the main viro-immunological markers of HIV-1 infection by analysing the relationship between miRNA-29 family expression levels and plasma viraemia, CD4+ T cell count and levels of integrated HIV-1 DNA, which reflects the establishment of HIV-1 latency [21]. Moreover, to further characterize the rela-tion between miRNA-29b and IL-32 expression, we investigated whether miRNA-29 levels influence the amount of IL-32 and MxA during HIV-1 infection. Fi-nally, the miRNA-29a/b/c, IL-32 isoforms and MxA levels were measured in CD4+ T lymphocytes and CD14+ monocytes collected from antiretroviral treated HIV-1 pa-tients with detectable viremia.
Methods Study population
Peripheral blood samples obtained from 63 HIV-1-infected patients, both therapy-naïve (n = 58) and HAART-treated (n = 5), attending the Policlinico Umberto I University Hospital in Rome were included in this study. All patients were infected with the HIV-1 subtype B strain. No patients had any concurrent acute illness or infection including CMV disease, mycobacterium tubercolosisis, hepatitis B and C virus infections. The demographic and clinical characteristics of naïve and treated HIV-1-infected pa-tients are reported in Table 1. Blood samples from 21 healthy gender- and age-matched individuals were also included in this study to compare the expression of miRNA-29a/b/c in naïve HIV-1 positive patients and healthy subjects.
The study was approved by the ethics committee of the Policlinico Umberto I Hospital,“Sapienza”University of Rome and informed consent was obtained from both HIV-1 positive patients and healthy individuals.
Measurement of HIV-1 RNA and CD4+ T lymphocyte count
HIV-1 viral load was determined by versant HIV-1 RNA kPCR assay (Siemens Healthcare Diagnostic, Tarrytown NY, USA) which has a detection limit of 37 copies/ml. Absolute CD4+ T lymphocyte count was performed by FACScalibur flow cytometer (Becton Dickinson, San Jose, CA, USA).
PBMC isolation
PBMC were isolated from naïve and treated HIV-1 in-fected patients and healthy individuals fresh blood by Ficoll-Hypaque density gradient centrifugation (Sigma-Aldrich, St. Louis, MO, USA) and dry pellets of 106PBMC were stored at−80°C.
CD4+ T lymphocytes and CD14+ monocytes isolation
CD14+ monocytes and CD4+ T lymphocytes were isolated from PBMC collected from 5 treated HIV-1-infected pa-tients by positive selection using the MACS® Technology (Miltenyi Biotec, Bergisch Gladbach, Germany), according to the manufacturer's protocol.
TaqMan-based real time RT-PCR technique for microRNAs
using TaqMan MicroRNA Reverse Transcription Kit, ac-cording to the manufacturer's protocols (Applied Biosys-tems); real time PCR was carried out in a final volume of 20 μl using LightCycler480 instrument (Roche, Basel, Switzerland). The constitutively expressed RNU6B was used as an internal control. Expression values of miRNA-29s were calculated by the comparative threshold cycle (Ct) method. In particular, the data were analyzed using the equation 2−deltaCT, where DeltaCT= (CT of target miRNA−CTof internal control).
TaqMan-based real time RT-PCR technique for mRNA expression evaluation
mRNA levels of IL-32α, IL-32nonαand MxA were assessed by real time RT-PCR using the LightCycler480 instrument, as previously described [17]. Briefly, total RNA was ex-tracted from PBMC, CD4+ T lymphocytes and CD14+ monocytes using the TRIzol reagent (Invitrogen, Carlsbad, CA, USA), according to the manufacturer's protocol. The purity of RNA was evaluated spectrophotometerically at the absorbance 230, 260 and 280 nm (Varioskan™ Flash Multimode Reader, Thermo Fisher Scientific Waltham, MA, USA). Cellular RNA was reverse transcribed by using High-Capacity cDNA Archive Kit (Applied Biosystems) as previously specified [22]. Primers and probes for each gene were added to the Probes Master Mix (Roche, Basel, Switzerland) at 500 and 250 nM respectively, in a final volume of 20μl. The housekeeping geneβ-glucuronidase was used as an internal control. The primers and probe sequences used for β-glucuronidase gene were the fol-lowing: Forward 5′ -TCTGTCAAGGGCAGTAACCTG-3′, Reverse 5′-GCCCACGACTTTGTTTTCTG-3′, Probe
5′-(6FAM)TATGTCTTTCGATATGCAGCCAAGTTTT
ACCG3′(TAM)-3′. Gene expression values were calcu-lated by the comparative Ct method. In particular, data were analyzed using the equation 2−deltaCT, where Del-taCT= (CTof target gene−CTof housekeeping gene).
TaqMan-based real time RT-PCR technique for HIV DNA measurement
Total DNA was extracted from PBMC collected from HIV-1 positive patients using the TRIzol reagent and then purified using QIAamp DNA Micro Kit (QIAGEN, Milan, Italy), according to the manufacturer's protocols. Integrated HIV DNA was quantified using two-step amp-lification. In the first step, HIV DNA primers designed to detect host-genome repetitive motifs (Alu) were paired with HIV-gag specific primers (30 cycle of amplification) to quantify integrated HIV DNA in patient samples as previously described [23]. In the second step a real time PCR for the LTR gene was performed using primers an-nealing in LTR gene [24]. Human telomerase reverse tran-scriptase (hTERT) was employed as a housekeeping gene and amplified in parallel with the HIV-1 gene. To quantify HIV-1 DNA we used a standard curve (fivefold dilutions of 8E5 cell DNA) and all samples from each patient were tested in the same assay. Results were expressed as num-ber of HIV-1 DNA copies/106PBMC.
Statistical analysis
Demographic characteristics of HIV-1 positive patients and healthy donors were compared using Student's t and Chi-squared tests.
Differences between HIV-1 positive patients and healthy donors in terms of miRNA-29 expression were analysed using the Mann–Whitney test. The same test was also used to compare miRNA-29 expression levels in HIV-1 positive patients divided into two classes on the basis of the their viral load (class I: HIV RNA >10000 copies/ml; class II: HIV RNA <10000 copies/ml) and to evaluate any difference in miRNA-29a/b/c levels and mRNA levels of MxA, IL-32α and IL-32nonα between CD4+ T lympho-cytes and CD14+ monolympho-cytes.
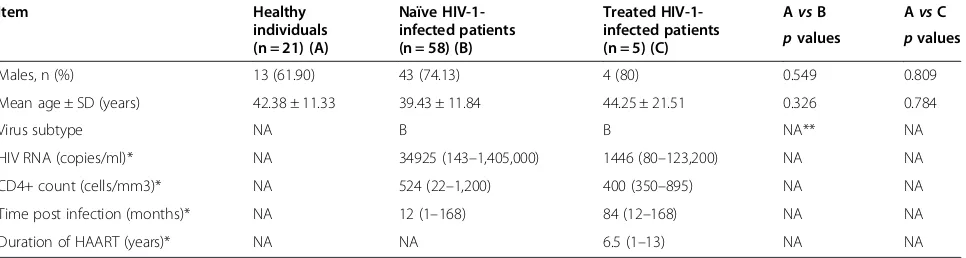
[image:3.595.58.541.112.241.2]Spearman's rho coefficient was calculated to assess the correlation between miRNA-29 levels and 1) the age of Table 1 Demographic and clinical characteristics of chronically HIV-1-infected patients and HIV seronegative healthy individuals
Item Healthy
individuals (n = 21) (A)
Naïve HIV-1-infected patients (n = 58) (B)
Treated HIV-1-infected patients (n = 5) (C)
AvsB AvsC
pvalues pvalues
Males, n (%) 13 (61.90) 43 (74.13) 4 (80) 0.549 0.809
Mean age ± SD (years) 42.38 ± 11.33 39.43 ± 11.84 44.25 ± 21.51 0.326 0.784
Virus subtype NA B B NA** NA
HIV RNA (copies/ml)* NA 34925 (143–1,405,000) 1446 (80–123,200) NA NA
CD4+ count (cells/mm3)* NA 524 (22–1,200) 400 (350–895) NA NA
Time post infection (months)* NA 12 (1–168) 84 (12–168) NA NA
Duration of HAART (years)* NA NA 6.5 (1–13) NA NA
*Data are expressed as median (range).
Differences in demographic characteristics between HIV-1-infected patients and HIV seronegative healthy individuals were evaluated using Student's t and Chi-squared tests.
both patients and healthy individuals; 2) plasma viraemia and CD4+ T cell count; 3) integrated HIV DNA levels; 4) transcript levels of IL-32α, IL-32nonαand MxA.
Differences in miRNA-29 transcript levels in HIV positive patients stratified into five groups according to viral load and CD4+ T cell count (Table 2) were analysed using Kruskal-Wallis test. The same test was also used to evaluate any differences in expression among miRNA-29 s in HIV-1-infected individuals and healthy subjects, to compare miRNA-29 expression levels in HIV-1 positive patients divided into three groups on the basis of their CD4+ T cell count (low: <200 CD4+ T cells/mm3; inter-mediate: 200–500 CD4+ T cells/mm3; high: >500 CD4+ T cells/mm3) and to analyse differences in expression among miRNA-29a/b/c in CD4+ T lymphocytes and CD14+ monocytes.
A p-value less than 0.05 was considered statistically significant. All analysis were performed with SPSS v.17.0 for Windows.
Results
Differential expression of miRNA-29 family members
We evaluated miRNA-29a, miRNA-29b and miRNA-29c levels in PBMC collected from 58 chronically HIV-1-infected patients naïve for antiretroviral treatment, and 21 gender- and age- matched HIV-seronegative healthy in-dividuals. As expected, miRNA-29 transcript levels showed some degree of individual-to-individual variability both in untreated chronically HIV-1-infected patients and healthy donors [coefficient of variation: (HIV-infected patients = miRNA-29a: 309.97; miRNA-29b: 510.73; miRNA-29c: 320.08); (healthy donors = 29a: 57.82; miRNA-29b: 79.15; miRNA-29c: 98.87)] and a significant variation was observed among the levels of miRNA-29 members in both HIV-infected patients and healthy donors. In par-ticular, we observed in both groups that miRNA-29a levels were higher than those of 29b/c, miRNA-29b levels were lower than those of miRNA-29a/c, whereas miRNA-29c levels showed intermediate levels of expression (HIV-infected patients: p< 0.001; healthy donors:p< 0.001) (Figure 1).
As shown in Figure 1, miRNA-29b levels were signifi-cantly higher in HIV-1-infected patients than those mea-sured in the control group (p< 0.001). No significant difference was found in miRNA-29a and miRNA-29c levels between HIV-1-infected patients and healthy indi-viduals, although we observed a trend toward higher levels of both miRNA-29 s in HIV-1-infected patients. The impact of age on miRNA-29 expression was strongly correlated between miRNA-29b levels and the age of healthy donors but not with that of HIV positive patients (p= 0.040;r= 0.574;p= 0.759;r=−0.042). In addition, we observed that gender was not associated with miRNA-29 levels in either group.
miRNA correlations with plasma viral load or CD4+ T cells count
We analysed the relationship between miRNA-29 levels and those of well-known virological and immunological markers of HIV-1 infection: plasma viral load and CD4+ T cell count.
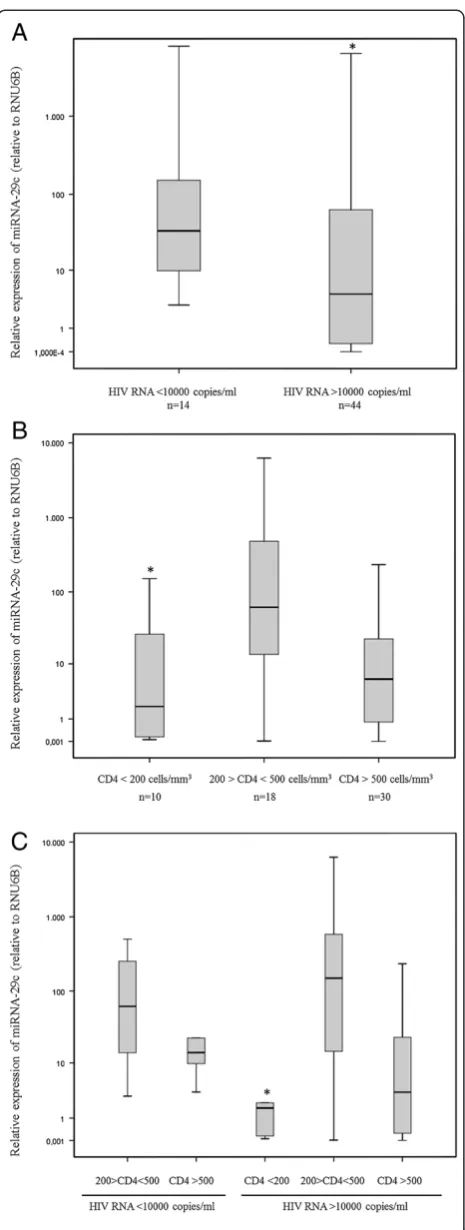
Results indicated that there were no correlations be-tween miRNA-29a/b/c and HIV-1 RNA levels (Table 3), but when the HIV-1-infected patients were divided into two classes on the basis of the their plasma HIV-1 RNA (class I: >10000 copies/ml; class II: <10000 copies/ml), the patients expressing lower levels of miRNA-29c also had higher levels of viral load (Figure 2, Panel A) (p= 0.038).
Likewise, we failed to detect any significant association between miRNA-29 expression and CD4+ T count in our studied group (miRNA-29a:p= 0.865,r= 0.023; miRNA-29b:p= 0.832,r= 0.029; miRNA-29c:p= 0.731,r= 0.046) (Table 3) but when the chronically HIV-1-infected pa-tients were grouped according to their CD4+ T cell count, the subset with <200 CD4+ T cells/mm3had lower levels of miRNA-29c than the subsets with CD4+ T cell counts of between 200 and 500 and above 500 cells/mm3 (Figure 2, Panel B) (p= 0.019).
These data were also confirmed by a more detailed analysis based on the division of patients into five groups of HIV-1 seropositive individuals [i.e. patients with inter-mediate CD4+ T cell count and low viral load (group I), high CD4+ T cell count and low viral load (group II), low CD4+ T cell count and high viral load (group III), inter-mediate CD4+ T cell count and high viral load (group IV) and high CD4+ T cell count and high viral load (group V)] (Table 2). As expected, we found that each group was characterized by a different level of miRNA-29c expres-sion (p= 0.019) and that again patients expressing the lowest levels of miRNA-29c showed high viraemia and low CD4+ T cell count (group III) (Figure 2, Panel C).
MiRNA correlations with HIV-1 DNA
[image:4.595.56.292.641.733.2]In an attempt to determine whether differentially expressed cellular miRNAs could influence HIV-1 proviral load, Table 2 Classifications of HIV-1-infected patients on the
basis of CD4+ T cell count and viral load
Group CD4+ T cell count
(cells/mm3) Plasma HIV-1 RNA(HIV RNA copies/ml) Number ofpatients
I 200-500 <10000 8
II >500 <10000 6
III <200 >10000 9
IV 200-500 >10000 11
levels of miRNA-29a, miRNA-29b and miRNA-29c were examined for any significant correlation with levels of integrated HIV-1 DNA measured in PBMC collected from HIV-infected patients before starting antiretroviral therapy.
Our results indicated a significant negative correl-ation between miRNA-29a and miRNA-29c expression levels and those of integrated HIV-1 DNA (miRNA-29a: p= 0.009; r=−0.448, miRNA-29b: p= 0.176; r=−0.241, miRNA-29c:p= 0.029;r=−0.381) (Table 3).
Expression of microRNA-29 a/b/c in CD14+ monocytes and CD4+ T lymphocytes
[image:5.595.60.537.88.362.2]In an attempt to evaluate whether distinct cellular sub-sets harbored unique miRNA profiles, the miRNA-29a/ b/c levels were measured in CD4+ T lymphocytes and CD14+ monocytes collected from HIV-1 infected pa-tients who didn’t achieve a virological suppression in re-sponse to antiretroviral therapy. As previously observed in PBMC of naïve HIV patients, results confirmed that 29a levels were higher than those of miRNA-29b/c, miRNA-29b levels were lower than those of miRNA-29a/c, whereas miRNA-29c levels showed inter-mediate levels of expression in both CD4+ T lympho-cytes and CD14+ monolympho-cytes collected from treated HIV-1 patients (Figure 3). However, the differences in terms of miRNA-29a/b/c expression reached statistical significance only when CD14+ monocytes were analyzed Figure 1Comparison of miRNA-29a/b/c levels in HIV-1-infected patients (n = 58) and gender- and age-matched healthy donors (HD) (n = 21).MiRNA-29a/b/c levels were analysed in PBMC collected from HIV-1-infected patients and from healthy individuals using real time RT-PCR assays. MiRNA-29a/b/c levels are expressed as relative expression [ΔCt method] normalized to the levels of the constitutively expressed RNU6B. The relative quantity of miRNA-29a/b/c levels was calculated by the equation 2−(ΔCt). Differences between HIV-1-infected patients and healthy donors in terms of miRNA-29 levels were analysed using the Mann–Whitney test. (°HIV-1-infected patientsvshealthy donors: miRNA-29a, p= 0.251; miRNA-29b,p< 0.0001. miRNA-29c,p =0.164). Kruskal-Wallis test was used to evaluate differences in expression among miRNA-29a/b/c in HIV-1-infected individuals and healthy subjects (*HIV-1-infected patients:p< 0.001; **healthy donors:p< 0.001).
Table 3 Relation between miRNA-29a/b/c levels and viro-immunological parameters, IL-32 isoforms and MxA in 58 HIV-1-infected patients
Item miRNA-29a miRNA-29b miRNA-29c
p r p r p r
HIV-1 RNA (copies/ml)
0.079 0.232 0.102 0.445 0.103 0.216
CD4+ T cell count (cells/mm3)
0.865 0.023 0.832 0.029 0.731 0.046
HIV-1 DNA
(copies/106cells) 0.009 −0.448 0.176 −0.241 0.029; −0.381
IL-32α NA* NA 0.318 −0.140 NA NA
IL-32nonα NA NA 0.028 −0.298 NA NA
MxA NA NA 0.006 −0.397 NA NA
[image:5.595.57.290.577.716.2](Figure 3, CD4+ T lymphocytes: p = 0.114; CD14+ mono-cytes: p = 0.021). Moreover, we found that some HIV-1 pa-tients expressed higher levels of miRNA29a-c in CD4 + T lymphocytes compared to those in CD14+ monocytes while others manifested an opposite miRNA29a-c pattern in these two cellular subsets (Figure 3). Due to the high inter-patients variability of miRNA-29a/b/c expression, the median values of miRNA-29 a, b, and c were not dif-ferent between CD4+ T lymphocytes and CD14+ mono-cytes (Figure 3, CD4+ lymphomono-cytesvsCD14+ monocytes: 29a, p = 0.602; 29b, p = 0.347; miRNA-29c, p = 0.754).
In vivorelation between miRNA-29b and IL-32
To investigate whether the transcript levels of miRNA-29b affect IL-32 expression and, in turn, the antiretroviral response, we measured IL-32 (α and nonα isoforms) mRNA levels in PBMC collected from 58 HIV-1-infected patients naïve for antiretroviral treatment. Interestingly, we found an inverse weak correlation between miRNA-29b and IL-32nonα levels in HIV positive patients (p= 0.028; r=−0.298) whereas no significant correlation was found with IL-32αlevels (Table 3).
[image:6.595.58.291.85.701.2]Furthermore we evaluate whether miRNA-29b levels influence the transcript levels of MxA, a well-established type I and III IFN-stimulated gene, which is also induced by IL-32. We found a strong positive correlation be-tween IL-32nonα and MxA transcript levels (p< 0.001; r= 0.593) and patients expressing higher levels of miRNA-29b showed lower levels of MxA (p= 0.006 r=−0.397) (Table 3). Then, we tried to establish which cellular subset, CD4+ T lymphocytes and CD14+ monocytes, could be re-sponsible of the relationships observed between miRNA-29s, IL-32 and MxA in PBMC of naïve HIV-1 patients. As previously observed for miRNA-29a/b/c levels, the expres-sion of IL-32 isoforms (αand nonα) and MxA exhibited a high degree of variability in CD4+ T lymphocytes and CD14+ monocytes and they were not different in these cellular subsets (Figure 4, CD4+ lymphocytes vs CD14+
monocytes: MxA, p = 0.465; IL-32α, p = 0.347; IL-32nonα, p = 0.754).
Discussion and conclusions
Recent reports have indicated the miRNA-29 family as a putative regulator of key processes against HIV-1 infection. Thus, we compared the expression profile of miRNA-29a, miRNA-29b and miRNA-29c in HIV-1-infected patients and healthy donors, and evaluated whether and how dif-ferences in expression could influence the clinical
progression of HIV-1 infection and the antiviral im-mune response.
[image:7.595.58.540.87.491.2]related changes in the expression of some miRNA and miRNA* strands [25]. The loss of correlation between age and miRNA-29b levels observed in the HIV-infected patients could be explained as a consequence of viral pathogenesis: HIV-1 infection in vivo is expected to exert physiologic effects on T-cell function which could be reflected in significant miRNA changes. Directly
[image:8.595.58.539.88.550.2]miRNA-29c transcript levels measured in healthy donors and HIV-1 positive patients, although we did observe a trend toward higher levels of both miRNAs in HIV-1-infected patients. This could be explained by the fact that although the three mature members of the miRNA-29 family share a common seed region sequence and are pre-dicted to target largely overlapping sets of genes, they ex-hibit differential regulation in several cases and different subcellular distribution [26]. In addition, their stable ex-pression levels are likely to depend on exex-pression of the two clusters, alternative splicing of primary RNA and dif-ferential decay, all factors which may vary in a cell-specific manner [6].
In line with our results, it was recently reported that HIV-1-infected patients are characterized by an altered miRNA expression profile compared to healthy donors. Witwer and coworkers described an altered PBMC miRNA profile in elite suppressors and untreated viraemic patients compared to uninfected controls. However, they found that among miRNAs with significant expression changes ex-pression levels were more often lower in viraemic individ-uals. For example, control PBMC had higher mean levels than viraemic PBMC of all miRNA-29 family members [13]. Furthermore, Houzet and colleagues profiled miRNA expression in PBMC from 36 HIV-1 seropositive individ-uals categorized into four classes based on their CD4+ T cell counts and viral loads. They found that specific miRNA signatures, including miRNA-29s, can be observed for each class [12]. Having observed that HIV-1 infection is associated with altered patterns of miRNA-29 expression, we tried to evaluate whether this phenomenon would affect the plasma viral load and CD4+ T cell count. In a first analysis, we did not find any significant association be-tween miRNA-29 expression levels and plasma HIV RNA levels. This observation is in agreement with Witwer et al., who found no correlations with viral load in the viraemic group, although miRNA-29a has been reported to silence HIV-1in vitro[7-9]. We also failed to find any significant association between miRNA-29s expression and CD4+ T cell count, whereas Witwer et al.’s study found both negative and positive correlations between several miR-NAs, including miRNA-29a, and CD4+ T cell counts. However, this correlation was only present when elite suppressor, not included in our study population, and viraemic patients were grouped together. To further analyze the relationship between miRNA-29s expression and the viro-immunological markers of HIV-1 infection, we grouped the chronically HIV-1-infected patients on the basis of their plasma HIV RNA and CD4+ T cell count, to represent different stages of the infection. Al-though there was no significant difference in expression levels of miRNA-29a and miRNA-29b between patients with more or less severe HIV-1 infection, interestingly we found that miRNA-29c levels were related to both
viral load and CD4+ T cell count. Indeed, patients ex-pressing lower levels of miRNA-29c also had higher levels of viraemia and lower levels of CD4+ T cell count, sug-gesting a strong relation between miRNA-29c and these clinical markers of HIV-1 infection. This relation may imply that baseline lower levels of miRNA-29c expres-sion in some individuals could negatively influence the progression of HIV-1 infection. Alternatively, the pres-ence of HIV-1 or the host response against HIV-1 may reduce miRNA-29c expression, by inducing CD4+ T-cell depletion.
Several studies reported that the onset of HIV-1 la-tency could be influenced by cellular miRNA [27], but the role of miRNA-29s in controlling this phenomenon has not been well characterized. For the first time to our knowledge, our results show that miRNA-29c expression levels are significantly and negatively correlated with levels of integrated HIV-1 DNA. Thus, in our study population, patients with lower levels of miRNA-29c not only showed higher levels of plasma viraemia and a lower CD4+ T cell count, but also had higher levels of HIV-1 DNA, confirming the association between low levels of expression of miRNA-29c and poor prognosis. Probably, the higher rate of proliferation observed in patients with a lower CD4+ T cell count led to a larger overall reservoir size. On the other hand, we cannot exclude that by sup-pressing HIV-1 production miRNA-29a could regulate viral gene expression, modulating the viral life cycle and promoting the onset and maintenance of latency. More-over, given that we found the same significant trend in miRNA-29a levels, miRNA-29a and miRNA-29c could influence HIV-1 latency by a common mechanism. How-ever, miRNA-29a-c and HIV-1 DNA integrated levels were quantified only in total PBMCs, and may have missed differences in various cell types, such as resting central memory T cells and translational memory T cells, which serve as major sites for HIV-1 latency [28].
negatively correlated with CD4+ T cell count [13]. Fur-ther studies are needed to characterize the effects of HIV-1 on miRNA-29s expression in PBMC and specific cell types both in vivo and, as far as possible, in primary culture ex vivo.
Our study is also the first to evaluate the influence of miRNA-29b on the expression of different isoforms of a novel anti-HIV cytokine, namely IL-32, during chronic HIV-1 infection. Given that six isoforms of IL-32 have been identified, we chose to detect IL-32αand the other IL-32 isoforms (β,γ, δ,ε, ζ) separately, using a real time PCR assay previously developed in our laboratory [17]. We found a weak inverse correlation between miRNA-29b and IL-32nonαlevels in PBMC collected from HIV-1-infected patients, whereas no significant correlation was found with IL-32α levels, suggesting that miRNA-29b specifically targets other isoforms of IL-32. Our data are in agreement with those reported by Li and coworkers, who showed that miRNA-29b and IL-32 mRNA levels were negatively correlated in PBMC samples from HBV-infected patients [18]. However, further analyses will be needed to confirm the presence of these relationships with a larger sample size of HIV-1 infected patients and to identify which specific isoform/isoforms of IL-32 is/are regulated by miRNA-29b.
One of the tools used by IL-32 to fight viruses, includ-ing HIV-1, is its ability to induce MxA expression [17]. We previously demonstrated that IL-32γ can significantly induce expression of IFN stimulating genes (ISGs), includ-ing MxA, in PBMC collected from healthy donors, al-though to a lower extent than IFNα2b [17]. Moreover, recent reports showed that IL-32 exerts its antiviral activity through the induction of IFN-λ1 and IFN-β expression, which in turn act by inducing ISGs [18,19]. Thus, we eval-uated the influence of miR-29b expression on the tran-script levels of MxA in HIV-infected patients. As expected, patients expressing higher levels of miRNA-29b showed lower levels of MxA, confirming that MxA induction is regulated by IL-32, both directly and through a type I and III IFN-mediated pathway. Interestingly, we also found that CD4+ T lymphocytes as well as CD14+ monocytes were capable of producing miRNA-29b, IL-32 isoforms and MxA indicating that these cellular subsets were involved in the activation of the IL-32- and IFN-mediated antiviral re-sponse during HIV-1 infection. Taken together, these data suggest that the up-regulation of miRNA-29b observed in HIV-infected patients has a strong negative impact on the antiviral immune response and that the virus may take ad-vantage of the change in the normal cell miRNA profile. On the other side, considering the complex and to some extent controversial role played by IFN-α/βin HIV-1 dis-ease [30], our results indicated that miRNA-29b would contribute to the regulation of the rate of IFN activation by suppressing the IL-32 nonαisoforms levels during HIV-1
infection. However, several cellular pathways are regu-lated by both miRNA-29 and IFN subtypes highlighting the complexity of phenomenon analyzed [31-33]. In this regards, miRNA-29 can regulate and activate T-box transcription factors and IFN-γproduction in helper T cells [31]. Furthermore, epigenetic changes mediated by miRNA-29 can induce IFN-λ1 production during viral infection and the suppression of the IFN-α receptor expression can be mediated by miRNA-29 in thymic epithelium to increase the threshold for infection-associated thymic involution [32,33].
In conclusion, we showed that transcription levels of all mature members of the miRNA-29 family are highly vari-able in HIV-1-infected patients and that the miRNA-29b expression pattern is altered in this population compared to healthy individuals. We also found that miRNA-29c ex-pression is closely correlated with markers of HIV-1 clin-ical outcome, such as plasma viral load and CD4+ T cell count, and that both miRNA-29a and miRNA-29c could affect the HIV-1 proviral load. In addition, we demon-strated that miRNA-29b levels influence the rate of IL-32nonαand MxA expression, highlighting the role of the miRNA-29 family as a double-edged sword duringin vivo HIV-1 infection.
Competing interests
The authors declare that they have no competing interests.
Authors’contributions
KM wrote the paper, carried out the experiments and performed statistical analysis. CSelvaggi, GC, FF collected the samples and participated in carrying out the experiments. IM and GD provided the patients’samples and participated in the design and revision of the manuscript. OT, VV, GA participated in the design and revision of the manuscript. CScagnolari conceived the study, analyzed the data, wrote the paper and supervised the work. All authors reviewed the work and approved the final manuscript.
Acknowledgements
This work was supported by a grant to Carolina Scagnolari from ISTITUTO PASTEUR, FONDAZIONE CENCI BOLOGNETTI (Research programme funding 2013–2015, Prot. 55/2013), which also awarded a scholarship to Katia Monteleone.
Author details
1
Pasteur Institute-Cenci Bolognetti Foundation, Department of Molecular Medicine, Laboratory of Virology, Sapienza University of Rome, Viale di Porta Tiburtina n 28, 00185 Rome, Italy.2Department of Clinical Medicine, Sapienza University of Rome, Rome, Italy.3Department of Public Health and Infectious
Diseases, Sapienza University of Rome, Rome, Italy.
Received: 4 July 2014 Accepted: 16 January 2015
References
1. He L, Hannon GJ. MicroRNAs: small RNAs with a big role in gene regulation. Nat Rev Genet. 2004;5:522–31.
2. Triboulet R, Mari B, Lin YL, Chable-Bessia C, Bennasser Y, Lebrigand K, et al. Suppression of microRNA-silencing pathway by HIV-1 during virus replication. Science. 2007;315:1579–82.
3. Zhou R, Rana TM. RNA-based mechanisms regulating host-virus interactions. Immunol Rev. 2013;253:97–111.
5. Huang J, Wang F, Argyris E, Chen K, Liang Z, Tian H, et al. Cellular microRNAs contribute to HIV-1 latency in resting primary CD4+ T lymphocytes. Nat Med. 2007;13:1241–7.
6. Liston A, Papadopoulou AS, Danso-Abeam D, Dooley J. MicroRNA-29 in the adaptive immune system: setting the threshold. Cell Mol Life Sci. 2012;69:3533–41.
7. Hariharan M, Scaria V, Pillai B, Brahmachari SK. Targets for human encoded microRNAs in HIV genes. Biochem Biophys Res Commun. 2005;337:1214–8. 8. Ahluwalia JK, Khan SZ, Soni K, Rawat P, Gupta A, Hariharan M, et al. Human cellular microRNA hsa-miR-29a interferes with viral nef protein expression and HIV-1 replication. Retrovirology. 2008;5:117.
9. Nathans R, Chu CY, Serquina AK, Lu CC, Cao H, Rana TM. Cellular microRNA and P bodies modulate host-HIV-1 interactions. Mol Cell. 2009;34:696–709. 10. Sun G, Li H, Wu X, Covarrubias M, Scherer L, Meinking K, et al. Interplay
between HIV-1 infection and host microRNAs. Nucleic Acids Res. 2012;40:2181–96.
11. Hayes AM, Qian S, Yu L, Boris-Lawrie K. Tat RNA silencing suppressor activity contributes to perturbation of lymphocyte miRNA by HIV-1. Retrovirology. 2011;8:36.
12. Houzet L, Yeung ML, de Lame V, Desai D, Smith SM, Jeang KT. MicroRNA profile changes in human immunodeficiency virus type 1 (HIV-1) seropositive individuals. Retrovirology. 2008;5:118.
13. Witwer KW, Watson AK, Blankson JN, Clements JE. Relationships of PBMC microRNA expression, plasma viral load, and CD4+ T-cell count in HIV-1-infected elite suppressors and viremic patients. Retrovirology. 2012;9:5. 14. Nold MF, Nold-Petry CA, Pott GB, Zepp JA, Saavedra MT, Kim SH, et al.
Endogenous IL-32 controls cytokine and HIV-1 production. J Immunol. 2008;81:557–65.
15. Rasool ST, Tang H, Wu J, Li W, Mukhtar MM, Zhang J, et al. Increased level of IL-32 during human immunodeficiency virus infection suppresses HIV replication. Immunol Lett. 2008;117:161–7.
16. Smith AJ, Toledo CM, Wietgrefe SW, Duan L, Schacker TW, Reilly CS, et al. The immunosuppressive role of IL-32 in lymphatic tissue during HIV-1 infection. J Immunol. 2011;186:6576–84.
17. Monteleone K, Di Maio P, Cacciotti G, Falasca F, Fraulo M, Falciano M, et al. Interleukin-32 isoforms: expression, interaction with interferon-regulated genes and clinical significance in chronically HIV-1-infected patients. Med Microbiol Immunol. 2014;203:207–16.
18. Li Y, Xie J, Xu X, Liu L, Wan Y, Liu Y, et al. Inducible interleukin 32 (IL-32) exerts extensive antiviral function via selective stimulation of interferonλ1 (IFN-λ1). J Biol Chem. 2013;288:20927–41.
19. Nakayama M, Niki Y, Kawasaki T, Takeda Y, Ikegami H, Toyama Y, et al. IL-32-PAR2 axis is an innate immunity sensor providing alternative signaling for LPS-TRIF axis. Sci Rep. 2013;3:2960.
20. Zepp JA, Nold-Petry CA, Dinarello CA, Nold MF. Protection from RNA and DNA viruses by IL-32. J Immunol. 2011;186:4110–8.
21. Ruelas DS, Greene WC. An integrated overview of HIV-1 latency. Cell. 2013;155:519–29.
22. Scagnolari C, Midulla F, Pierangeli A, Moretti C, Bonci E, Berardi R, et al. Gene expression of nucleic acid-sensing pattern recognition receptors in children hospitalized for respiratory syncytial virus-associated acute bronchiolitis. Clin Vaccine Immunol. 2009;16:816–23.
23. Liszewski MK, Jianqing J, O’Doherty U. Detecting HIV-1 integration by repetitive-sampling Alu-gag PCR. Methods. 2009;47:254–60.
24. Viard JP, Burgard M, Hubert JB, Aaron L, Rabian C, Pertuiset N, et al. Impact of 5 years of maximally successful highly active antiretroviral therapy on CD4 cell count and HIV-1 DNA level. AIDS. 2004;18:45–9.
25. Zhang X, Azhar G, Wei JY. The expression of microRNA and microRNA clusters in the aging heart. PLoS One. 2012;7:e34688.
26. Kriegel AJ, Liu Y, Fang Y, Ding X, Liang M. The miR-29 family: genomics, cell biology, and relevance to renal and cardiovascular injury. Physiol Genomics. 2012;44:237–44.
27. Swaminathan G, Navas-Martín S, Martín-García J. MicroRNAs and HIV-1 infection: antiviral activities and beyond. J Mol Biol. 2014;426:1178–97. 28. Van Lint C, Bouchat S, Marcello A. HIV-1 transcription and latency: an
update. Retrovirology. 2013;10:67.
29. Rossi RL, Rossetti G, Wenandy L, Curti S, Ripamonti A, Bonnal RJ, et al. Distinct microRNA signatures in human lymphocyte subsets and enforcement of the naive state in CD4+ T cells by the microRNA miR-125b. Nat Immunol. 2011;12:796–803.
30. Hughes R, Towers G, Noursadeghi M. Innate immune interferon responses to human immunodeficiency virus-1 infection. Rev Med Virol. 2012;22:257–66. 31. Steiner DF, Thomas MF, Hu JK, Yang Z, Babiarz JE, Allen CD, et al.
MicroRNA-29 regulates T-box transcription factors and interferon-γproduction in helper T cells. Immunity. 2011;35(2):169–81.
32. Fang J, Hao Q, Liu L, Li Y, Wu J, Huo X, et al. Epigenetic changes mediated by microRNA miR29 activate cyclooxygenase 2 and lambda-1 interferon production during viral infection. J Virol. 2012;86(2):1010–20.
33. Papadopoulou AS, Dooley J, Linterman MA, Pierson W, Ucar O, Kyewski B, et al. The thymic epithelial microRNA network elevates the threshold for infection-associated thymic involution via miR-29a mediated suppression of the IFN-αreceptor. Nat Immunol. 2011;13(2):181–7.
Submit your next manuscript to BioMed Central and take full advantage of:
• Convenient online submission
• Thorough peer review
• No space constraints or color figure charges
• Immediate publication on acceptance
• Inclusion in PubMed, CAS, Scopus and Google Scholar
• Research which is freely available for redistribution