R E S E A R C H A R T I C L E
Open Access
Bimodal signatures of germline methylation are
linked with gene expression plasticity in the coral
Acropora millepora
Groves B Dixon
1*, Line K Bay
2,3and Mikhail V Matz
4Abstract
Background:In invertebrates, genes belonging to dynamically regulated functional categories appear to be less methylated than“housekeeping”genes, suggesting that DNA methylation may modulate gene expression plasticity. To date, however, experimental evidence to support this hypothesis across different natural habitats has been lacking.
Results:Gene expression profiles were generated from 30 pairs of genetically identical fragments of coralAcropora milleporareciprocally transplanted between distinct natural habitats for 3 months. Gene expression was analyzed in the context of normalized CpG content, a well-established signature of historical germline DNA methylation. Genes with weak methylation signatures were more likely to demonstrate differential expression based on both transplant environment and population of origin than genes with strong methylation signatures. Moreover, the magnitude of expression differences due to environment and population were greater for genes with weak methylation signatures.
Conclusions:Our results support a connection between differential germline methylation and gene expression flexibility across environments and populations. Studies of phylogenetically basal invertebrates such as corals will further elucidate the fundamental functional aspects of gene body methylation in Metazoa.
Keywords:Acropora millepora, Coral, DNA methylation, Gene body methylation, Gene expression, Flexibility, Plasticity
Background
Phenotypic plasticity refers to the ability of an individual to adjust its phenotype in response to environmental cues [1]. Under changing environmental conditions, the-ory predicts that phenotypic plasticity may mitigate loss of fitness [2], and facilitate evolutionary adaptation [3,4]. For sessile organisms such as plants and corals, plasticity is predicted to be of particular importance, as these organ-isms cannot migrate away from suboptimal environments [5,6]. In the table top coral Acropora hyacinthus, colony fragments with previous exposure to elevated tempera-tures demonstrate increased bleaching resistance, suggest-ing an important role of plasticity in coral heat tolerance [7]. Hence predicting the future of reef-building corals and the ecosystems they support requires an understand-ing of their mechanisms of phenotypic plasticity. In most marine organisms, however, the molecular mechanisms
that translate environmental stimuli into appropriate cel-lular responses are poorly understood [8]. One possible plasticity-modulating mechanism that is yet to be investi-gated in corals is DNA methylation [9-11].
DNA methylation is a widely conserved epigenetic mo-dification involved in eukaryotic gene regulation [12]. In mammals, the majority (70-80%) of CG dinucleotides are methylated, with the exception of stretches of sequence rich in CG dinucleotides called CpG islands (CGIs) [13]. CGIs are generally not methylated, but can be targeted for methylation under particular conditions [14]. When me-thylation of CGIs occurs, its effect on transcription is based on the proximity of the CGI to a transcription start site (TSS), inhibiting initiation of transcription when near the TSS but not when far away from it [15]. There is evi-dence that this form of epigenetic regulation is involved in genome-environment interactions. DNA methylation is associated with persistent stress-induced gene expression in mice [16] and humans [17], as well as in plants [18]. It * Correspondence:grovesdixon@utexas.edu
1
Institute for Cell and Molecular Biology, University of Texas Austin, Austin, USA
Full list of author information is available at the end of the article
has also been linked with variation in disease development [19] and mediating phenotypic differences between mono-zygotic twins [20,21].
In contrast to nearly ubiquitous methylation in mam-malian genomes, genomic methylation in many inverte-brates occurs specifically on CpG dinucleotides within gene bodies (also called transcription units) [22,23]. With-in gene bodies, methylation occurs primarily on exons rather than introns [24-26]. Density of gene body methy-lation is not equivalent across genes. Studies of multiple invertebrate taxa report bimodal patterns of gene body methylation, in which genes are separated into hyper-methylated and hypohyper-methylated classes [23,27,28]. Ana-lyses of gene ontology (GO) terms in the context of these methylation classes have demonstrated characteristic divi-sions based on gene function. Basic biological functions with similar regulatory dynamics across tissue types and developmental stages tend toward strong methylation. Ex-amples of basic biological functions include cellular meta-bolic processes, nucleic acid metabolism, and translation [28-30]. In contrast, functions that are dynamically regu-lated across tissues and developmental stages tend toward sparse methylation [31-33]. Examples of dynamically regu-lated functions include development, cell-cell signaling, and signal transduction [29,30]. These findings suggest that bimodal gene body methylation may regulate flexibil-ity of gene expression, with strongly methylated genes marked for stability and weakly methylated genes marked for flexibility. DNA methylation has also been linked with phenotypic plasticity, most strikingly in caste development in honeybeesApis mellifera,which is dependent on lar-val diet and activity ofde novoDNA methyl-transferase (DNMT3) [34,35]. Caste-specific genes in honeybees (i.e. genes with significant differential expression between queens and workers) are significantly biased toward weak methylation [31].
These findings have led to the hypothesis that inver-tebrate DNA methylation is involved in regulating en-vironmentally driven gene expression and phenotypic plasticity [9,11]. Among marine invertebrates, this hy-pothesis has yet to be validated in natural ecological contexts. In this study, we predicted that environmen-tally flexible gene expression in the branching coral Acropora milleporawould be associated with signatures of weak gene body methylation. To test this prediction we analyzed gene expression profiles from clonal colony fragments reciprocally transplanted between distinct nat-ural habitats. We show that elevated CpG content, a sig-nature of historically weak germline methylation, is linked with environmentally driven gene expression. Our results suggest a potential role of DNA methylation in modu-lating the balance between stable gene expression re-quired for homeostasis and flexible expression rere-quired for plasticity.
Results
Normalized CpG content of coding regions is bimodally distributed inA. millepora
Normalized CpG content (CpGO/E; see methods) is a
well-established evolutionary signature of DNA methyla-tion [23,25,28,36]. We used this metric to estimate the strength of methylation of the coding regions of 15,221 genes across the A. millepora transcriptome. Because 5-methylcytosines are hypermutable [37], and invertebrate DNA methylation occurs specifically on CpG dinucleo-tides, sequences that are methylated in the germline are predicted to become CpG deficient over evolutionary time [38]. As a result, CpGO/E values are inversely re-lated to the degree of historical germline methylation. Low CpGO/E values indicate strong methylation while high CpGO/E values indicate weak methylation. Impor-tantly, CpGO/E has been shown to strongly correlate with direct measures of somatic DNA methylation in a number of animal models [23,25,28,36].
Using this metric, we found a characteristic bimodal pattern in which one set of genes is predicted to have strong germline methylation and a second is predicted to have weak germline methylation. For the distribution of CpGO/Evalues, a two-component mixture model provided substantially better fit than a single component model [Additional file 1] and as a consequence, we modeled the distribution with a two-component model (Figure 1A). We refer to the two components of the distribution as the
low-CpGO/E and high-CpGO/E components. Means for
the fitted component curves were estimated as 0.36 for the low-CpGO/Ecomponent and 0.74 for the high-CpGO/E component. Genes were assigned to either component based on the intersection of the fitted component curves
at 0.46. Genes within the low-CpGO/E component are
predicted to be strongly methylated and genes in the high-CpGO/Ecomponent are predicted to be weakly me-thylated. As a control, we showed that normalized content for GpC dinucleotides (which are not expected to be targeted for methylation) was unimodally distributed (Figure 1B). Also, as expected under the predicted mu-tational pattern for 5-methylcytosine (substitution for thymine as a result of deamination [37]), normalized TpG content showed an inverse linear relationship with CpGO/E(Figure 1C).
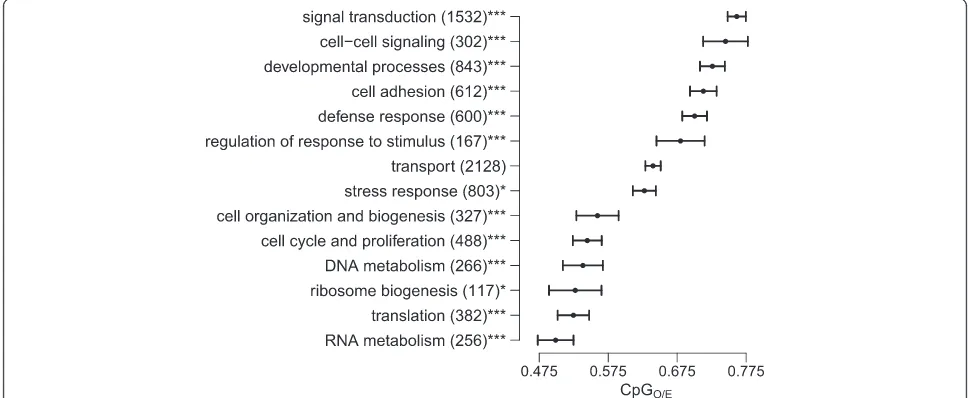
CpGO/Eshows characteristic associations with different biological processes
translation, ribosome biogenesis, DNA metabolism, cell cycle and proliferation, and cellular organization and biogenesis tended toward low CpGO/Evalues, indicating strong germline methylation. Genes associated with sig-nal transduction, cell-cell sigsig-naling, developmental pro-cesses, cell adhesion, defense response and regulation of response to stimulus tended toward high CpGO/E, indicating weak germline methylation. Genes associ-ated with stress response showed intermediate mean
CpGO/E but were enriched in the high-CpG
compo-nent (p< 0.05).
High CpGO/Eis linked with environmentally flexible gene expression
To investigate the relationship between environmentally
induced gene expression and CpGO/E, we used DEseq
[image:3.595.58.541.89.259.2][39] to compare gene expression between groups of clo-nal colony fragments reciprocally transplanted between two environmentally distinct natural habitats. Fifteen colonies were collected from each site and divided into two halves. One half of each colony was replaced in its native habitat, while the second half was transplanted to the alternate site (transplant location). In this way each Figure 1Signatures of gene body methylation are bimodally distributed in the coral. (A)Distribution of genes based on normalized CpG content. The green curve indicates the low-CpG component (predicted to be strongly methylated). The red curve indicates the high-CpG component (predicted to be weakly methylated). The black dotted line separates the two components at the point of intersection between the curves.(B)Distribution of genes based normalized GpC content. In contrast to CpG dinucleotides, GpCs are not targeted for methylation so a normal distribution is expected.(C)Negative linear relationship between CpGO/Eand TpGO/E. This is consistent with the prediction that DNA
methylation causes depletion of CpG content largely though substitution of methylated cytosines for thymine.
Figure 2Variation of CpGO/Eamong genes assigned to different biological processes.Each bar represents mean CpGO/Efor the indicated
[image:3.595.55.539.495.694.2]genotype, represented by the two halves of the original colony, was exposed to both sites for a three-month study period. Following three months, global gene ex-pression profiles were generated from all colony halves using tag-based RNA-seq method [40]. To detect effects of environment we compared gene expression between samples halves grouped by the transplantation site (the site they were placed at during the study period). In this way, the two groups being compared represented the same 30 genotypes exposed to two different environ-ments for the three-month period. This allowed us to
at-tribute systematic differences in gene expression
between the two groups to environmental influences. To test the effect of population of origin we grouped the samples halves based on the site they originated from regardless of their transplant location during the study period. This allowed us to test for differences in gene expression that were distinctive of the two popula-tions irrespective of environment. Expression data for each sample and estimates of differential expression be-tween sample groups were uploaded through Zenodo at the following address [DOI] (http://dx.doi.org/10.5281/ zenodo.12626) and will be available after June 1st 2015 or earlier. The read files have been uploaded the NCBI
SRA (accession SRP049522) and will be released by No-vember 11th 2015 or earlier.
[image:4.595.60.540.395.636.2]When sample halves were grouped based on trans-plantation site, 321 genes showed significant differential expression between the two groups (adjusted p< 0.01). We refer to this set of differentially expressed genes as ‘environmentally flexible genes’, since they are regulated depending on which site the sample halves were placed at. Environmentally flexible genes were significantly over-represented within the high-CpG component (Figure 3A and Table 1). Thus genes showing signatures of weak germline methylation were more likely to display environ-mentally driven variation in expression. To assess this relationship on a continuous scale we plotted CpGO/E against the magnitude of differential expression for each gene, calculated as [log(mean expression in environ-ment A/mean expression in environenviron-ment B)]. Differen-tial expression was positively correlated with CpGO/E (Spearman's rank correlation; rho = 0.138; p< < 0.0001; Figure 3B). To examine if this was a simple linear rela-tionship genes were divided into twelve quantiles based on CpGO/E and mean differential expression was plot-ted for each quantile. This analysis revealed that the magnitude of differential expression increased sharply
Figure 3Genes with high CpGO/Eare more likely to be differentially expressed between environments. (A)Frequency of environmentally
flexible genes increases with CpGO/E. All genes with expression data were divided into 25 quantiles based on CpGO/E(503 genes per quantile).
Each data point represents the count of environmentally flexible genes (adjustedP-value < 0.01) within a single quantile and the mean CpGO/Efor
the quantile. To illustrate associations with the CpGO/Ecomponents, the density component curves from figure 1A were traced over the count
data.(B)Across all genes the magnitude of differential expression due to environment (environment effect) showed a positive relationship with CpGO/E. The red line indicates the linear model of the relationship between environmental effect and CpGO/E. Black error bars represent the mean
and standard error for environmental effect of 12 quantiles based on CpGO/E.(C)Same as(B), rescaled to illustrate that mean environment effect
within the high-CpGO/E component (Figure 3C), sug-gesting that differential expression correlates categoric-ally with CpGO/E component rather than continuously with increasing CpGO/E.
Link between CpGO/Eand population-specific gene expression
As differential expression due to transplantation site showed strong bias towards high CpGO/E, we performed the same analyses on differential expression with respect to sample origin. Here we compared gene expression between sample halves grouped based on their site of origin. We found 68 genes that maintained origin-specific expression patterns (adjusted p< 0.01) irrespective of transplantation site. Differential expression due to sample origin showed similar positive associations with CpGO/E (Figure 3 D-F; Table 1).
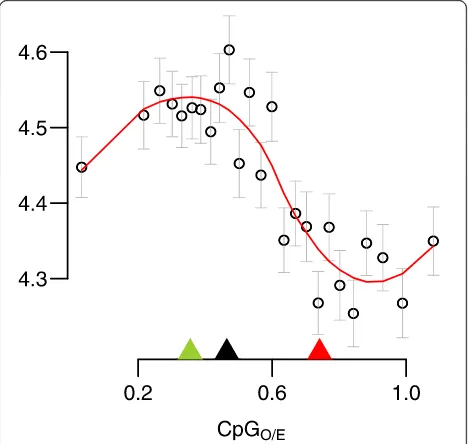
CpGO/Eand gene expression level
To investigate broad scale relationships between the mag-nitude of gene expression and CpGO/E, we plotted mean transcript abundance (across all samples) for each gene against its CpGO/Evalue (Figure 4). Genes were divided into 25 equally sized quantiles based on CpGO/E. Mean transcript abundance varied significantly across CpGO/E quantiles (ANOVA p< < 0.0001) and genes in the
high-CpGO/E component showed decreased mean expression
compared genes in the low-CpGO/E component (Welch
Two Sample t-test;p< < 0.0001).
Discussion
Bimodal patterns of gene body methylation as an ancestral feature among Metazoa
Depletion of CpG dinucleotides, a signature for historic germline DNA methylation, is widespread inA. millepora and follows a characteristic bimodal pattern. Notably, even for the high CpGO/Ecomponent, the mean CpGO/Evalue of 0.74 was less than 1.0, suggesting that these genes also bear signatures of germline methylation, although
[image:5.595.56.542.100.239.2]apparently weaker than genes in the low-CpGO/E compo-nent. As shown by Sarda et al. [28], bimodal methylation is consistent among diverse invertebrate taxa: reported in Hymenoptera [30,31], Hemiptera [33], Lepidoptera [36], Orthoptera [27], Mollusca [29], and Cnidaria [23,28, This study]. Evidence of bimodal methylation in Cnidaria (the sister group to all bilaterians) along with other di-verse taxa suggests an ancient mechanism that has been conserved through more than 500 million of years of evolution [41].
Table 1 Enrichment of differentially expressed genes in the high-CpG component
Effect Effect Low-CpG High-CpG P
Cut-off Significant Not significant Significant Not significant
Environment 0.1 305 3994 667 7636 3.25E-02
Environment 0.05 185 4114 494 7809 4.77E-05
Environment 0.01 67 4232 254 8049 9.72E-08
Environment 0.001 25 4274 108 8195 6.65E-05
Origin 0.1 95 4204 264 8039 9.64E-04
Origin 0.05 46 4253 149 8154 8.74E-04
Origin 0.01 13 4286 55 8248 4.87E-03
Origin 0.001 0 4299 18 8285 5.44E-04
Effect Cut-off designates theαlevel used to designate significant differential expression due to transplantation site (environment).Pcolumn designatesP-values for enrichment of environmentally flexible genes in the high-CpG were calculated using Fisher’s exact test.
Figure 4Correlation of CpGO/Ewith transcript abundance.Mean
gene expression values were generated from 25 equally sized quantiles based on CpGO/E. Each gene was assigned an expression
value equal to its average expression across all samples. Each data point represents mean of the expression values for all genes included in the quantile plotted against mean CpGO/Efor the
[image:5.595.305.539.404.626.2]Correlation between CpGO/Eand Gene Function inA. millepora
Consistent with previous findings among diverse inverte-brates [28-31], we found significant variation in CpGO/E between different biological processes. The distribution follows a characteristic trend in which functions with spatial and temporal stability are enriched in the low-CpGO/Ecomponent, implying strong methylation. Func-tions with greater spatial and temporal variability are enriched in the high-CpGO/Ecomponent, implying weak methylation. Thus our results add to previous findings and suggest an association between weak gene body me-thylation and dynamic biological processes. In light of these results it was surprising that the GO term stress response showed an intermediate mean CpGO/E and only slight enrichment in the high-CpGO/E component (Figure 2). This contrasts with results from Gavery and Roberts [29], where stress response genes showed ele-vated CpGO/E. It is possible that the intermediate value forstress response in our system is related to regularity with which reef-building corals must contend with cel-lular stress. Unlike to other invertebrates examined for CpGO/Epreviously, scleractinian corals are host to photo-synthetic endosymbionts (Symbiodiniumspp.) [42]. While the coral host depends on endosymbionts for fixed car-bon, their daily photosynthetic activity causes a hyperoxic cellular environment, so that host cells are regularly ex-posed to oxidative stress [43]. The relatively low mean CpGO/Efor stress response inA. milleporacould possibly reflect historical methylation of cellular stress response genes that require highly regular expression patterns to mediate chronic stresses of symbiosis. To support this,
we compared mean CpGO/Eof GO terms nested within
stress response and found thatoxidative stress,response to wounding, and cellular response to stress had the lo-west mean CpGO/Evalues [see Additional file 2]. A re-cent comparison of gene expression in sea anemone (Aiptasia) revealed that along withresponse to oxidative stress, genes involved inInflammation, tissue remodeling, and response to wounding, showed strong differential ex-pression between symbiotic and asymbiotic individuals [44]. After removal of genes associated with response to oxidative stress and cellular response to stress, the remaining 426 stress response genes were substantially enriched in the high-CpGO/E component (Fisher’s exact testp< 0.001). These results suggest the interesting possi-bility that invertebrates possess taxon-specific methyla-tion patterns based on the demands of their particular life histories.
Link between CpGO/Eand gene expression plasticity
In insects, weakly methylated status is linked with vari-ation in gene expression across tissue types [32], caste [31], and developmental stages [25], and a similar trend
across tissues types been shown in oysters (Crassostrea gigas) [45]. However, whether the same association is found regarding variation in gene expression across dif-ferent habitats remained unresolved. Here we show that inA. millepora, genes with high CpGO/Evalues are more likely to be differentially expressed in response to environ-mental conditions (Figure 3A and Table 1). High-CpGO/E genes also show greater magnitude of expression change in response to the environment (Figure 3B-C). To the ex-tent that CpGO/Escores correlate with gene body methyla-tion in somatic cells at the time of sampling, these results suggest a link between weak gene body methylation and gene expression plasticity.
Roberts and Gavery [11] proposed a role for gene body methylation in modulating plasticity in which weak gene body methylation passively facilitates flexible gene expres-sion via alternative transcription start sites (TSSs), in-creased sequence mutations, exon skipping, or through transient gene methylation. Our results are consistent with the general hypothesis that weak gene body methyla-tion facilitates environmentally responsive expression. To offer a potential mechanism, weak methylation could in-crease expression plasticity by allowing greater access to alternative TSSs. Among developmental genes in Dros-ophila melanogaster, alternative promoter use is quite common and can mediate temporally regulated expression [46]. In mammals, alternative promoter use is associa-ted with tissue specific expression and can be regulaassocia-ted though methylation of intragenic CGIs [47]. Alternative TSSs could respond differently to regulatory elements and environmental cues, thereby permitting more complex and responsive transcriptional regulation. As proposed by Elango et al. [31], high CpGO/Egenes also could be more amenable to epigenetic modulation. Here genes that are generally weakly methylated could be conditionally meth-ylated to mediate environmentally responsive expression. This mechanism would be of particular interest if me-thylation patterns were shown to fluctuate in response to environmental cues. Because CpGO/E is an evolutionary signature reflecting historical methylation rather than the particular state at the time of sampling, this is a possibility that our approach could not address. An alternative hy-pothesis is that gene body methylation has little or no regulatory effects and is simply a byproduct of transcrip-tional patterns mediated by other mechanisms. Further experimentation will be required to resolve the potential explanations.
Link between CpGO/Eand population-specific expression
maintained irrespective of transplant site). Our initial expectation was to find enrichment of low-CpGO/Egenes among these stably expressed origin-specific genes; how-ever, we found that these genes tended toward high CpGO/E similarly to the environmentally flexible genes (Figure 3D-E).
Since previous studies have demonstrated genetic struc-ture between the Orpheus and Keppel populations [48], the simplest explanation of the origin-specific expression differences is that they result from genetic divergence. If this is the case, an intriguing possibility is that gene body methylation may help to stabilize expression pat-terns across divergent genetic backgrounds. Such buff-ering against genetic variation would be similar to the function of the heat shock protein 90 [49], except at the level of transcription rather than at the level of pro-tein structure.
CpGO/Eshows negative relationship with mean expression level
Although the difference was subtle, genes in the low-CpGO/Ecomponent (indicating strong germline methyla-tion) showed higher average expression (Figure 4). This could be attributed to the ubiquitous expression of low-CpGO/E “housekeeping” genes, whereas the expression of many high-CpGO/E genes is restricted to certain cell types and thus might appear lower on the scale of the whole organism. It is also possible that gene body me-thylation lowers gene expression noise, as has been shown in human blood and brain tissue [50], potentially leading to less frequent“off” state and thus higher ave-rage expression of low-CpGO/E genes. A similar trend has been shown in the yeast (Saccharomyces cerevisiae) where transcriptional noise is negatively associated with protein abundance, and genes involved responding to the environment show elevated noise compared to genes involved in protein synthesis [51].
The link between predicted methylation and elevated expression contrasts with results from Riviere et al. [52], in which methylation of homeobox genes of oysters during development was inversely related to mRNA abundance. They suggest that in the case of these de-velopmental genes a‘CpG-island-like’mechanism of gene repression could be responsible decreasing mRNA abun-dance. Hence it does not seem that gene body methylation leads to increased expressionper seand the trend we de-scribe is more likely due to enrichment with ubiquitously expressed housekeeping genes and not to a methylation-driven increase in expression of low-CpGO/Egenes.
Corals as a model to study ecological roles of gene body methylation
Reef-building corals, as phylogenetically basal meta-zoans with a well-studied ecology and emerging genomic
resources, represent an excellent study system to address the function of gene body methylation. Unlike most other animal models, corals can be fragmented into clonal repli-cates and transplanted across natural environments, mak-ing it possible to disentangle environmental and genotypic effects on genome-wide processes in realistic ecological contexts [53]. Corals can also be crossed in the lab to generate full-sib families of larvae and juveniles, which enables studies of how gene body methylation becomes established and facilitates quantitative genetic analysis [54]. Lastly, understanding the role of DNA methylation in phenotypic plasticity of corals has important conser-vation implications. Phenotypic plasticity is predicted to significantly influence evolutionary responses to climate change [55] and corals, the foundation of the most biolo-gically diverse ecosystem in the ocean, are among the spe-cies most vulnerable to extinction [56].
Conclusions
Our results indicate a connection between historical ger-mline methylation and gene expression flexibility across environments and populations. As a whole our results are consistent with a hypothesis that strong gene body methylation leads to more stable gene expression while weak methylation facilitates flexible expression, although the direction of causality remains to be confirmed. Stud-ies of phylogenetically basal invertebrates such as corals will further elucidate the fundamental functional aspects of gene body methylation in Metazoa.
Methods
Genomic resources
Coding sequences were extracted from the A.
from these references were transferred to the query se-quence in our dataset. GO annotations were further supplemented with GO terms based on BLASTx matches (e-value cutoff of 10−10) to the SwissProt Protein database [61]. Coding sequences with no annotations were ex-cluded from the analysis. As gene length can influence the validity of CpGO/E as a predictor of methylation status [25], and DNA methylation tends to decrease toward the 3’ end of invertebrate gene bodies [23,26], we controlled for differences in transcript length by examining CpG content only in the first 1 kb of the coding regions of each gene. Sequences shorter than 300 bp (2500 in total) were also excluded from the analysis. CpG values were bounded between 0.001 and 2, so that 1 gene with a value of 2.08 was excluded and 89 with values below 0.001 were excluded.
CpGO/Eclass assignment
To predict gene body methylation in A. millepora, we used normalized CpG content (CpGO/E) calculated as in Elangoet al. [31].
CpGO=E¼ PCpG
PCPG
ð Þ
WherePCpG, PCandPGare the frequencies of CpG di-nucleotides, C di-nucleotides, and G nucleotides respect-ively. Because 5-methylcytosines are hypermutable [37], and invertebrate DNA methylation is targeted specific-ally to CpG dinucleotides, sequences that are methylated in the germline are predicted to become CpG deficient over evolutionary time [38]. As a result CpGO/E is in-versely related to the degree of historical germline methy-lation. Low CpGO/E values indicate strong methylation while high CpGO/Evalues indicate weak methylation. This metric has been shown to correlate with direct mea-sures of DNA methylation in a number of animal models [23,25,28,36].
To test whether the distribution of CpGO/Evalues was best described as mixture of distributions we used the package Mclust [62] implemented in the R environment [63]. Bayesian information criterion (BIC) was used to compare the likelihood of Gaussian Mixture Models with different numbers of components. We found that a two-component model provided substantially better fit than a single component model [see Additional file 1 for trace of BIC for different numbers of components]. The R package Mixtools [64] was used to fit and trace the two-component mixture model of the distribution. Following Hunt et al. [33], we used the point of inter-section of the two component curves to separate genes
into two components: the 'low-CpG component’
(pre-dicted to be hypermethylated) and the‘high-CpG com-ponent’(predicted to be hypomethylated).
Analysis of CpGO/Efor biological processes
To analyze patterns of gene function relative to predic-ted methylation, we assigned annotapredic-ted genes to 14 gen-eral biological processes based on gene ontology (GO) terms. The GO terms were selected to match a subset of those analyzed by Gavery and Roberts [29]. To these we added four additional hand-picked GO terms: ribosome biogenesis, translation, defense response, and regulation of response to stimulus, to better demonstrate the spread of “house-keeping” versus dynamic biological processes. A single gene could be assigned to multiple GO terms. GO terms with fewer than 20 representative genes, includ-ing death (no annotated genes) and protein metabolism (11 genes), were excluded from the analysis. Nonrandom sorting of genes from each function between the
high-CpGO/E and low-CpGO/E components was ascertained
using Fisher’s exact test [65].
Reciprocal transplantation experiment
Field work was conducted with permission from the Great Barrier Reef marine Park Authority (Research per-mit G09/29894.1) To test for a relationship between en-vironmentally induced gene expression and predicted methylation, we analyzed gene expression patterns of samples from a reciprocal transplantation experiment. Briefly, reciprocal transplantations were made between two environmentally distinct study sites (Keppel: 23°09S 150°54E and Orpheus 18°37S 146°29E) separated by 4.5 degrees of latitude in the Great Barrier Reef. On the 23rd April (Orpheus) and 4thMay (Keppels) 2010 fifteen col-onies were collected from wild populations from each site and divided into two. One half of each colony was replaced in its native habitat, while the second half was transplanted to the alternate study site. Samples from all coral fragments were collected at midday after three months (9th July 2010 at Orpheus, 14thJuly at Keppels) frozen in liquid nitrogen, then transferred into RNAlater (Ambion, Austin, TX, USA) for gene expression profiling.
Analysis of gene expression
expression of different transcript isoforms. Sequencing was performed using the SOLiD system producing a total of 108499924 filter passing reads (average reads per sample = 1937499 ± 788474 standard deviation). The counts data were analyzed using generalized linear model implemented in DESeq package [39] with the factors “origin” and “transplant location”. The R script used to implement DESeq is available at [DOI] (https:// zenodo.org/badge/doi/10.5281/zenodo.12626.png) (http://dx.doi.org/10.5281/zenodo.12626) and on GitHub at https://github.com/grovesdixon/CpGoe.git. False dis-covery rate was controlled at 1% [66]. Enrichment of dif-ferentially expressed genes (i.e., showing significant effect of transplant location or origin) in the high-CpGO/E com-ponent was tested using Fisher’s exact test [65]. To assess this association on a continuous scale, we plotted trans-plantation effect and origin effect estimated for each gene in DEseq against its CpGO/E. Effect size for transplant-ation was estimated as [log(mean expression of samples placed at Orpheus/mean expression samples placed at Keppel)], whereas the origin effect was estimated as [log(mean expression of samples that originated at Orpheus/mean expression samples that originated at Keppel)].
Plotting relationships between expression and CpGO/E
To visualize genome wide trends between differential gene expression and predicted methylation (Figure 3A,D) we plotted data from 25 equal-sized gene quantiles based on
CpGO/E. The component curves from Figure 1A were
overlaid to show the relative densities of the high- and low-CpG components. Vertical scaling of the compo-nent curves did not correspond to y-axis labels. To plot mean transcript abundance against CpGO/E (Figure 4), genes were divided into 25 equally sized quantiles based on CpGO/Evalues. For each gene, expression was averaged across all samples. Mean expression for all genes in each quantile was then plotted against the mean CpGO/Evalue for the quantile.
Additional files
Additional file 1:Estimated fit for Gaussian Mixture Models. Bayesian information criterion (BIC) was used to compare the fit of Gaussian Mixture Models with different numbers of components to the distribution of CpGO/Evalues. BIC indicated that multicomponent models were more
likely than a single component model. For simplicity, and to facilitate comparisons with previous studies we chose a two-component model.
Additional file 2:Genes involved inresponse to oxidative stressand cellular response to stresscontribute to the relatively low mean CpGO/Efor thestress responseGene Ontology term.The figure
illustrates the variation in CpGO/Eof Gene Ontology (GO) terms nested
within stress response. Each bar represents mean CpGO/Efor the
indicated GO term and its standard error. Asterisks indicate significance of enrichment in the low- or high-CpG components (*< 0.05, **< 0.01, ***< 0.001; Fisher’s test). The bar labelled‘stress response reduced’
represents thestress responseGO term with genes fromresponse to oxidative stressandcellular response to stressremoved.
Abbreviations
CGIs:CpG islands; TSS: Transcription Start Site; CpGO/E: Normalized CpG
content, specifically the CpG observed to expected ratio; GO: Gene ontology.
Competing interests
The authors declare that they have no competing interests.
Authors’contributions
GBD carried out all the CpG-related data analysis and drafted the manuscript. LKB designed and conducted the field experiment, carried out RNA-seq sample preparation, and provided insights and revisions to the manuscript. MVM coordinated data analysis, analyzed RNA-seq data to infer differential gene expression and provided insights and revisions to the manuscript. All authors read and approved the final manuscript.
Acknowledgements
The authors thank Carly D. Kenkel for assistance with data analysis. Funding for this study was provided by National Science Foundation grant DEB-1054766 to MVM and the grant from the Australian Research Council Center of Excellence for Coral Reef Studies and the Queensland Government to LKB. We would also like to thank two anonymous reviewers who contributed valuable revisions and insights.
Author details
1Institute for Cell and Molecular Biology, University of Texas Austin, Austin,
USA.2Australian Institute of Marine Science, PMB 3, Townsville, QLD 4810, Australia.3ARC Centre of Excellence for Coral Reef Studies, James Cook University, Townsville, QLD 4811, Australia.4Department of Integrative Biology, University of Texas Austin, Austin, USA.
Received: 21 August 2014 Accepted: 10 December 2014 Published: 15 December 2014
References
1. Kelly SA, Panhuis TM, Stoehr AM:Phenotypic plasticity: molecular mechanisms and adaptive significance.Compr Physiol2012,2:1417–1439. 2. Chevin L, Collins S, Lefèvre F:Phenotypic plasticity and evolutionary
demographic responses to climate change : taking theory out to the field.Funct Ecol2013,27:966–979.
3. Price TD, Qvarnström A, Irwin DE:The role of phenotypic plasticity in driving genetic evolution.Proc R Soc London2003,270:1433–1440. 4. Yeh PJ, Price TD:Adaptive phenotypic plasticity and the successful
colonization of a novel environment.Am Nat2004,164:531–542. 5. Nicotra AB, Atkin OK, Bonser SP, Davidson AM, Finnegan EJ, Mathesius U,
Poot P, Purugganan MD, Richards CL, Valladares F, Van KM:Plant phenotypic plasticity in a changing climate.Trends Plant Sci2010,
15:684–692.
6. Barshis DJ, Ladner JT, Oliver TA, Seneca FO, Traylor-Knowles N, Palumbi SR:
Genomic basis for coral resilience to climate change.Proc Natl Acad Sci U S A2013,110:1387–1392.
7. Palumbi SR, Barshis DJ, Traylor-Knowles N, Bay RA:Mechanisms of Reef Coral Resistance to Future Climate Change.Science (80-)2014,895. 8. Aubin-Horth N, Renn S:Genomic reaction norms: using integrative
biology to understand molecular mechanisms of phenotypic plasticity.
Mol Ecol2009,18:3763–3780.
9. Angers B, Castonguay E, Massicotte R:Environmentally induced phenotypes and DNA methylation: how to deal with unpredictable conditions until the next generation and after.Mol Ecol2010,
19:1283–1295.
10. Bossdorf O, Arcuri D, Richards CL, Pigliucci M:Experimental alteration of DNA methylation affects the phenotypic plasticity of ecologically relevant traits in Arabidopsis thaliana.Evol Ecol2010,24:541–553. 11. Roberts SB, Gavery MR:Is there a relationship between DNA methylation
and phenotypic plasticity in invertebrates?Front Physiol2012,2:1–5. 12. Richards EJ:Population epigenetics.Curr Opin Genet Dev2008,18:221–226. 13. Tucker KL:Methylated cytosine and the brain: a new base for
14. Jaenisch R, Bird A:Epigenetic regulation of gene expression: how the genome integrates intrinsic and environmental signals.Nat Genet Suppl
2003,33:245–254.
15. Jones PA:Functions of DNA methylation: islands, start sites, gene bodies and beyond.Nat Rev Genet2012,13:484–492.
16. Murgatroyd C, Patchev AV, Wu Y, Micale V, Bockmühl Y, Fischer D, Holsboer F, Wotjak CT, Almeida OFX, Spengler D:Dynamic DNA methylation programs persistent adverse effects of early-life stress.Nat Neurosci
2009,12:1559–1566.
17. Heim C, Binder EB:Current research trends in early life stress and depression: review of human studies on sensitive periods, gene-environment interactions, and epigenetics.Exp Neurol2012,
233:102–111.
18. Wang W-S, Pan Y-J, Zhao X-Q, Dwivedi D, Zhu L-H, Ali J, Fu B-Y, Li Z-K:
Drought-induced site-specific DNA methylation and its association with drought tolerance in rice (Oryza sativa L.).J Exp Bot2011,
62:1951–1960.
19. Portela A, Esteller M:Epigenetic modifications and human disease.
Nat Biotechnol2010,28:1057–1068.
20. Javierre BM, Fernandez AF, Richter J, Al-Shahrour F, Martin-Subero JI, Rodriguez-Ubreva J, Berdasco M, Fraga MF, O’Hanlon TP, Rider LG, Jacinto FV, Lopez-Longo FJ, Dopazo J, Forn M, Peinado MA, Carreño L, Sawalha AH, Harley JB, Siebert R, Esteller M, Miller FW, Ballestar E:Changes in the pattern of DNA methylation associate with twin discordance in systemic lupus erythematosus.Genome Res2010,20:170–179.
21. Miyake K, Yang C, Minakuchi Y, Ohori K, Soutome M, Hirasawa T, Kazuki Y, Adachi N, Suzuki S, Itoh M, Goto Y-I, Andoh T, Kurosawa H, Oshimura M, Sasaki M, Toyoda A, Kubota T:Comparison of genomic and epigenomic expression in monozygotic twins discordant for rett syndrome.PLoS One
2013,8:e66729.
22. Suzuki MM, Kerr ARW, De SD, Bird A:CpG methylation is targeted to transcription units in an invertebrate genome.Genome Res2007,
17:625–631.
23. Zemach A, McDaniel IE, Silva P, Zilberman D:Genome-wide evolutionary analysis of eukaryotic DNA methylation.Science2010,328:916–919. 24. Lyko F, Foret S, Kucharski R, Wolf S:The honey bee epigenomes:
differential methylation of brain DNA in queens and workers.PLoS Biol
2011,8.
25. Wang X, Wheeler D, Avery A, Rago A, Choi J-H, Colbourne JK, Clark AG, Werren JH:Function and evolution of DNA methylation in Nasonia vitripennis.PLoS Genet2013,9:e1003872.
26. Bonasio R, Li Q, Lian J, Mutti N, Jin L, Zhao H, Zhang P, Wen P, Xiang H, Ding Y, Jin Z, Shen SS, Wang Z, Wang W, Wang J, Berger SL, Liebig J, Zhang G, Reinberg D:Genome-wide and caste-specific DNA methylomes of the ants camponotus floridanus and harpegnathos saltator.Curr Biol2012,
22:1755–1764.
27. Falckenhayn C, Boerjan B, Raddatz G, Frohme M, Schoofs L, Lyko F:
Characterization of genome methylation patterns in the desert locust Schistocerca gregaria.J Exp Biol2013,216:1423–1429.
28. Sarda S, Zeng J, Hunt B, Soojin V:The evolution of invertebrate gene body methylation.Mol Biol Evol2012,29:1907–1916.
29. Gavery M, Roberts S:DNA methylation patterns provide insight into epigenetic regulation in the Pacific oyster (Crassostrea gigas).
BMC Genomics2010,11:483.
30. Park J, Peng Z, Zeng J, Elango N, Park T, Wheeler D, Werren JH, Yi SV:
Comparative analyses of DNA methylation and sequence evolution using nasonia genomes.Mol Biol Evol2011,28:3345–3354. 31. Elango N, Hunt BG, Goodisman MAD, Yi SV:DNA methylation is
widespread and associated with differential gene expression in castes of the honeybee, Apis mellifera.Proc Natl Acad Sci U S A2009,
106:11206–11211.
32. Foret S, Kucharski R, Pittelkow Y, Lockett GA, Maleszka R:Epigenetic regulation of the honey bee transcriptome: unravelling the nature of methylated genes.BMC Genomics2009,10:472.
33. Hunt B, Brisson J:Functional conservation of DNA methylation in the pea aphid and the honeybee.Genome Biol Evol2010,2:719–728.
34. Kucharski R, Maleszka J, Foret S, Maleszka R:Nutritional control of reproductive status in honeybees via DNA methylation.Science2008,
319:1827–1830.
35. Foret S, Kucharski R, Pellegrini M, Feng S, Jacobsen SE, Robinson GE, Maleszka R:DNA methylation dynamics, metabolic fluxes, gene splicing,
and alternative phenotypes in honey bees.Proc Natl Acad Sci U S A2012,
109:4968–4973.
36. Xiang H, Zhu J, Chen Q, Dai F, Li X, Li M, Zhang H, Zhang G, Li D, Dong Y, Zhao L, Lin Y, Cheng D, Yu J, Sun J, Zhou X, Ma K, He Y, Zhao Y, Guo S, Ye M, Guo G, Li Y, Li R, Zhang X, Ma L, Kristiansen K, Guo Q, Jiang J, Beck S, Xia Q, Wang W, Wang J:Single base-resolution methylome of the silkworm reveals a sparse epigenomic map.Nat Biotechnol2010,28:516–520.
37. Sved J, Bird A:The expected equilibrium of the CpG dinucleotide in vertebrate genomes under a mutation model.Proc Natl Acad Sci U S A
1990,87:4692–4696.
38. Flores KB, Amdam GV:Deciphering a methylome : what can we read into patterns of DNA methylation?J Exp Biol2011,214:3155–3163.
39. Anders S, Huber W:Differential expression analysis for sequence count data.Genome Biol2010,11:R106.
40. Meyer E, Aglyamova GV, Matz MV:Profiling gene expression responses of coral larvae (Acropora millepora) to elevated temperature and settlement inducers using a novel RNA-Seq procedure.Mol Ecol2011,
20:3599–3616.
41. Chapman J, Kirkness E, Simakov O, Hampson SE, Mitros T, Thomas W, Rattei T, Balasubramanian PG, Borman J, Busam D, Disbennett K, Pfannkoch C, Sumin N, Sutton GG, Viswanathan LD, Walenz B, Goodstein DM, Hellsten U, Kawashima T, Prochnik SE, Putnam NH, Shu S, Blumberg B, Dana CE, Gee L, Kibler DF, Law L, Lindgens D, Martines DE, Peng J,et al:The dynamic genome of Hydra.Nature2010,464:592–596.
42. Rocker M, Willis B, Bay L:Thermal stress-related gene expression in corals with different Symbiodinium types.Proc 12th Int Coral Reef Symp2012,9:1–5. 43. Levy O, Kaniewska P, Alon S, Eisenberg E, Karako-Lampert S, Bay LK,
Reef R, Rodriguez-Lanetty M, Miller DJ, Hoegh-Guldberg O:Complex diel cycles of gene expression in coral-algal symbiosis.Science2011,331(80):175. 44. Lehnert EM, Mouchka ME, Burriesci MS, Gallo ND, Schwarz JA, Pringle JR:
Extensive differences in gene expression between symbiotic and aposymbiotic cnidarians.G32014,4:277–295.
45. Gavery MR, Roberts SB:Predominant intragenic methylation is associated with gene expression characteristics in a bivalve mollusc.Peer J2013,
1:e215.
46. Batut P, Dobin A, Plessy C, Carninci P, Gingeras TR:High-fidelity promoter profiling reveals widespread alternative promoter usage and transposon-driven developmental gene expression.Genome Res2013,
23:169–180.
47. Maunakea AK, Nagarajan RP, Bilenky M, Ballinger TJ, Souza CD, Fouse SD, Johnson BE, Hong C, Nielsen C, Zhao Y, Turecki G, Delaney A, Varhol R, Thiessen N, Shchors K, Heine VM, Rowitch DH, Xing X, Fiore C, Schillebeeckx M, Jones SJM, Haussler D, Marra MA, Hirst M, Wang T, Costello JF:
Conserved role of intragenic DNA methylation in regulating alternative promoters.Nature2010,466:253–257.
48. Van Oppen MJH, Peplow LM, Kininmonth S, Berkelmans R:Historical and contemporary factors shape the population genetic structure of the broadcast spawning coral, Acropora millepora, on the Great Barrier Reef.
Mol Ecol2011,20:4899–4914.
49. Rohner N, Jarosz DF, Kowalko JE, Yoshizawa M, Jeffery WR, Borowsky RL, Lindquist S, Tabin CJ:Cryptic variation in morphological evolution: HSP90 as a capacitor for loss of eyes in cavefish.Science2013,342:1372–1375. 50. Huh I, Zeng J, Park T, Yi SV:DNA methylation and transcriptional noise.
Epigenetics Chromatin2013,6:9.
51. Newman JRS, Ghaemmaghami S, Ihmels J, Breslow DK, Noble M, DeRisi JL, Weissman JS:Single-cell proteomic analysis of S. cerevisiae reveals the architecture of biological noise.Nature2006,441:840–846.
52. Riviere G, Wu G-C, Fellous A, Goux D, Sourdaine P, Favrel P:DNA methylation is crucial for the early development in the Oyster C. gigas.Mar Biotechnol (NY)2013,15:739–753.
53. Kenkel CD, Meyer E, Matz MV:Gene expression under chronic heat stress in populations of the mustard hill coral (Porites astreoides) from different thermal environments.Mol Ecol2013,22:4322–4334. 54. Meyer E, Davies S, Wang S, Willis B, Abrego D, Juenger T, Matz M:Genetic
variation in responses to a settlement cue and elevated temperature in the reef-building coral Acropora millepora.Mar Ecol Prog Ser2009,392:81–92. 55. Reusch TBH:Climate change in the oceans : evolutionary versus
phenotypically plastic responses of marine animals and plants.Evol Appl
2013. ISSN 1752–4571.
Holland RA, Hughes AF, O’Hanlon SE, Garnett ST, Sekercioğlu CH, Mace GM:
Identifying the world’s most climate change vulnerable species: a systematic trait-based assessment of all birds, amphibians and corals.
PLoS One2013,8:e65427.
57. Moya A, Huisman L, Ball EE, Hayward DC, Grasso LC, Chua CM, Woo HN, Gattuso J-P, Forêt S, Miller DJ:Whole transcriptome analysis of the coral Acropora millepora reveals complex responses to CO2-driven acidification
during the initiation of calcification.Mol Ecol2012,21:2440–2454. 58. Altschul SF, Madden TL, Schäffer AA, Zhang J, Zhang Z, Miller W, Lipman DJ:
Gapped BLAST and PSI-BLAST: a new generation of protein database search programs.Nucleic Acids Res1997,25:3389–3402.
59. Putnam NH, Srivastava M, Hellsten U, Dirks B, Chapman J, Salamov A, Terry A, Shapiro H, Lindquist E, Kapitonov VV, Jurka J, Genikhovich G, Grigoriev IV, Lucas SM, Steele RE, Finnerty JR, Technau U, Martindale MQ, Rokhsar DS:
Sea anemone genome reveals ancestral eumetazoan gene repertoire and genomic organization.Science2007,317:86–94.
60. Dunlap WC, Starcevic A, Baranasic D, Diminic J, Zucko J, Gacesa R, van Oppen MJ, Hranueli D, Cullum J, Long PF:KEGG orthology-based annotation of the predicted proteome of Acropora digitifera: ZoophyteBase - an open access and searchable database of a coral genome.BMC Genomics2013,14:509. 61. Consortium TU:Update on activities at the Universal Protein Resource
(UniProt) in 2013.Nucleic Acids Res2013,41:43–47.
62. Fraley C, Raftery AE:Model-based methods of classification: using the mclust Software in Chemometrics.J Stat Softw2007,18:1–13.
63. Team RC:R: a language and environment for statistical computing.2013. 64. Benaglia T, Chauveau D, Hunter DR, Young DS:Mixtools: An R Package for
Analyzing Finite Mixture Models.2007.
65. Fisher RA:On the interpretation ofχ2 from contingency tables, and the calculation of P.J R Stat Soc1922,85:87–94.
66. Bejamini Y, Hochberg Y:Controlling the false discovery rate: a practical and powerful approach to multiple testing.J R Stat Soc1995,57:289–300.
doi:10.1186/1471-2164-15-1109
Cite this article as:Dixonet al.:Bimodal signatures of germline methylation are linked with gene expression plasticity in the coral
Acropora millepora.BMC Genomics201415:1109.
Submit your next manuscript to BioMed Central and take full advantage of:
• Convenient online submission
• Thorough peer review
• No space constraints or color figure charges
• Immediate publication on acceptance
• Inclusion in PubMed, CAS, Scopus and Google Scholar
• Research which is freely available for redistribution