Sdf
Employer Skills Survey 2013:
Wales Report
Ymchwil gymdeithasol Social research
Employer Skills Survey 2013: Wales Report
Mark Winterbotham, Katie Spreadbury,
Jolyon Fairburn-Beech and Mark Tweddle
IFF Research
Views expressed in this report are those of the researcher and not necessarily those of the Welsh Government
For further information please contact: Joanne Corke
Knowledge and Analytical Services Finance and Corporate Services Welsh Government
Cathays Park Cardiff
CF10 3NQ
Tel: 02920 801138
Email: joanne.corke@wales.gsi.gov.uk
Welsh Government Social Research, 4 June 2014 ISBN 978-1-4734-1527-0
Acknowledgements
Many individuals and organisations have been involved in the design and execution of the UK Commission’s Employer Skills Survey 2013 and the subsequent production of this report focusing on findings in Wales.
Particular thanks are given to the 6,000 businesses across Wales who took part in a telephone interview.
The design and execution of the UK survey and its subsequent analysis was overseen by the UK Commission and particular thanks are due to the staff there, including Vicki Belt, Rebecca Jones, Thomas Glynn, Charlotte McDonough, Angela Thompson, and Marc Bayliss. Special thanks are reserved for the project manager at the UK Commission throughout the course of the survey, Genna Kik.
The nationwide survey was supported by all four UK governments; it’s
development guided by a steering group. Members attending this group were Robin Elliot-Marshall, Department for Business, Innovation and Skills (BIS); Dominic Rice, BIS; Vikki McCauley, BIS; Kate Murphy, BIS; Stuart King, Scottish Government; Joanne Corke, Welsh Government; Victor Dukelow; Department for Employment and Learning Northern Ireland (DELNI); Graham Belshaw, DELNI; Tracy Power, DELNI; Alastair Yeo, Department for Work and Pensions (DWP); Lewis Childs, DWP; Kate Lager, DWP; Ella Taylor, DWP; Anthony Clarke, Department for Education (DFE); Stuart Vickers, Skills Funding Agency; Carol Stanfield, UK Commission for Employment and Skills (UKCES); and Vicki Belt, UKCES.
Finally, particular thanks are due to James Carey and Joanne Corke of the Welsh Government for their overseeing of the production of this report and the associated analysis of UKCESS 2013 data for Wales.
Mark Winterbotham
Table of contents
Table of figures and charts... 3
Glossary of terms ... 6
1 Introduction ... 16
2 The nature of establishments in Wales ... 22
3 Employers’ experience of skill shortages ... 28
4 The Internal Skills Challenge ... 38
5 Training and workforce development ... 56
6 Young People in the labour market ... 75
7 High performance working practices and product market strategies ... 88
Table of figures
Figure 2.1: Size distribution of establishments and employees in Wales (March 2012) ... 23
Figure 2.2: Sectoral distribution of establishments and employment (March 2012) ... 24
Figure 2.3: Establishments and employment by Region (March 2012) ... 25
Figure 3.1: Density and number of skill-shortage vacancies by occupation (2011 vs. 2013)………… ... ………..34
Figure 3.2: Skills lacking among applicants (prompted) ... 35
Figure 3.3: Impact of skill-shortage vacancies (prompted) ... 36
Figure 4.1: Main causes of skills gaps (prompted, unless asterisked) ... 44
Figure 4.2: Skills lacking among staff with skills gaps followed up (prompted) ... 45
Figure 4.3: Impact of skills gaps (prompted) ... 47
Figure 4.4: Actions taken to overcome skills gaps (prompted)... 48
Figure 4.5: Single occupation most affected by the need for upskilling among those employing each occupational group ... 53
Figure 4.6: Skills which need improving or updating in the next 12 months (prompted) .... 55
Figure 5.1: Employer interest in undertaking more training over the last 12 months than they were able to provide ... 63
Figure 5.2: Types of training provided over the last 12 months by employers that train (prompted)….. ... 64
Figure 5.3: Proportion and numbers of staff trained over the last 12 months by occupation (2011 vs. 2013) ... 66
Figure 6.1: Employer recruitment of young people in Wales ... 77
Figure 6.2: Incidence of recruitment in the last 2-3 years of education leavers into their first jobs by size of establishment ... 81
Figure 6.3: Work readiness of those recruited straight from education (2011 vs. 2013)... 82
Figure 7.1: Number of HPW and high PMS employers ... 90
Figure 7.2: Employer adoption of High Performance Working Practices ... 91
Figure 7.3: Product Market Strategy positions ... 94
Figure 7.4: Incidence of vacancies, hard-to-fill vacancies and skill-shortage vacancies by Product Market Strategy classification ... 97
Table of tables
Table 1.1: Interviews achieved and the survey response rates... 18
Table 2.1: Sector distribution within Region ... 26
Table 3.1: Incidence and density of vacancies, by region (2011 vs. 2013) ... 30
Table 3.2: Incidence and density of skill-shortage vacancies (SSVs) by region (2011 vs. 2013)…………. ... 32
Table 4.1: Incidence, number and density of skills gaps by region (2011 vs. 2013) ... 41
Table 4.2: Number and density of skills gaps by occupation (2011 vs. 2013) ... 42
Table 4.3: Incidence, number and density of staff who are both over-qualified and over-skilled by region (2011 vs. 2013) ... 50
Table 4.4: Whether expect employees will need to acquire new skills or knowledge in the next 12 months, and the reasons for this by region (prompted) ... 52
Table 5.1: Training and workforce development in the last 12 months, by region, size and type of establishment... 59
Table 5.2: Number of staff trained over the last 12 months and the proportion of staff trained, by region and establishment size ... 65
Table 5.3: Total training and development days, and days per person trained and per employee, by size (2011 vs. 2013) ... 67
Table 5.4: Training to nationally recognised qualifications over the previous 12 months .. 69
Table 5.5: Total training expenditure and spend per person trained and per employee, by size (2011 vs. 2013) ... 70
Table 5.6: Total training expenditure broken down by individual components (2011 vs. 2013)………… ... 72
Table 5.7: Training expenditure by size, the proportion spent on off-the-job elements, and the breakdown of total training expenditure (both on-the-job and off-the-job) by key elements.. ... 73
Table 6.1: Summary recruitment of education leavers in Wales by region, size and sector……….. ... 78
Table 6.2: Incidence of recruitment of education leavers in the last 2-3 years in Wales into their first jobs by region (2011 v 2013) ... 80
Table 6.3: Main skills and attributes lacking in education leavers by region (Prompted)... 84
Table 6.4: Skills deficiencies and training activity among recruiting employers who recruited young people and education leavers vs. those who had not ... 86
Table 7.1: Incidence and density of skills gaps by HPW classification ... 92
Table 7.2: Overall composite Product Market Strategy scores ... 95
Table 7.3: Overall composite Product Market Strategy classification, by size ... 96
Table 7.4: Incidence and density of skills gaps by Product Market Strategy classification.. ... 98
Table 7.5: Main causes of skills gaps (prompted), by Product Market Strategy ... 99
Table A.3.1 Incidence, number and density of vacancies by region, size and sector ... 104
Table A.3.2 Incidence, number and density of vacancies by occupation (2011 vs. 2013) . 105 Table A.3.3 Incidence, number and density of skill-shortage vacancies (SSVs) by region, size and sector ... 106
Table A.3.5 Ratio of skill-shortage vacancies to vacancies that are hard-to-fill for other
non-skills-related reasons by region, size and sector ... 108
Table A.4.1: Incidence, number and density of skills gaps by size and sector (2011 vs. 2013)…………. ... 109
Table A.4.2: Proportion of each occupation lacking full proficiency within region ... 110
Table A.4.2a: Base sizes for A.4.2 ... 110
Table A.4.3: Causes of Skills Gaps, by occupation ... 111
Table A.4.4: Skills lacking among staff with skills gaps followed up, by occupation ... 112
Table A.4.5: Actions taken to overcome skills gaps (prompted), by region ... 113
Table A.4.6: Skills gaps and skill-shortage vacancies, by region, size and sector ... 114
Table A.4.7: Incidence, number and density of staff who are both over-qualified and over-skilled by size and sector (2011 vs. 2013)... 115
Table A.4.8: Skills which need improving or updating in the next 12 months, by the single occupation most affected by upskilling need ... 116
Table A.5.1: Incidence of training by sector ... 117
Table A.5.2 Incidence of wider development activities (2013 and 2011) ... 118
Table A.5.3 Reasons for not funding or arranging training over the last 12 months (unprompted).. ... 119
Table A.5.4 Whether trainers would have liked to provide more training, and if so the main barriers (prompted), by region, size and sector... 120
Table A.5.5 Types of training provided over the last 12 months, by region, size and sector (prompted) ... 122
Table A.5.6 Number employed and trained over the last 12 months by sector, and the proportion of the workforce trained ... 123
Table A.5.7 Average training days over the last 12 months per person trained, by region, size and sector ... 124
Table A.5.8 Total training and development days, and days per person trained and per employee by region and sector (2011 vs. 2013) ... 125
Table A.5.9 Training to nationally recognised qualifications in the last 12 months among employers that train, by region, size and sector ... 126
Table A.5.10 Training expenditure per employee and per person trained by region ... 127
Table A.5.11: Training expenditure by region, the proportion spent on off-the-job elements, and the breakdown of total training expenditure (both on-the-job and off-the-job) by key elements, by region ... 127
Table A.5.12 Training expenditure spent on Further Education colleges, Universities or other Higher Education institutions, and the proportion of the total fees to external providers that this represents, by region and size ... 128
Table A.6.1 Recruitment of education leavers in past 2-3 years, by sector ... 129
Table A.6.2 Recruitment of young people in past 2-3 years, by region, size and sector ... 130
Table A.7.1 Incidence of HPW employers ... 131
Table A.7.2 Product Market Strategy classification within the private sector, by region and sector….. ... 132
Glossary of terms
This glossary gives a short guide to the key terms used in this report:
Establishment (also referred to as
workplace or site)
A single location of an organisation with people working at it.
Vacancy density The number of vacancies as a proportion of all employment.
Hard-to-fill vacancies Vacancies which are proving difficult to fill, as defined by the establishment (from question: “Are any of these vacancies proving hard to fill?”).
Hard-to-fill vacancy density
The number of hard-to-fill vacancies as a proportion of all vacancies.
Skill-shortage vacancies (SSVs)
Vacancies which are proving difficult to fill due to the establishment not being able to find applicants with the appropriate skills, qualifications or experience.
Skill-shortage vacancy density
The number of skill-shortage vacancies as a proportion of all vacancies
Skills gaps A “skills gap” is where an employee is not fully
proficient, i.e. is not able to do their job to the required level. See Appendix D for a discussion on the measure.
UKCES The UK Commission for Employment and Skills
Under-use of skills An employee is “under-used” if the employer reports
they have both more skills and more qualifications than are required to perform the job role they are currently in.
Upskilling A need for employees to gain new skills or
knowledge.
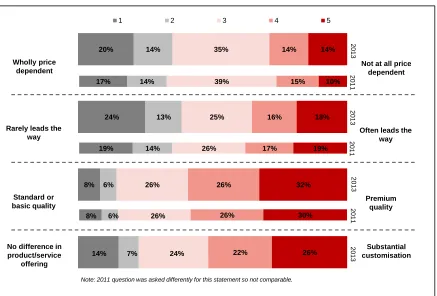
Product Market Strategy (PMS)
An establishment’s PMS score is worked out from the combined answers of four questions:
How customised their output is;
How price dependent their offering is;
How innovative the establishment is;
Whether outputs are premium or basic quality.
A high PMS score would indicate outputs are customised, not price-dependent, premium quality and the establishment often leads the way in product development.
Level 4 and above qualifications
Qualifications at or above Level 4 on the National Qualifications Framework. Includes HNDs, HNCs, foundation degrees and degrees, postgraduate degrees, and some vocational and professional qualifications.
Sector For definitions of the different sector groupings used
in this report please refer to Appendix B.
Executive Summary
1. The UK Commission’s Employer Skills Survey is the definitive source of data on employer investment in skills in the UK. The survey comprises interviews with over 91,000 employers across the UK, just under 6,000 of which were with employers in Wales. It explores the skills challenges that employers face both within their existing workforces and in terms of
bringing in new skilled labour, the levels, and nature of training investment, recruitment of young people and education leavers, and the relationship between skills challenges, training activity and business strategy.
2. The survey was first run in 2011. Conducted every two years, 2013
provides the first opportunity to track this survey data in Wales over time1. The scale of the survey also allows for detailed sub-group analysis at a regional and sector level, as well as allowing for comparisons with other countries within the UK.
Skill shortages
3. The survey provides evidence that the Welsh economy is moving
towards recovery. At the time of the survey (conducted March to July
2013) 14 per cent of employers reported having a vacancy, and the number of vacancies they reported equated to 2.2 per cent of the total workforce in Wales (the latter is referred to as the ‘vacancy density’). This is an increase from the comparable period in 2011, when 12 per cent of establishments reported vacancies and vacancy density was 1.9 per cent. The increase from 2011 to 2013 in the incidence and density of vacancies in Wales is similar to the picture seen in the UK as a whole.
4. However the picture varies across the different regions of Wales. The increase in the incidence and density of vacancies was most strongly seen in north Wales and south west Wales; in south east Wales and mid Wales there was no significant change from 2011.
1
5. Whilst in most cases demand for skills is met through successful
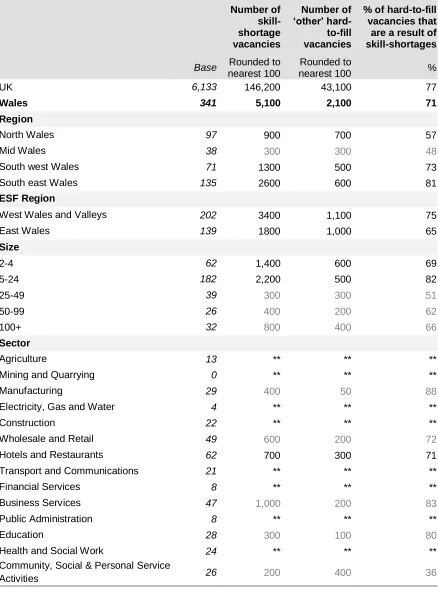
recruitment, four per cent of employers in Wales had vacancies that they were finding hard to fill due to shortages of applicants with the correct skills, qualifications or experience. These 5,100 “skill-shortage vacancies” make up a fifth (20 per cent) of all vacancies in Wales. This is an increase on 2011, when three per cent of employers were affected and 18 per cent of vacancies were classed as skill-shortage vacancies.
6. Skill-shortage vacancies are a particular issue for establishments in south east Wales (where 23 per cent of vacancies are skill-shortage vacancies), the Business Services sector (30 per cent) and small establishments with fewer than five staff (27 per cent) and between 5-24 employees (30 per cent).
7. Whilst the proportion of vacancies that are hard to fill due to skill shortages is slightly lower in Wales than found in the UK as a whole (22 per cent), it still presents a challenge for the Welsh economy as economic growth
and the recovery may be constrained by these skill shortages.
Indeed, nearly all employers (97 per cent) who said all of their hard-to-fill vacancies were as a result of skill shortages reported these were having an impact on their establishment. This was most commonly in the form of increased workload for other staff (an issue for 90 per cent of those with skill-shortage vacancies) but these establishments also commonly mentioned skill-shortage vacancies impacting on business performance, for example having difficulties meeting customer service objectives (49 per cent), delays in developing new products and services (47 per cent) and losing business orders to competitors (45 per cent). The proportion of employers facing this issue is small, but the impact these recruitment difficulties have on these employers is considerable.
8. Skill shortages differ by occupation, and there are pockets within the
economy where skill shortages are particularly prevalent. Skilled
Leisure and Other services vacancies falling into this category (28 per cent, from 12 per cent in 2011).
9. Skills specific to the job role (technical, practical or job specific skills) were the most common skills lacking from applicants (cited in relation to 69 per cent of skill-shortage vacancies).
Skills gaps
10. The majority of employers report that they have a proficient
workforce with no skills gaps, that is, all of their staff have the skills to
carry out their job to the required level. Overall, 16 per cent have at least one member of staff who is not fully proficient. Whilst the proportion of establishments affected by skills gaps has remained constant since 2011, the number of staff considered not fully proficient at their roles has risen from 53,900 in 2011 to 67,400 in 2013 (five per cent to six per cent of the workforce as a whole). This is similar to figures seen in the UK as a whole in 2013, where 15 per cent of employers reported having any skills gaps, and five per cent of the workforce were considered not fully proficient. 11. Skills gaps are more prevalent in north Wales, where eight per cent of staff
were identified as lacking proficiency. Skills gaps were more common among lower skilled occupations, and affect nine per cent of staff working in Elementary occupations. There has also been an increase in skills gaps among Caring, Leisure and Other services staff compared to 2011, with the proportion of the workforce in this occupation with skills gaps also nine per cent in 2013 up from five per cent in 2011. This occupational group was also highlighted as one where skill-shortage vacancies were
particularly common, suggesting a widespread lack of skills.
12. The indications are that the rise in skills gaps across the Welsh
economy has been at least in part due to increased recruitment, with
the majority of skills gaps caused by people being new to their roles
be transient in nature, that is, it might be expected that the skills gaps would be eliminated in most cases once the individual had settled into their new role and/or completed their training.
13. Additionally increasedskill shortages in the available labour market
may play some part in explaining the increase in skills gaps: there
has been a sharp rise in employers saying their skills gaps are a result of being unable to recruit suitably skilled staff (from 23 per cent in 2011 to 35 per cent in 2013).
14. Encouragingly, since 2011 there has been a marked rise in the proportion of employers with skills gaps that have taken action to tackle them
(although this may just be an indicator of increased severity of the skills gaps). Whilst the proportion dealing with skills gaps through increasing staff training has remained constant, far more are now using employee-centric methods to address these gaps such as supervision, mentoring and individual performance reviews.
15. Employers tend to be challenged either in terms of having inadequate skills among some of their existing workforce or struggling to find new recruits with the skills that the vacant positions require. It is very rare for employers to be challenged from both directions; just one per cent of all employers in Wales experienced both skill-shortage vacancies and skills gaps.
16. It is more commonly the case that employers were not fully utilising their workforces’ skills. Half of establishments in Wales (50 per cent) reported having staff with skills and qualifications higher than required for their current role. This equates to around 241,000 workers (21 per cent of the workforce) having under-used skills; harnessing these latent
capabilities could potentially yield wide-ranging benefits for the
Welsh economy.
This again highlights skill needs in Wales among Caring, Leisure and Other services occupations.
Training and Workforce Development
18. Most employers in Wales arrange or fund training for their staff: over
three-fifths had done so in the previous 12 months (62 per cent), a figure in line with 2011 (63 per cent) but still lower than in the UK as a whole, where the figure was 66 per cent. Training was more common in south east Wales, where 67 per cent of establishments had provided any training for staff.
19. However, the proportion of the workforce receiving training in Wales
has increased substantially from 56 per cent in 2011 to 62 per cent in
2013 (this increase was seen UK-wide as well), and employees in Wales are just as likely to receive training as their counterparts in the rest of the UK.
20. Each person trained in Wales received a similar number of training days over the last 12 months as was found in the 2011 survey at 7.7 days per trainee – a trend not mirrored in the UK as a whole, where training days per person trained fell from 7.8 days in 2011 to 6.7 in 2013.
21. The total investment in training in Wales increased slightly from
£1.5bn to £1.6bn; this runs contrary to the decrease seen across the UK as a whole (from £45.3bn to £42.9bn). The increase in Wales was driven by increased investment among smaller establishments.
22. Most employers in Wales could be described as being in “training
equilibrium”,that is, they were able to provide the amount of training they wanted. This includes employers who had delivered no training because they had “no need for it”. Believing all staff to be fully proficient at their job roles was by far the most common reason given for not providing any training. However, half of all training employers (50 per cent) would have liked to have provided more training than they were able to provide to staff. Lack of time and lack of funds were the most common barriers to providing more training. A lack of suitable provision was rarely mentioned.
23. The proportion of training employers who had funded or arranged
has risen from 47 per cent in 2011 to 53 per cent in 2013. Training employers in Wales were more likely than any other country of the UK to train to qualifications (the UK-wide figure was 47 per cent).
Recruitment of Young People
24. Among employers in Wales that had recruited in the past two to three
years, almost three-quarters (74 per cent) had recruited at least one
young person2. Overall almost half (45 per cent) of all employers had
recruited a young person in the two to three years preceding the survey (similar to the 44 per cent found UK-wide).
25. Just over a quarter of establishments in Wales (27 per cent) had recruited someone directly from education into their first job during this period.
26. The main obstacle to (more) young people getting jobs is
competition in the market place. In around half (53 per cent) of cases
where young people had applied for a job but it had gone to an older candidate employers felt the young people had been suitable and met the requirements, but an older candidate was felt to be better. Those who did not feel the young candidates were suitable for the role cited a lack of skills (61 per cent) and a lack of work experience (also 61 per cent) as the primary reasons for this.
27. Most employers recruiting education leavers find them to be well prepared for work, and this level of preparedness increases with the level of
education (i.e. university leavers are seen as better prepared than school leavers). However 40 per cent of those taking on 16-year-old school leavers felt them to be poorly or very poorly prepared for work, primarily due to a lack of working world, life experience or maturity.
High Performance Working and Product Market Strategies
28. High Performance Working (HPW) is defined by the UK Commission as ‘a general approach to managing organisations that aims to stimulate more effective employee involvement and commitment in order to achieve high levels of performance’ (UKCES 2009).
29. This survey identifies 10 per cent of employers in Wales as “HPW
employers”, that is they adopt 14 out of the 21 HPW practices covered by
the survey questionnaire. This compares to 12 per cent of employers in the UK as a whole.
30. HPW employers were considerably more likely to be active in the
recruitment market, with more than twice as many having a vacancy than non-HPW employers (26 per cent compared with 12 per cent). However a significantly lower proportion of HPW employers’ vacancies were proving hard to fill (17 per cent, compared to 32 per cent among non-HPW
employers).
31. HPW employers were also considerably more likely to be experiencing skills gaps than non-HPW employers (25 per cent compared to 15 per cent), although the proportion of their workforce that lacks proficiency was in line with the national average (five per cent). It is likely that due to the employment practices they adopt HPW employers are better able to identify skills gaps in their workforce, and perhaps address them accordingly.
32. Product Market Strategies (PMS) are defined within the survey by aggregating responses to a series of questions exploring pricing
strategies, approaches to innovation and the nature of the product market (the extent to which the market attracts a “premium” and the extent of customisation of products and services in the market).
33. Just over two in five (41 per cent) private sector employers in Wales were classified as having a high or very high product market strategy indicating that their competitive success is not dependent on price, they pursue innovation, they compete on quality and/or that they offer customised goods or services. This is slightly but significantly lower than in the UK as a whole (44 per cent).
Conclusions
35. Findings from the 2013 survey reveal increased recruitment activity
compared with 2011, but at the same time skills challenges for employers have also increased, and these have the potential to act as a brake on economic recovery. There has been an increase compared with 2011 both in the number and proportion of vacancies across Wales proving hard to fill due to applicants lacking the skills, experience or qualifications
employers require and in the proportion of the workforce described as lacking proficiency (the latter mainly a result of the increased recruitment activity).
36. The pattern of skills shortages and skills gaps varies quite widely by region and occupation. For example a much higher proportion of vacancies in south east Wales were hard to fill because of skill shortages than in north Wales. It was also much higher for vacancies for Skilled Trades roles. 37. Although there been little change in the proportion of employers in Wales
providing training, and it remains the case that fewer employers in Wales train than in the rest of the UK, there has been an encouraging increase in the proportion of the workforce trained over the previous 12 months
compared with 2011. Further, on a number of measures training in Wales has shown more resilience than found across the UK as a whole: the total number of training days provided and overall employer investment in training both increased compared with 2011 despite the fact that both measures fell across the UK as a whole.
38. The proportion of the workforce in Wales with skills that are under-utilised is much higher than the proportion with skills gaps, has increased
compared with 2011, and is much higher than found across the UK. Harnessing these latent capabilities could yield wide ranging benefits for the Welsh economy.
1 Introduction
The UK Employer Skills Survey
This report presents findings among employers in Wales from the UK 1.1
Commission’s Employer Skills Survey 2013 (UKCESS 2013), a large-scale survey of employers which aims to provide a definitive picture of the extent, nature and impact of skills challenges faced by employers across the UK, and their response particularly in terms of their investment in training. UKCESS 2013 is the second time the survey has been conducted, the first having taken place in 2011.
Throughout the report comparisons are made with UK results, as well as with 1.2
findings in Wales in 2011.
As well as written commentary, the appendices to this report include abridged 1.3
data tabulations detailing key survey measures.
The full UK report and other outputs including data tables have been 1.4
published and are available on the UKCES website (UK Commission’s
Employer Skills Survey 2013: UK Results, Evidence Report 81, published January 2014; see www.gov.uk/government/publications/ukces-employer-skills-survey-2013).
Methodological overview
Like UKCESS 2011, UKCESS 2013 was carried out in two parts: a core 1.5
survey of employers, and a follow-up survey of a sample of workplaces which had funded or arranged training for employees in the 12 months preceding the survey to look at the investment they had made in this training (the
“Investment in Training Survey”). Both surveys were conducted by telephone. Employers were given the option to complete the interview in Welsh if they preferred.
This section briefly summarises the key features of the methodology adopted 1.6
across both surveys. Further detail can be found in the Technical Report (UK Commission’s Employer Skills Survey 2013: Technical Report, Evidence Report 82, published January 2014; see
Survey sampling
Sampling for the survey covered establishments (i.e. individual sites, as 1.7
opposed to enterprises where just the head office of multiple site organisations would be included) with at least two staff (including both
employees and working proprietors). Sole traders and establishments with just one employee and no working proprietors were excluded from the survey population.
The survey covers all sectors of the economy (across the commercial, public 1.8
and charitable spheres). The profile of this population was established through the Office for National Statistics (ONS) based on data from the
Inter-Departmental Business Register (IDBR) March 2012 statistics.
Contact details for employers were sourced from Experian’s commercial 1.9
database of establishments, supplemented by some records supplied directly through the IDBR (in order to ensure full representation of establishments in certain non-commercial sectors in particular).
A stratified random approach was taken to sampling the core survey, with 1.10
quotas sets for establishment size within sector, with the aim of oversampling large employers and smaller sectors.
In addition to the geography, sector and size of establishments, the 1.11
Investment in Training follow-up survey also ensured robust coverage by the nature of the training the establishment provides (whether it is on-the-job training only, off-the-job training only, or a combination of the two). All of the employers interviewed for the Investment in Training Survey had been interviewed as part of the core survey and had given their permission to be contacted for the follow-up research.
Survey questionnaire
The core survey questionnaire was based largely on that used in the 2011 1.12
the data shown was from a modularised question. Further details are provided in the main Technical Report of the UK survey.
The questionnaire used for the UK Investment in Training Survey was 1.13
identical to that used in 2011 except for the addition of two questions on the amount spent with different types of training providers.
The questionnaires to both surveys can be found in the Technical Report of 1.14
UKCESS 2013 which can be found at the link set out in paragraph 1.6.
Survey fieldwork
Fieldwork for the core survey was undertaken between March and July 2013, 1.15
and involved over 91,000 interviews UK-wide, including just under 6,000 interviews in Wales.
Fieldwork for the Investment in Training Survey was undertaken in May to 1.16
August 2013, and involved 13,138 follow-up interviews with employers UK-wide, of which 1,432 were with employers in Wales.3
An overall response rate of 45 per cent was achieved for the core survey in 1.17
Wales in 2013 (similar to the UK-wide figure of 44 per cent). For the
Investment in Training follow-up, respondents were already engaged with the survey so a much higher response rate of 65 per cent was achieved (a little lower than the 71 per cent achieved UK-wide).
Table 1.1: Interviews achieved and the survey response rates
2011 2013
UK Wales UK Wales
Core survey
Interviews 86,522 5,958 91,279 5,996
Response rate 39% 55% 44% 45%
Investment in Training follow-up
Interviews 11,027 1,483 13,138 1,432
Response rate 75% 69% 71% 65%
Note: the response rate in 2011 includes those records removed to ensure comparability between 2011 and 2013 (in Wales, 54 have been removed for the core survey and 18 for the Investment in Training follow-up) – see the section in this chapter (paragraphs 1.21-1.22) entitled ‘A note on the 2011findings used in this report’. Response rates show interviews as a proportion of all completed contacts (completes, refusals and stopped interviews).
3
Data weighting
Findings from the core survey have been weighted and grossed up to 1.18
accurately represent the total population of UK establishments in which at least two people work. This has been done on an interlocked size by sector basis in Wales, with additional rim weight for the four Welsh regions.
Separate weights have been generated which allow findings to be presented 1.19
(a) based on the number of workplaces reporting a particular experience, and (b) based on the number of employees and/or job roles affected or in a
particular situation.
Findings from the Investment in Training Survey have been weighted and 1.20
grossed up to reflect the population of training employers as generated by the weighted Wave 1 findings.
A note on the 2011 findings used in this report
The sampling approaches for the 2011 and 2013 surveys were not identical. 1.21
UKCESS 2011 covered all establishments except those with one working proprietor and no employees, whereas eligibility for UKCESS 2013 was establishments with employment of two or more people. To ensure findings in this report are comparable between 2011 and 2013, figures for 2011 have been recalculated removing establishments that would not have been eligible in 2013 (those with one employee and no working proprietors), and then re-weighted to the population of establishments in Wales with employment of two or more. For the core survey this entailed removing 54 respondents from the original 2011 Wales dataset.
Because of this change, 2011 results in this report may differ from those 1.22
reported in the 2011 ESS report for Wales.
Structure of this report
This report has been structured into five key sections followed by a chapter 1.23
drawing out conclusions. Additional tables of survey data can be found in a separate annex at the end of the report.
Chapter 2: The nature of establishments in Wales
employer population as indicated by ONS’s Inter-Departmental Business Register.
Chapter 3: Employers’ experience of skill shortages
This chapter looks at employer recruitment activity, measuring the extent, causes and impacts of recruitment difficulties, with a particular focus on skill shortages within the labour market and the impact such labour market failure has on establishments.
Chapter 4: The internal skills challenge
This chapter explores the proficiency of establishments’ existing workforces, and describes any skills gaps in detail. It also explores ‘under-use of skills’ (defined as having staff with both qualifications and skills that are more advanced than required for their current job role; this phenomenon is
sometimes also referred to as ‘over-skilling’, ‘over-qualification’ and/or ‘under-employment’) and employers’ predictions of the need for new skills or
knowledge among their staff (‘upskilling’). Chapter 5: Training and workforce development
This chapter explores in detail the extent and nature of employer training and workforce development, including the investment made in training, the extent to which employers would have liked to provide more training and
development, and the barriers that prevented increased training activity. Chapter 6: Young people in the labour market
This chapter looks at the recruitment of young people, including those
recruited directly from education, and examines employer perceptions of how well prepared they are for work.
Chapter 7: High performance working practices and product market strategy This chapter explores the working practices being adopted by employers in regard to how they manage, develop, engage with and incentivise their staff, and assesses the prevalence of High Performance Working (HPW) practices. It also explores the Product Market Strategies (PMS) of employers, and whether this impacts on their skill needs and training practices.
Chapter 8: Conclusions
Reporting conventions
Unless otherwise stated, differences are commented upon in the text if the 1.24
results show a statistically significant difference (at the 95 per cent confidence level) to those they are being compared with.
The survey was carried out at an establishment level. The terms 1.25
“establishment”, “employer” and “workplace” are used for this interchangeably throughout this report to avoid excessive repetition.
Throughout the report unweighted base figures are shown on tables and 1.26
charts to give an indication of the statistical reliability of the figures. These figures are always based on the number of establishments answering a question, as this is the information required to determine statistical reliability. This means, for example, that where percentages are based on “all
vacancies” (such as the percentage of all vacancies which are hard to fill because of a lack of the required skills among applicants) the base figure quoted is the unweighted number of establishments with vacancies.
In tables, “zero” is denoted as a dash (“-“); and an asterisk is used (“*”) if the 1.27
figure is larger than zero but smaller than 0.5 per cent.
Throughout the report, figures with a base size of fewer than 25 1.28
2 The nature of establishments in Wales
To give context to the findings presented in this report, this chapter describes 2.1
the key characteristics of business establishments in Wales. It examines the size, sector and region profile. Because the survey data in Wales was grossed up to the population of businesses in Wales on a size, sector and region basis (as recorded by ONS on the IDBR) these are not survey findings as such. In addition the distribution of establishments between private sector, public sector and voluntary / third sector is also discussed.
ONS figures show there were around 81,300 in-scope establishments (with 2.2
employment of two or more) in Wales (as of March 2012, the most up to date data at the time the weighting was conducted). Overall 1.2m people were employed in these establishments.
Size
IDBR data indicates that the majority of Welsh establishments (54 per cent) 2.3
were small, employing fewer than five people. However these establishments account for just 10 per cent of total employment (within establishments with two or more staff). Sites employing 100 or more staff represent two per cent of all establishments but account for two-fifths (41 per cent) of overall
Figure 2.1: Size distribution of establishments and employees in Wales (March 2012)
Sector
Sectoral analysis in the ESS series is defined by a 14 sector split, based on 2.4
the establishment’s Standard Industrial Classification (SIC) 2007 code. Within Wales just 13 interviews were conducted in the Mining and quarrying sector, and because of this low base results are not shown for this sector within this report.
IDBR statistics show that the Wholesale and Retail and Business Services 2.5
sectors are the two largest in terms of the number of establishments.
Together, these two sectors account for more than a third of establishments in Wales (35 per cent). When measured in terms of employment, however, the two largest sectors are Health and Social Work and Wholesale and Retail (employing 17 and 16 per cent of the workforce in Wales respectively). The sector profile of Wales differs somewhat to the rest of the UK. The most 2.6
striking difference, as reported in 2011, is a higher proportion of
establishments in Agriculture in Wales (12 per cent in Wales but just five per cent in the UK as a whole) and a lower proportion in Business Services (14 per cent compared to 20 per cent across the UK as a whole).
54%
36%
5%
3% 2%
10%
25%
13% 12%
41%
2 to 4 5 to 24 25 to 49 50 to 99 100+
Establishments Employees
Number of
establishments: 43,800 29,600 4,300 2,100 1,600
Employment: 115k 291k 148k 141k 475k
The Health and Social Work, Public Administration, Education and 2.7
Manufacturing sectors have a higher than average proportion of large establishments. For example, Education accounts for three per cent of all establishments, but 10 per cent of employment. Approaching half (46 per cent) of establishments in Education employ 25 or more staff, compared with 10 per cent across all sectors. Conversely, the Agriculture sector comprises 12 per cent of establishments, but employs only two per cent of the workforce in Wales. Almost no establishments in this sector employ 25 or more staff (fewer than 0.5 per cent). This is summarised in Figure 2.2.
Figure 2.2: Sectoral distribution of establishments and employment (March 2012)
Most establishments in Wales (86 per cent) described themselves as 2.8
operating in the commercial sphere, with small minorities operating in the public sector (six per cent) and in the voluntary / charity / third sector (eight per cent, labelled ‘third sector’ throughout the report). Establishments in the private sector account for almost three-quarters of total employment (73 per cent of employment), hence less than its share of all establishments.
Conversely, establishments in the public sector are larger than average; though accounting for only six per cent of establishments in Wales they employ around a fifth (19 per cent) of the workforce. Third sector employers
12% *% 5% 1% 9% 21% 10% 5% 2% 14% 2% 3% 8% 7% 2% 11% 2% 5% 16% 7% 5% 3% 11% 7% 10% 17% 4% A gri c ult ure M ining a nd Q ua rr y ing M a n u fa c tu ri n g E le c tr ic it y , G a s a nd W a te r C on s truc tion W ho le s a le a nd R e ta il H ot e ls a nd R e s ta ura nt s Tra ns po rt a nd C ommuni c a tion s Fina nc e S e rv ic e s B u s in e s s S e rv ic e s P ub lic A dmi nis tra tion E du c a tion H e a lt h a nd S oc ia l W ork C ommuni ty , S oc ia l a nd P e rs on a l S e rv ic e s a c tiv it ie s Establishments Employees
Number of establishments in Wales (rounded to nearest 100)
9,600 100 4,300 600 7,500 17,200 8,200 4,200 1,500 11,500 1,300 2,800 6,900 5,500
Employment in Wales (rounded to nearest 1,000)
27k 2k 130k 18k 56k 192k 81k 59k 30k 130k 85k 119k 194k 48k
account for a similar share of employment as establishments (seven and eight per cent respectively).
Region
As shown in Figure 2.3, two-fifths of establishments (40 per cent) are based in 2.9
south east Wales, and the region accounts for an even higher proportion of employment (49 per cent). Mid Wales is the smallest region with only 12 per cent of establishments and employing seven per cent of the workforce. North Wales and south west Wales are of similar size, each accounting for around a fifth to a quarter of both establishments and employees. All percentages shown on Figure 2.3 are within one percentage point of results reported in 2011.
Establishments in mid Wales are smaller than average: 66 per cent employ 2.10
fewer than five staff (compared to 54 per cent across Wales as a whole, and just under half (49 per cent) in south east Wales).
Figure 2.3: Establishments and employment by Region (March 2012)
Similarly, there is some difference in the sector distribution of establishments 2.11
between the different regions, as shown in Table 2.1. Mid Wales has a far higher proportion of Agriculture establishments, with over a third of
25%
12%
23%
40%
23%
7%
21%
49%
North Wales Mid Wales South west Wales South east Wales
Establishments Employees
Number of establishments in Wales (rounded to nearest 100)
20,500 9,900 18,600 32,300
Employment in Wales (rounded to nearest 1,000)
265k 81k 251k 573k
establishments in this region falling into this sector (36 per cent), three times the proportion across Wales as a whole (12 per cent). Eight per cent of establishments in mid Wales fall within the Business services sector, roughly half the level found in south west Wales and south east Wales (15 and 17 per cent respectively).
Table 2.1: Sector distribution within Region
Sector Wales North
Wales Mid Wales
South west Wales
South east Wales
Total number of establishments 81,300 20,500 9,900 18,600 32,300
% % % % %
Agriculture 12 11 36 14 4
Mining and Quarrying * * * * *
Manufacturing 5 6 3 5 6
Electricity, Gas and Water 1 1 * 1 1
Construction 9 9 8 9 10
Wholesale and Retail 21 21 16 22 23
Hotels and Restaurants 10 12 9 10 9
Transport and Communications 5 5 3 5 6
Financial Services 2 1 1 2 3
Business Services 14 12 8 15 17
Public Administration 2 1 1 1 2
Education 3 4 3 3 4
Health and Social Work 8 9 7 7 9
Community, Social and Personal
Services activities 7 8 5 7 7
Source: ONS IDBR March 2012
The structure of establishments
The size of an establishment is important in that it determines both the scale 2.12
of the skills and employment challenges employers face and the ways in which they are able to respond to these challenges. However, an
establishment can be part of a wider organisation, and hence the size of an establishment does not necessarily tell a complete story about, for example, its access to skills or other resources.
Just over a third of all establishments in Wales (35 per cent) report that they 2.13
While around two-thirds of establishments in Wales were single site 2.14
3
Employers’ experience of skill shortages
Chapter Summary
In line with the economic outlook of the UK, the survey supports a picture of 3.1
an economy in Wales which is moving towards recovery. The number of employers reporting vacancies at the time of the survey (March to July 2013) was higher than at the equivalent time in 2011 (up from 12 per cent to 14 per cent), as was the number of vacancies that they reported (in 2011, the number of vacancies was equivalent to 1.9 per cent of the total workforce, rising to 2.2 per cent in 2013).
Economic growth and recovery may be constrained by skill shortages as the 3.2
labour market responds to employer requirements. While in most cases demand for skills is met through successful recruitment, almost three in ten vacancies were reported to be hard to fill, and shortages in suitably skilled, qualified and/or experienced workers were the main reason for this. Overall, such skill-shortage vacancies represented a fifth of all vacancies (20 per cent), up from 18 per cent in 2011.
The frequency with which skill shortages are encountered when recruiting 3.3
differs by occupation. Skilled Trades represented the most common
occupation where skill shortages are likely to be encountered when employers recruit for these roles (in 2011 it was Machine Operatives). The pattern among other occupations has remained broadly the same as 2011, although there has been a heightened challenge regarding recruiting suitably skilled Caring, Leisure and Other services, Skilled Trades, and Administrative occupations. Technical, practical and job-specific skills were those most commonly lacking 3.4
Introduction
The UK Commission’s Employer Skills Survey 2013 provides a picture of the 3.5
level and nature of employer demand for new staff and the ability of the labour market to meet such demand. This sets the context for then exploring
imbalances and mismatches in the labour market that result from a lack of skills.
The key measures used in this chapter are as follows: 3.6
Following a brief analysis of vacancies, this chapter focuses specifically on 3.7
skill-shortage vacancies (those vacancies that employers find difficult to fill specifically as a result of a lack of applicants in the labour market with the required skills, qualifications and/or experience). Of course, skill-shortage vacancies are just one cause of recruitment difficulties. Other causes can relate to the job itself (e.g. perceived poor rates of remuneration, unsociable hours etc.) and these are discussed at the end of the chapter. However, skill-shortage vacancies are of particular policy interest because the education and training system can clearly influence the supply of suitably skilled applicants. The chapter examines the incidence, volume and profile of skill-shortage vacancies, before exploring the specific skills that employers find lacking and the impact that this has.
Vacancies
Most employers had recent experience of recruitment. The latest version of 3.8
the UK Commission’s Employer Perspectives Survey (Shury et al., 2012) reported that around four in every ten (43 per cent) employers in Wales had at least one vacancy over the 12 months prior to the survey. However, at any one point in time, the majority of establishments were not looking to recruit
Vacancies Hard-to-fill
vacancies
Incidence
Density
Skills-shortage vacancies
The proportion of establishments reporting at least one
vacancy
The number of vacancies per
employee
The proportion of establishments reporting at least one
hard-to-fill vacancy
Hard-to-fill vacancies as a proportion of all
vacancies
The proportion of establishments reporting at least one skill-shortage vacancy
Skill-shortage vacancies as a proportion of all
new staff; 14 per cent of establishments in Wales had a current vacancy at the time of ESS2013 fieldwork (similar to the overall UK figure of 15 per cent). Although most employers reported having no current vacancies, there has 3.9
been a small but statistically significant increase in recruitment activity since the 2011 survey when 12 per cent of establishments in Wales reported having a vacancy.
In total, there were around 26,000 vacancies in Wales at the time of the 3.10
survey (equivalent to 2.2 per cent of total employment). This is an increase of 14 per cent compared to 2011 when there were around 22,000 vacancies (equivalent to 1.9 per cent of total employment).
As shown in Table 3.1, evidence of a recovery in the labour market is 3.11
particularly marked in north Wales and south west Wales, where both the incidence and density of vacancies have increased since 2011. Note that whilst the number of vacancies as a proportion of employment has decreased since 2011 in mid Wales – from 2.9 per cent in 2011 to 1.8 per cent in 2013 – this decrease is not statistically significant.
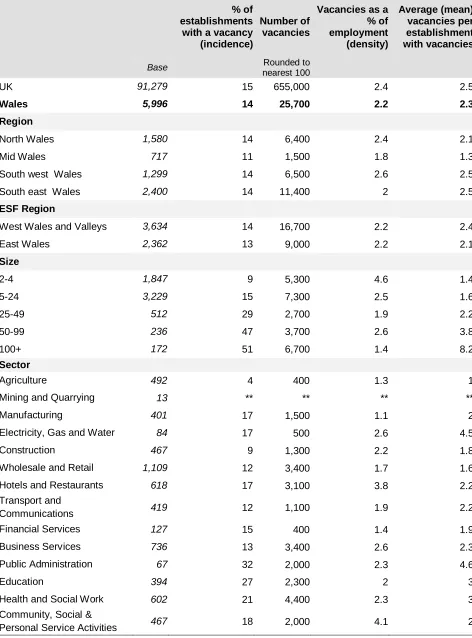
Table 3.1: Incidence and density of vacancies, by region (2011 vs. 2013)
% of establishments with a vacancy (incidence)
Vacancies as a % of employment (density) Unweighted base 2011 2013 2011 2013
2011 2013 % % % %
UK 86,522 91,279 14 15 2.2 2.4
Wales 5,958 5,996 12 14 1.9 2.2
Region
North Wales 1,420 1,580 11 14 1.6 2.4
Mid Wales 788 717 11 11 2.9 1.8
South west Wales 1,376 1,299 11 14 2.0 2.6
South east Wales 2,374 2,400 14 14 1.9 2.0
ESF Region
West Wales and
the Valleys 3,696 3,634 12 14 2.0 2.2
East Wales 2,262 2,362 13 13 1.8 2.2
Base: All establishments
There was substantial variation in the extent and pattern of recruitment activity 3.12
by size of establishment and by sector. Whilst the proportion of
establishments reporting vacancies increased with the size of establishment (from nine per cent among establishments with 2-4 employees to 51 per cent among employers with 100+ employees), the density of vacancies were larger among the smaller establishments. By sector, the proportion of establishments reporting vacancies ranged from four per cent in Agriculture to 32 per cent in Public Administration, while the density of vacancies ranges from 1.1 per cent of total employment in Manufacturing to 4.1 per cent in Community, Social & Personal Service Activities.
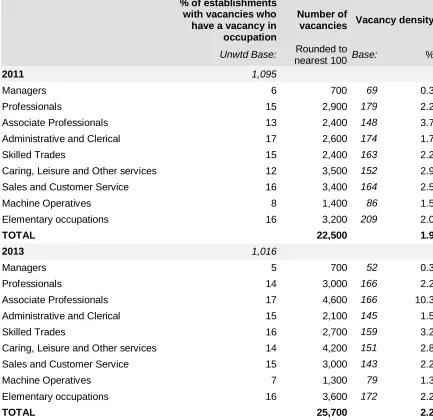
The survey also identifies the occupational groups and jobs where vacancies 3.13
exist4. The occupational group with the highest level of demand was Associate Professionals (around 10 vacancies for every 100 people working in this role). Although also the one occupational group with the highest vacancy density in 2011, in that year the level of demand was much lower (when there was four vacancies for every 100 Associate Professional roles). This is also the
occupation for which employers were most likely to report vacancies (17 per cent of employers with vacancies did so).
Tables A.3.1 and A.3.2 in Annex A provide a detailed breakdown of 3.14
recruitment activity by region, size of establishment, sector and occupation.
Skill-shortage vacancies
Although recruitment activity has increased, the labour market typically is able 3.15
to meet employer requirements with approaching three-quarters of vacancies across Wales (72 per cent) reported as not difficult to fill5. However, the majority of hard-to-fill vacancies are, at least in part, a result of a lack of skills, qualifications or experience amongst applicants (71 per cent)6 and this is similar to – although significantly lower than the UK overall (77 per cent). The rest of this section explores these skill-shortage vacancies in more detail.
4
For a definition of occupational groups, see Appendix C.
5
Of course very recent vacancies may not initially be described as hard-to-fill but may become so over time.
6
During the survey, employers were first asked to give their reasons for not being able to fill vacancies spontaneously (i.e. without being presented with a list of possible reasons). Any
The incidence, volume and density of skill-shortage vacancies
For the vast majority of establishments, demand for skills is met through 3.16
successful recruitment (or through their current workforce, as will be explored in the next chapter). Only four per cent of establishments in Wales reported having vacancies at the time of the survey that they were having difficulties filling due to a lack of skills, qualifications or experience in applicants for the role (this is in line with the four per cent reported for the UK overall).
While it is relatively uncommon for employers to report such skills shortages, 3.17
this represents a small but significant increase from the three per cent reported in 2011. Moreover, the proportion of all vacancies that employers found hard to fill at least in part due to a shortage of skills, experience or qualifications in the labour market (often referred to as skill-shortage vacancy density) has increased from 18 per cent to 20 per cent. Results differed little by region, other than significantly fewer vacancies in north Wales being hard to fill at least in part due to skill shortages (14 per cent).
It should be remembered when considering the density of skill-shortage 3.18
vacancies reported in this chapter that they affect only a small proportion (four per cent) of employers.
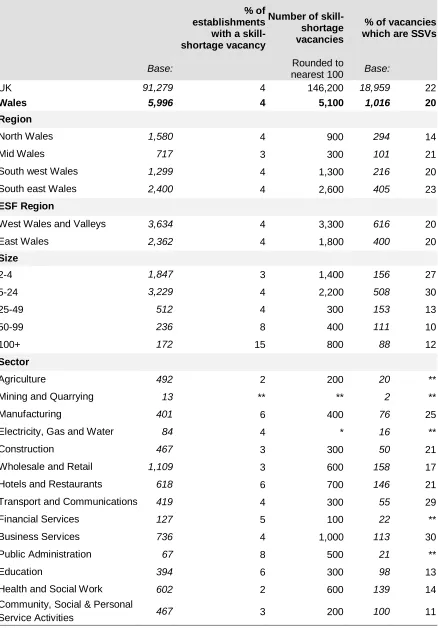
Table 3.2: Incidence and density of skill-shortage vacancies (SSVs) by region (2011 vs. 2013)
% of establishments with an SSV (incidence)
% of vacancies which are SSVs (density)
Unwtd base 2011 2013 Unwtd base 2011 2013 2011 2013 % % 2011 2013 % % UK 86,522 91,279 3 4 17,093 18,959 16 22
Wales 5,958 5,996 3 4 1,095 1,016 18 20
Region
North Wales 1,420 1,580 2 4 245 294 17 14
Mid Wales 788 717 4 3 151 101 32 21
South west Wales 1,376 1,299 4 4 254 216 16 20
South east Wales 2,374 2,400 3 4 445 405 16 23
ESF Region
West Wales and
the Valleys 3,696 3,634 3 4 666 616 16 20
East Wales 2,262 2,362 3 4 429 400 21 20
Base: Columns 1 and 2 all establishments; Columns 3 and 4 all establishments with vacancies Percentages in Columns 3 and 4 are shown as a proportion of all vacancies.
Since 2011 the proportion of vacancies that were hard-to-fill due to a lack of 3.19
skills, qualifications or experience in applicants has increased in south east Wales. Other regional differences seen in Table 3.2 are not statistically significant.
As in 2011, vacancies in smaller establishments were more likely to be hard-3.20
to-fill due to the difficulties in finding applicants with appropriate skills, qualifications or experience. Over a quarter (27 per cent) of all vacancies in establishments with fewer than five staff and three-in-ten of those with
between 5-24 staff were hard-to-fill as a result of a lack of skills, qualifications or experience compared to 10 per cent amongst those with 50-99 staff and 12 per cent in the establishments with 100 or more employees.
By sector, the proportion of vacancies reported as hard-to-fill as a result of a 3.21
lack of skills, qualifications or experience ranged from 11 per cent in
Community, Social and Personal Service Activities to 30 per cent in Business Services. Most sectors have experienced an increase in skill-shortage
vacancy density since 2011 with the increase most pronounced in Transport and Communications (from 21 per cent in 2011 to 29 per cent in 2013) and in Education (from five per cent in 2011 to 13 per cent in 2013). In the
Manufacturing, Construction, Hotels and Restaurants, Transport and Communications, and Business Services sectors at least a fifth of all
vacancies were skill-shortage vacancies in both 2011 and 2013, suggesting the presence of persistent skills issues.
Two sectors bucked the general trend and reported reductions in their 3.22
densities of skill-shortage vacancies: Construction (21 per cent, down from 29 per cent in 2011) and Community, Social and Personal Service Activities (11 per cent, down from 18 per cent in 2011).
Tables A.3.3 and A.3.4 in Annex A provide a detailed breakdown of skill-3.23
shortage vacancies by region, size and sector.
By occupation the number of skill-shortage vacancies was highest among 3.24
Operatives (25 per cent, though this represents a decrease from the 39 per cent reported in 2011). In 2011 the density of skill-shortage vacancies was highest among Machine Operatives (39 per cent) and Skilled Trades (33 per cent).
Figure 3.1: Density and number of skill-shortage vacancies by occupation (2011 vs. 2013)
Skills lacking in the available labour market
Employers who reported having vacancies that were difficult to fill because of 3.25
skill-shortages were read a list of types of skills and asked, for each
occupation in which they reported skill-shortage vacancies, which skills were lacking.
Around seven in ten (69 per cent) of all skill-shortage vacancies were ascribed 3.26
to a lack of technical, practical or job-specific skills.
Generic or “softer” skills such as planning and organisation, oral 3.27
communication, customer handling, problem solving, written communication and numeracy skills were each cited in connection with between one-third and around two-fifths of all skill-shortage vacancies.
Base for boxes: All establishments (5,996)
Base for bars: All establishments with vacancies (as shown)
2011: (69) (179) (148) (174) (163) (152) (164) (86) (209)
2013: (52) (166) (166) (145) (159) (151) (143) (79) (172) 12%
17%
22%
6%
33%
12%
11%
39%
19% 17%
19%
11%
16%
44%
28%
14%
25%
12%
0% 5% 10% 15% 20% 25% 30% 35% 40% 45% 50%
2011 SSV density 2013 SSV density
120 570 520 330 1,200 1,200 410 330 430
Figure 3.2 shows results based on the total number of skill-shortage 3.28
vacancies (as opposed to establishments with skill-shortage vacancies).
Figure 3.2: Skills lacking among applicants (prompted)
Results are broadly similar to 2011 although there has been an increase in the 3.29
proportion of skill-shortage vacancies resulting from a lack of written Welsh language skills (15 per cent, up from nine per cent in 2011) and numeracy skills (33 per cent, up from 26 per cent in 2011)7.
The impact of skill-shortage vacancies on employers
Although skill-shortage vacancies are only reported by a small minority of 3.30
employers (four per cent), for those that have them the impact can be significant. In total, 97 per cent of employers that had difficulty filling their
7
There has also been a marked decrease in the proportion of skill-shortage vacancies attributed to a lack of technical, practical or job specific skills. However, it should be noted that in 2011 there were separate codes for “technical/practical skills” and “job-specific skills”. The extent to which the combining of these into one single “technical, practical or job specific skills” code has impacted on this decrease is difficult to tell.
9% 13%
15% 18% 18%
26% 28%
31% 33% 33%
37% 38%
42% 44%
69%
Foreign language skills Oral Welsh language skills Written Welsh language skills Basic computer literacy / using IT Advanced IT or software skills Strategic Management skills Literacy skills Team working skills Numeracy skills Written communication skills Problem solving skills Customer handling skills Oral communication skills Planning and Organisation skills Technical, practical or job specific skills
vacancies solely as a result of skill shortages8 reported that these were having an impact on the establishment.
Most commonly the impact of skill-shortage vacancies was felt on other staff, 3.31
with 90 per cent of these employers reporting that skill-shortage vacancies resulted in an increased workload for other staff (see Figure 3.3).
Approaching half of employers that had difficulty filling their vacancies solely 3.32
as a result of skill shortages reported that they were having a more direct impact on the organisation in terms of causing difficulties in meeting customer service objectives (49 per cent), delays developing new products or services (47 per cent), a loss of business or orders to competitors (45 per cent) or increased operating costs (43 per cent).
The landscape has changed very little since 2011 in terms of the impact of 3.33
skill-shortage vacancies and the relative prevalence of each of the impacts.
Figure 3.3: Impact of skill-shortage vacancies (prompted)
8
The survey does not measure the impact of skill-shortage vacancies on employers specifically (i.e. it does not ask employers with skill-shortage vacancies what the impacts of these are on the establishment, only the impact of vacancies that are proving difficult to fill as a whole). However, we can isolate the effect of skill deficiencies by exploring the impact of hard-to-fill vacancies in establishments where all the hard-to-fill vacancies were caused, at least in part, by skills-related issues. Given the majority of establishments with hard-to-fill vacancies fall into this group (76 per cent) – in part reflecting that the majority have just a single vacancy that proved difficult to fill - this is a suitable sample from which we can gain a robust measurement.
3%
23% 24%
32% 37%
38% 43%
45% 47%
49%
90%
None Withdraw from offering certain products / services
Difficulties introducing technological change Outsource work Have difficulties meeting quality standards Have difficulties introducing new working practices Experience increased operating costs Lose business or orders to competitors Delay developing new products or services Difficulties meeting customer services objectives Increased workload for other staff