Research and Information Service
Research Paper
Research and Information Service briefings are compiled for the benefit of MLAs and their support staff. Authors are available to
30
thAugust 2016
Caroline Perry
Programme for Government:
Education
NIAR 209-16
This research paper considers the Department of Education’s role in the current and previous Programmes for Government (PfG). It discusses the extent to which the Department met its commitments for the 2011-15 PfG, and considers the indicators
and measures in the draft PfG for 2016-21.
Executive Summary
Introduction
This research paper considers the Department of Education’s (the Department’s) role in the current and previous Programmes for Government (PfG). It discusses the extent to which the Department met its commitments for the 2011-15 PfG, and considers the indicators and measures set out in the draft PfG 2016-21.
Programme for Government 2011-2015
The Department had eight key commitments within the 2011-15 PfG, and each
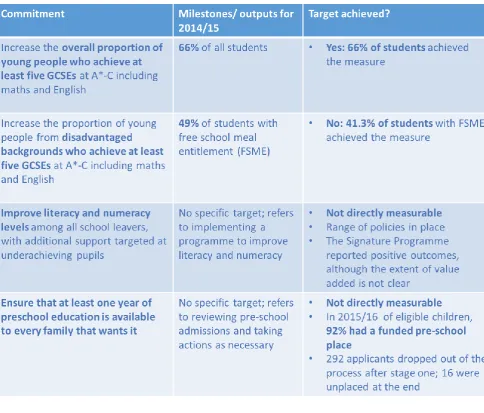
[image:3.595.76.561.330.743.2]commitment included annual milestones or outputs. Table 1 below discusses the extent to which the Department achieved its commitments on achievement and pre-school. Subsequently, Table 2 considers the remaining commitments on shared education.1
Table 1: PfG commitments 2011-15 on achievement and pre-school provision
NIAR 209-16 Research Paper
Northern Ireland Assembly, Research and Information Service 4
As Table 1 above shows, the Department achieved its objective to improve GCSE outcomes for pupils overall, but failed to meet its target for disadvantaged students by 7.7%. The targets on improving literacy and numeracy and pre-school were not directly measurable. However, it is notable that 8% of eligible children did not attend DE-funded pre-school, and that almost 300 applicants left the process after stage one. In line with the overarching aim of the PfG 2011-15 of building “a shared and better
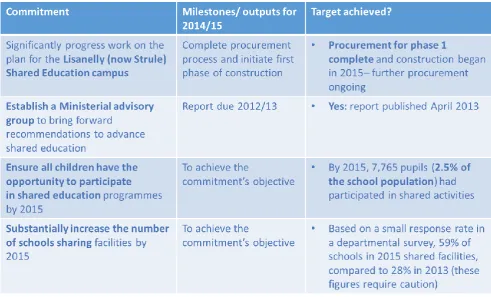
[image:4.595.71.563.241.538.2]future for all,” a number of commitments related to shared education, as illustrated in Table 2 below.
Table 2: PfG commitments 2011-15 on shared education
As Table 2 above illustrates, the Department achieved its aim of beginning construction for phase one on the Strule Shared Education Campus, although the procurement process continues for other parts of the site. In addition, the Department achieved its commitment for a ministerial advisory group on shared education.
However, evidence suggests that the Department has not achieved the commitment to ensure that all children have the opportunity to take part in shared education
programmes, with only 2.5% of the school population having participated by 2015. The data on schools sharing facilities is not adequately robust to assess whether the Department succeeded in increasing this practice.
Programme for Government 2016-2021
The draft PfG for the period 2016-2021 adopts an outcomes-based approach,
address societal issues, with an emphasis on effects and impacts rather than on programme delivery. However, it does not provide defined targets, which could present challenges for accountability and transparency.
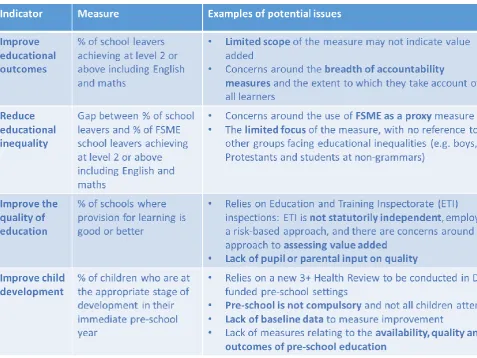
[image:5.595.77.555.223.581.2]The Department will play an important role in working to deliver Outcome 14: “we give our children and young people the best start in life.” It has overall responsibility for four indicators, and will likely contribute to many others. Table 3 below provides a brief overview of these indicators and a number of potential issues.
Table 3: Brief overview of Department of Education indicators in the PfG 2016-21
The PfG includes a number of other indicators for which the Department does not have overall responsibility, but may contribute to. These include:
Improving support for looked after children;
Improving the skills population of the population;
A number of indicators on reconciliation and respect;
Indicators in regard to justice (the Department is now responsible for educational provision for young people in custody); and
NIAR 209-16 Research Paper
Northern Ireland Assembly, Research and Information Service 6
Conclusion
The Department achieved some, but not all of its commitments from the previous PfG. In addition, some commitments were not directly measurable, preventing an accurate assessment of its achievements.
The new outcomes-based approach of the PfG 2016-21 may have implications for transparency and accountability. There are also a number of potential issues with many of the measures associated with PfG indicators, for example, their scope and
robustness. Further areas for consideration might include:
The failure to meet the previous PfG target on disadvantaged learners, and how the Department plans to meet the Count Read: Succeed target of 65% of FSME pupils achieving the measure by 2019/20;
The value added by the Signature Programme on literacy and numeracy;
The effectiveness of the Department’s actions on shared education;
The availability and quality of pre-school education across Northern Ireland;
The robustness of the data collected for the PfG, for example, in relation to schools sharing facilities and the lack of baseline data for some indicators; and Indicators that have not been included, for example, in relation to
Contents
Executive Summary ... 3
Contents 1 Introduction ... 9
2 PfG 2011-15: overview ... 9
3 PfG 2011-15: Department of Education achievements ... 9
4 PfG 2016-21: overview ... 15
5 PfG indicator: improve educational outcomes ... 16
6 PfG indicator: reduce educational inequality ... 18
7 PfG indicator: improve the quality of education ... 22
8 PfG indicator: improve child development ... 24
9 PfG 2016-2021: other relevant indicators ... 26
1
Introduction
This Briefing Paper considers the previous Programme for Government (PfG) 2011-15, discussing whether the Department of Education (the Department) achieved its
commitments. It also explores the draft PfG 2016-21, looking at each of the outcomes and indicators most relevant to the Department.
2
PfG 2011-15: overview
The previous PfG outlined 83 commitments with the overarching aim of building “a
shared and better future for all.” The Department of Education had eight commitments within the PfG 2011-15, contributing to five of its priorities:2
Growing a sustainable economy and investing in the future;
Creating opportunities, tackling disadvantage and improving health and well-being;
Building a strong and shared community; and
Delivering high quality and efficient public services.
Each commitment included milestones or outputs for each year from 2012/13 to 2014/15, providing measureable outcomes for some of the commitments. Other commitments are more difficult to measure as they did not include specific targets.
3
PfG 2011-15: Department of Education achievements
This section considers each of the Department’s commitments in turn, noting whether it achieved the targets and milestones detailed within the 2011-15 PfG.
Improving GCSE outcomes
The PfG 2011-15 included a commitment to improve GSCE outcomes. This was set out in two parts: the first to improve results for all school leavers, and the second to improve performance among disadvantaged students, measured using pupil entitlement to free school meals (FSM).
The GCSE targets are taken from the Department’s literacy and numeracy strategy,
Count Read: Succeed,3 and refer to the proportion of pupils and disadvantaged pupils
achieving the threshold measure of five GCSEs at grades A*-C including English and maths.
2 Northern Ireland Executive (2012) Programme for Government 2011-15 Belfast: Office of the First Minister and deputy First
Minister. Note: the final priority was “protecting our people, the environment and creating safer communities”
NIAR 209-16 Research Paper
Northern Ireland Assembly, Research and Information Service 10
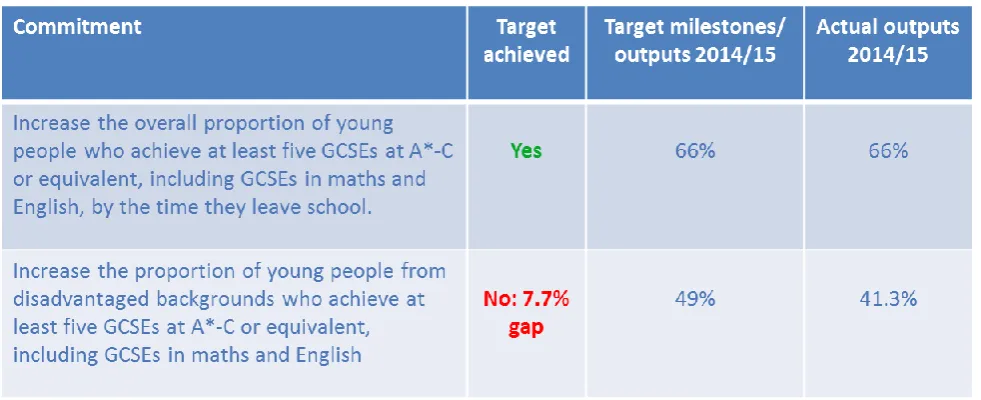
Table 4 below indicates that the Department achieved its target to improve GCSE outcomes of all pupils, with 66% achieving the threshold measure in 2014/15.
[image:10.595.71.562.199.399.2]However, it failed to improve performance among disadvantaged students to the target level (41.3% achieved the measure, against a target of 49%). In addition, Count Read: Succeed sets a further, long-term, target for 2019/20, of 65%+ pupils with entitlement to FSM achieving the threshold measure.
Table 4: Commitment to improve GCSE outcomes
Improving literacy and numeracy levels
The PfG contained a commitment to “improve literacy and numeracy levels among all
school leavers, with additional support targeted at underachieving pupils.” This commitment did not set specific targets. Instead, it stated that the Department should develop proposals to improve literacy levels in 2012/13, and implement and monitor the programme in the subsequent two years.
Policy and initiatives
The Department states that it already had a number of policies and programmes to contribute to the PfG targets, including Count Read: Succeed; Every School a Good School; benchmarking data; programmes such as Sure Start and Extended Schools; and programmes addressing underachievement in disadvantaged areas.4
Delivering Social Change Signature Programme on improving literacy and numeracy
One of the programmes aiming to target underachievement in disadvantaged areas was the Office of the First Minister and deputy First Minister (OFMdFM) Delivering Social Change Signature Programme on improving literacy and numeracy.
This programme involved employing recently graduated, out of work, teachers to provide tuition for children in primary and post-primary schools who were not likely to achieve even basic educational standards. The Programme aimed to:5
Increase the number of primary pupils, particularly those entitled to FSM, achieving at or above the expected level at the end of Key Stage 2 in literacy and numeracy;
Increase the number of post-primary primary pupils, particularly those entitled to FSM, achieving at least a grade C or above in English and maths; and
Provide employment opportunities for 230 recently graduated teachers.
Across the two years of the programme, 2013/14 and 2014/15, a total of 18,653 pupils received support from 293 schools, at a total cost of £15.7m (£1.9m from the
Department of Education).6
Outcomes of the Literacy and Numeracy Programme
A 2015 Education and Training Inspectorate (ETI) evaluation found “highly effective” practice in supporting pupils at risk of underachievement in the majority of schools inspected.7
The Project Manager at the Education Authority (EA) prepared reports on the outcomes of the Programme. They reported positive results, with 76% of supported primary pupils achieving Level 4 in Communication in English at Key Stage 2, and 65% of post-primary pupils achieving a grade C or above in GCSE English. It states that pupils identified for support had not been expected to achieve these results.8
However, the report raises a number of questions around the extent to which reported improvements in outcomes were directly attributable to the programme (value added). These include:
A lack of clarity around the criteria used to select pupils who were not likely to achieve the expected level (this was up to each individual school), and a lack of robust baseline data;
Data on Delivering Social Change (DSC) intervention schools and non-DSC schools were collected only one year prior to the programme (making analysis of longer-term trends difficult);9
5 Northern Ireland Executive (2015) Delivering Social Change Literacy & Numeracy Signature Programme: Year 1 Interim
Report Belfast: Northern Ireland Executive
6 Northern Ireland Executive (2016) Delivering Social Change Literacy and Numeracy Signature Programme: Year 2 Final
Report Bangor: Department of Education
7 Education and Training Inspectorate (2015) An Evaluation of the Implementation of the Delivering Social Change: Improving
Literacy and Numeracy Signature Programme Bangor: ETI
8 Northern Ireland Executive (2016) Delivering Social Change Literacy and Numeracy Signature Programme: Year 2 Final
Report Bangor: Department of Education
NIAR 209-16 Research Paper
Northern Ireland Assembly, Research and Information Service 12
The report highlights large increases in the proportion of pupils with free school meal entitlement (FSME) achieving the GCSE threshold measure, but does not appear to take account of factors such as the expanded FSME eligibility
criterion from September 2014 and wider year-on-year improvements in outcomes among pupils with FSME;
The non-DSC schools used as a comparison to show improvement over time are grammar schools (whose performance tends to stay relatively static); and A lack of comparison to other interventions.
Supporting pre-school provision
A further commitment was to “Ensure that at least one year of pre-school education is
available to every family that wants it.” Again, the PfG did not include specific targets. Instead, it stated that the Department should identify reasons why parents do not avail of places; implement the Review of Pre-school Admissions; implement changes to encourage parents to take up places; and review progress.
Pre-School Education Programme
The DE funds one year of non-compulsory pre-school education through the Pre-School Education Programme, to children in their immediate pre-school year.10 The EA
manages the application process and is responsible for ensuring that there is adequate pre-school provision in local areas through the Pre-School Education Advisory Groups (PEAG).11
In the 2015/16 school year almost 24,200 children had a funded pre-school place: 92% of Northern Ireland’s eligible population.12 Just over a third (36%) of these pupils are
enrolled in voluntary and private setting, with 38% in nursery classes in primary schools. Other provision includes nursery schools and reception classes.
Department of Education statistics indicate a steady increase in funded pre-school enrolments over the past ten years, broadly in line with population estimations. The greatest increase in enrolments has been in the voluntary and private sector, with limited increases in the statutory sector.13
Data from the Department of Education indicates that in 2016/17, 96% of applicants were offered a place at stage one of the two-stage process, with 87% of applicants
10 Eurydice (2015) United Kingdom (Northern Ireland) Early Childhood Education and Care [online] Available at:
https://webgate.ec.europa.eu/fpfis/mwikis/eurydice/index.php/United-Kingdom-Northern-Ireland:Early_Childhood_Education_and_Care
11 Information provided by the Department of Education, August 2016
12 Department of Education (2016) Annual enrolments at schools and in funded pre-school education in Northern Ireland,
2015/16 Bangor: DE
13 Department of Education (2016) Annual enrolments at schools and in funded pre-school education in Northern Ireland,
offered their first preference. A total of 292 applicants dropped out of the process at stage one, with 16 applicants unplaced by the end of the process.
Progress work for Lisanelly Shared Education campus
The PfG also committed to “significantly progress work on the plan for the Lisanelly
Shared Education campus as a key regeneration project.” In 2014/15 the target milestone was to complete the procurement process and initiate the first phase of construction.
The procurement process for Phase 1 of what is now known as the Strule Shared Education Campus was complete by the end of 2014/15. This relates only to the construction of Arvalee School and Resource Centre and the site-wide demolition of existing buildings. Construction of Arvalee began in March 2015 and is due for completion in August 2016. Demolition finished in February 2016.
With regard to delivery of the rest of the campus, a contract for an Integrated Consultant Team to design and manage this phase (Phase 1) was awarded in November 2015.14
Further contracts for site preparation works are expected for award in October 2016, with procurement of a contract for main building works due summer 2017. A further contract on grass pitches will also be required.15 The Campus is expected to open in
2020.16
Establish a Ministerial advisory group on shared education
A further commitment in relation to shared education was to “establish a Ministerial
advisory group to explore and bring forward recommendation to the Minister of Education to advance shared education.”
In July 2012 the Minister for Education, John O’Dowd MLA, established the advisory group, and the group published its report on April 2013.17 The Minister accepted some
of the recommendations, noting that others would require further consideration.18
Ensuring access to shared education opportunities
The third commitment in relation to shared education was to “ensure that all children
have the opportunity to participate in shared education programmes by 2015.” The milestones were to define objectives in terms of participation in shared education programmes, put measures in place and achieve the overall commitment objective in 2014/15.
14 Information provided by the Department of Education, August 2016 15 Information provided by the Department of Education, August 2016
NIAR 209-16 Research Paper
Northern Ireland Assembly, Research and Information Service 14
However, by 2015, just 7,765 pupils19 had participated in a programme of shared
activities, representing 2.5% of the primary and post-primary population in 2014/15.20
The Department advises that it has taken a number of actions to increase shared education, although most of these came at the end of, or post-dated, the PfG period. These include:21
A Framework for School Collaboration (November 2014);
The Sharing Works policy (September 2015);
The Shared Education Act 2016;
The £25m DSC Shared Education Signature Project (2015/16-2018/19); and
Peace IV funding: due to commence in 2016/17 with a target of 19,200 pupils by 2018/19 and 144,000 by 2020/21.22
Increase sharing of facilities
The final commitment in relation to shared education was to “substantially increase the
number of schools sharing facilities by 2015.” The milestones were to define the objectives in terms of sharing facilities, put measures in place, and in 2014/15, to
“achieve overall commitment objective.”
The Department notes that its Sharing Works policy helped to shape and drive the expansion of sharing programmes; however, this was published towards the end of the PfG period in September 2015. As noted above, a number of other actions post-dated the PfG period. The Shared Education Campuses Programme launched in January 2014. The Department advises that in its School Omnibus Survey: 23
In 2013 of the 593 schools that responded, 28% said that they had shared facilities; and
In 2015 of the 450 schools that responded, 59% shared facilities.
It is important to note that a large proportion of schools did not respond, therefore these figures may not be representative. Consideration could be given to the robustness of data collection in this regard.
19 Information provided by the Department of Education, August 2016
20 Department of Education (2015) Enrolments at schools and in funded pre-school education in Northern Ireland, 2014/15
Bangor: DE
21 Information provided by the Department of Education, August 2016
Establishing an Education and Skills Authority (withdrawn)
The last commitment was to make the Education and Skills Authority (ESA) operational in 2013. However, the Executive agreed to withdraw this commitment from the PfG.24
Nonetheless, the Education Act (Northern Ireland) 201425 provided for the Education
Authority (EA), which came into operation on 1st April 2015 (although the EA differs
from the original plans for the ESA).26
4
PfG 2016-21: overview
The draft PfG 2016-21 presents a cultural change for the public sector. It adopts a new approach, focusing on outcomes and setting out “generational” ambitions to address societal issues. The emphasis is on impacts and effects on people’s lives, rather than on programme delivery. A further key change is that the PfG provides scope for organisations beyond government to contribute to plans and actions. It includes:27
Indicators to demonstrate the nature of planned changes; and
Measures to provide evidence of progress.
The consultation for the draft PfG ran from the 27th May 20 until the 22nd July 2016.
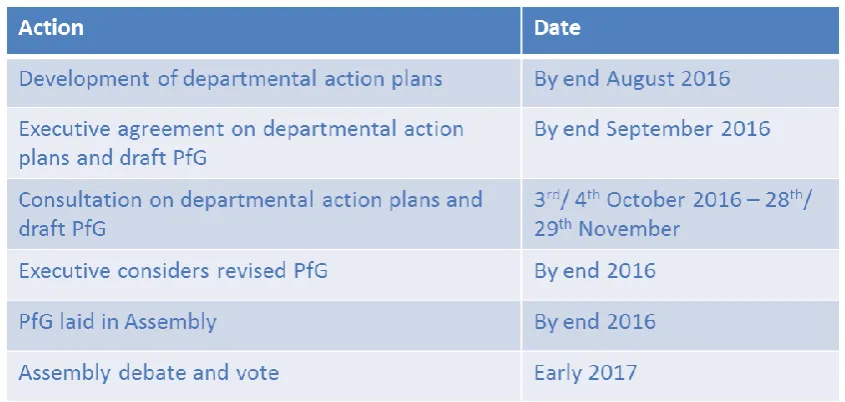
[image:15.595.97.520.441.642.2]While the draft PfG does not detail timeframes, Table 5 below provides an indication of the possible timescales for the PfG process.
Table 5: Indicative timescales for the PfG process
24 Department of Education Programme for Government - Department of Education commitments [online] Available at:
https://www.education-ni.gov.uk/programme-government-department-education-commitments
25 Legislation.gov.uk Education Act(Northern Ireland) 2014 [online] Available at:
http://www.legislation.gov.uk/nia/2014/12/contents
26 Education Authority About Us [online] Available at: http://www.eani.org.uk/about-us/
NIAR 209-16 Research Paper
Northern Ireland Assembly, Research and Information Service 16
The draft PfG details fourteen outcomes.28 The Department of Education will have a
key role (among other departments) in achieving Outcome 14: “we give our children
and young people the best start in life,” although it is also likely to contribute to other outcomes. It notes:
This outcome is about ensuring that all of our children grow up in a society that provides the support they need to achieve their potential. This includes good health, a secure family and community environment including an adequate standard of living, education, opportunities for cultural and artistic expression, opportunities to make a positive contribution to society, physical exercise, space to play, and protection from harm and violence.29
The PfG sets out the role of the Executive in achieving this outcome, including: Supporting families to care for children;
Providing high-quality education, including pre-school education;
Supporting opportunities for play, recreation and creativity; and
Ensuring the involvement of children and young people in developing those services.
In contrast to the 2011-15 PfG, which detailed specific and measurable outputs, the draft 2016-21 PfG framework document does not specify the extent of change or the timescales for it.
Consideration therefore could be given to the implications of this lack of defined outcomes for accountability and transparency.
PfG 2016-2021: Department of Education key indicators
The PfG framework details four indicators for which the Department of Education has overall responsibility. The following sections consider each of the indicators, and highlight a number of potential areas for consideration.
5
PfG indicator: improve educational outcomes
The PfG document highlights the link between educational outcomes and life opportunities, economic success and health, and notes the particular importance of numeracy and literacy skills.
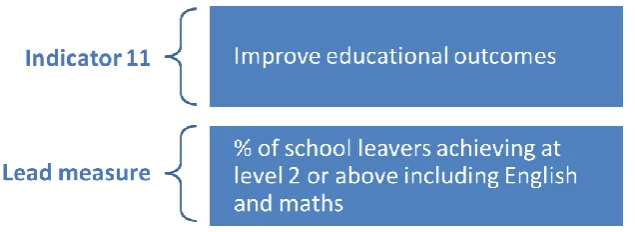
Figure 1: Indicator 11 on improving educational outcomes
Level 2 refers to GCSEs at grades A*-C, as well as equivalent qualifications (could include NVQ level 2; Higher Diploma; and Functional Skills level 2).30 In 2014/15
two-thirds (66%) of school leavers achieved level 2 including English and maths, and there has been a year-on-year increase since 2008/09 (when 58.4% achieved this).31
Limited scope
The OECD reports that the targets used to evaluate the education system in Northern Ireland have limited scope. It notes that while student achievement information is a valid outcome measure, such outcomes are often linked to a range of factors outside government’s control, and therefore cannot be simply attributed to government action.32
Evidence suggests that internationally, countries frequently complement performance data with a wide range of education indicators, based on demographic, administrative and contextual data collected from schools. It also notes that international
benchmarking is increasingly common.33
Indeed, the PfG approach measures only the educational outcome of students
achieving level 2 or above. It does not include value added measures, which can take account of students’ prior achievement or socio-economic background (a key factor in educational outcomes), allowing for measurement of the value the education system has added.
Concerns around equivalent qualifications
The 2013 CCEA review of A levels and GCSEs highlighted concerns around the profile and use of equivalent or vocational qualifications, and around acknowledging the range of learners within the education system. It stated that:34
30 Gov.uk (2016) Compare different qualifications [online] Available at:
https://www.gov.uk/what-different-qualification-levels-mean/compare-different-qualification-levels
31 Data provided by the Department of Education, February 2016 and Department of Education School Leavers [online]
Available at: https://www.education-ni.gov.uk/articles/school-leavers
32 Shewbridge, C., Hulshof, M., Nusche, D., Stenius Staehr, L. (2014) OECD Reviews of Evaluation and Assessment in
Education: Northern Ireland OECD Publishing
NIAR 209-16 Research Paper
Northern Ireland Assembly, Research and Information Service 18
There is a need for expansion and greater recognition of non-general qualification pathways to reflect the diversity of learners;
There is a lack of awareness of the availability and benefits of qualifications other than GCSEs and A Levels;
Some stakeholders do not give qualifications other than GCSEs and A Levels the “currency or recognition they deserve”;
Accountability measures should be broader and considered holistically; and
There is a need to develop alternative level 2 qualifications in literacy and numeracy to complement GCSEs, with different delivery and routes of assessment.
Summary
This indicator measures student performance at level 2 to assess educational
outcomes. However, on its own its scope may not allow for an accurate assessment of the contribution of the education system, and research has highlighted issues around evaluating outcomes for all learners. Areas for consideration could include:
The scope of the measure; for example the extent to which it is likely to assess the value the education system has added to student achievement;
The extent to which the measure for indicator 11 takes into account the range of learners within the system; and
The rationale for, and implications of, measuring outcomes only at level 2 (and not at other key stages or A level).
6
PfG indicator: reduce educational inequality
Figure 2: Indicator 12 on reducing educational inequality
In 2014/15, 41.3% of schools leavers with free school meal entitlement (FSME) achieved five GCSEs at grades A*-C including English and maths. There has been a year-on-year increase in the number of pupils with FSME achieving this threshold since 2008/09, from 29.7%.35
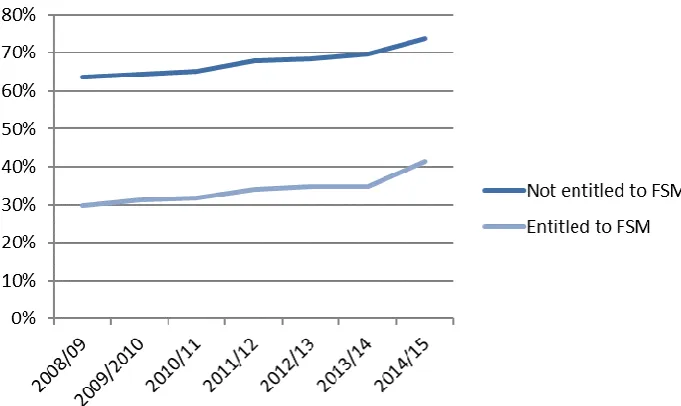
As Figure 3 below illustrates, the gap in attainment between those with FSME and those without over the past seven years has remained broadly consistent, amounting to around 33% each year, without any clear trend in terms of narrowing or widening the gap.36
Figure 3: Proportion of school leavers achieving at least five GCSEs at grades A*-C, including English and maths, by FSME
While there was a large increase between 2013/14 to 2014/15, when the proportion of students with FSME achieving this threshold measure increased from 34.9% to
35 Data provided by the Department of Education, February 2016 and Department of Education School Leavers [online]
Available at: https://www.education-ni.gov.uk/articles/school-leavers
36 Data provided by the Department of Education, February 2016 and Department of Education School Leavers [online]
[image:19.595.185.526.427.630.2]NIAR 209-16 Research Paper
Northern Ireland Assembly, Research and Information Service 20
41.3%,37 it is important to note that this coincided with an expansion of FSM eligibility
criteria (therefore increasing the number of children with FSME).38
The following paragraphs consider the educational inequality element of the measure. The potential issues this paper has highlighted in relation to indicator 11 also apply to indicator 12.
FSME as a proxy for deprivation
Socio-economic background is one of the main predictors of academic performance at school. Multiple studies over four decades have demonstrated that students from less well-off backgrounds are less likely to succeed at school.39
The Department uses FSME as a proxy measure for deprivation to allow analysis of outcomes for students from different socio-economic backgrounds. The evidence indicates that FSME is an imperfect measure of deprivation, with challenges including that:40
It measures only income;
It reflects registered, rather than actual eligibility (not all eligible parents apply for FSM);
The changing eligibility criteria may make comparisons over time difficult; and
Families close to, but outside, the eligibility threshold may face similar levels of disadvantage.
While FSME is thought to be the best proxy measure currently available,41 some
literature, including the 2013 Independent Review of the Common Funding Formula, recommends continuing to investigate possible alternatives.42
Other educational inequalities
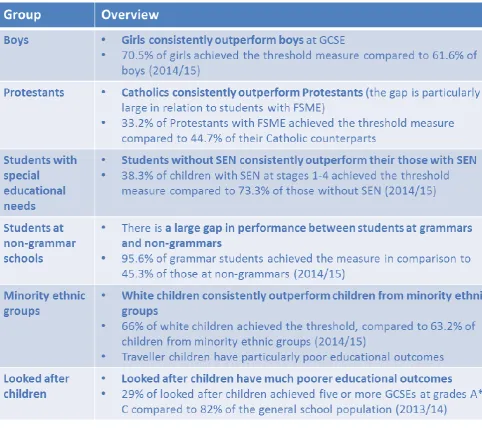
The evidence points to significant differences in educational outcomes for a range of other groups. Key groups are highlighted in Figure 4. The Department notes that it also collects data on sex, ethnicity, religion, FSM, SEN, pupil home postcode and school management types.
37 Department of Education School Leavers [online] Available at: https://www.education-ni.gov.uk/articles/school-leavers 38 In September 2014 FSM eligibility under the Working Tax Credit criterion was introduced at post-primary. The proportion of
pupils with FSME increased from 17.9% of school leavers to 23.7% of school leavers.
39 OECD (2011) Against the Odds: Disadvantaged Students Who Succeed in School Paris: OECD Publishing 40 Perry, C. (2010) Free School Meal Entitlement as a measure of deprivation Stormont: Northern Ireland Assembly
41 Gorard, S. (2012) “Who is eligible for free school meals? Characterising free school meals as a measure of disadvantage in
England” British Educational Research Journal Vol.38, No. 6, pp. 1003-1017
Figure 4: Groups with differing educational outcomes in Northern Ireland43
The Equality Commission reports that there are gaps in data in education in regard to a number of other equality grounds, including sexual orientation, gender identity, political opinion, marital status and dependency status. It highlights educational inequalities beyond attainment, including bullying of particular groups and entry to employment and higher education.44
Summary
This indicator aims to reduce educational inequality. However, the lead measure considers only inequality arising from socio-economic status, and uses the imperfect proxy measure of FSME to do so. It is unclear whether government will collect data on
43 Information provided by the Department of Education, February 2016, and Department of Education School Leavers [online]
Available at: https://www.education-ni.gov.uk/articles/school-leavers Taskforce on Traveller Education (2011) Report of the Taskforce to the Department of Education Bangor: DE and Department of Health, Social Services and Public Safety (2015) Children in Care in Northern Ireland 2013-14, Statistical Bulletin Belfast: DHSSPS
NIAR 209-16 Research Paper
Northern Ireland Assembly, Research and Information Service 22
other measures of inequality. Areas for consideration in relation to this indicator could include:
Whether the PfG will monitor educational inequality beyond socio-economic background;
The rationale for focusing on educational equality in terms of attainment, and not in regard to other factors, such as entry to higher education or employment and bullying;
The suitability of FSME as a proxy for deprivation, and whether the Department is considering alternative measures; and
How, if at all, the monitoring of data will control or allow for other factors, such as changing FSM eligibility criteria.
7
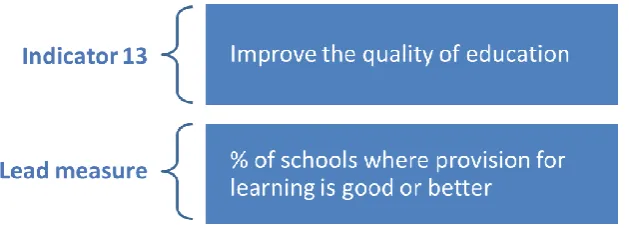
PfG indicator: improve the quality of education
[image:22.595.152.467.415.532.2]The framework document emphasises the importance of quality within an education system, and refers to the work of the Education and Training Inspectorate (ETI) on evaluating the quality of education in schools.
Figure 5: Indicator 13 on improving the quality of education
The framework document notes that the Department does not collate data in relation to this measure, stating that putting baselines in place and setting up regular monitoring arrangements will be part of the PfG agenda. It notes the publication of data in the biannual Chief Inspector’s Report.
Status of the ETI
The ETI is situated within the Department of Education. In some jurisdictions inspectorates are independent of the education ministry. The House of Commons Education Committee notes that Ofsted’s independence supports credibility.45 The
Committee for Education recommended in 2014 that the ETI should be statutorily independent from the Department. However, the Department responded that the ETI
carries out inspections independently and that it did not plan to change the governance arrangements.46
Frequency of inspection
The ETI employs a risk-based approach to the frequency of inspection, whereby schools are chosen for inspection based on school performance indicators, risk factors and District Inspector monitoring. This is a move away from the previous model of inspecting each school at least once every seven years.47
Lack of pupil or parent voice
As drafted, the measure does not include a discrete opportunity to assess the views of pupils and parents in regard to the quality of education (beyond involvement in
inspections). The OECD has recommended that the Department considers a consultation platform for parents.48
Challenges around value added
The OECD notes that although the ETI accounts for school context during inspection, a lack of common objective measures and variation in the availability of information present challenges for assessing value added. It suggests that it is not clear how inspectors account for school context in making judgements across schools and sectors.49
Comprehensiveness of the measure
There is clear evidence that classroom teaching has the greatest influence of in-school factors on children’s educational outcomes, with school leadership also playing a key role. Poor quality teaching has a significant impact on outcomes. For example, primary school children placed with low-performing teachers for several years suffer a largely irreversible educational loss.50 However, inspection evidence shows that:51
Just over a fifth (21%) of post-primary learning provision inspected in 2012-14 was deemed ‘satisfactory’; and
Leadership needed to improve in over a third (34%) of post-primaries inspected.
It is possible that inclusion of other inspection measures, such as the quality of
teaching and leadership, would give a broader picture of educational quality and areas
46 Department of Education letter to the Committee for Education, 4th November 2014 [online] Available at:
http://www.niassembly.gov.uk/assembly-business/committees/education/calls-for-evidence/inquiry-into-the-education-and-training-inspectorate-eti/
47 Shewbridge, C., Hulshof, M., Nusche, D., Stenius Staehr, L. (2014) OECD Reviews of Evaluation and Assessment in
Education: Northern Ireland OECD Publishing
48 Shewbridge, C., Hulshof, M., Nusche, D., Stenius Staehr, L. (2014) OECD Reviews of Evaluation and Assessment in
Education: Northern Ireland OECD Publishing
49 Shewbridge, C., Hulshof, M., Nusche, D., Stenius Staehr, L. (2014) OECD Reviews of Evaluation and Assessment in
Education: Northern Ireland OECD Publishing
NIAR 209-16 Research Paper
Northern Ireland Assembly, Research and Information Service 24
for improvement. It is also unclear whether the indicator’s measure will include education other than at school providers, as well as pre-school provision.
Summary
This indicator aims to improve education quality, with a lead measure based on inspection evidence on overall school performance. However, it may present challenges, and areas for consideration could include:
The implications of ETI’s status as part of the Department, for example in relation to impartiality or perceptions of impartiality;
The lack of parental and pupil voice in the measurement of education quality;
The implications of ETI’s risk-based approach to inspection on timescales for inspection and for robustness of measurement;
Whether measures on inspection evidence of individual aspects of the school, for example, teaching and leadership, will be included;
The extent to which the measure accurately reflects value added by schools; and
Whether pre-schools and Education other than at School providers will be included in the measure.
8
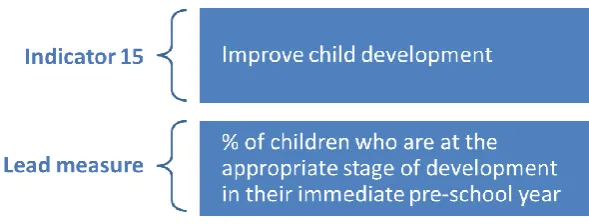
PfG indicator: improve child development
[image:24.595.167.462.545.657.2]The PfG highlights the importance of early intervention in improving children’s life chances, and in providing an opportunity to break inter-generational cycles of underachievement.
Figure 6: Indicator 15 on improving child development
3+ Review in DE-funded pre-school settings
The PfG notes that this data is not yet available, with no universal health check at age three. It states that health and pre-school practitioners are working through the
The 3+ Review will take place in DE-funded pre-school settings, with health visitors, education colleagues, children and parents working to promote child development. Assessment will involve the Ages and Stages Questionnaire: Social-Emotional: Second Edition (ASQ: SE2). The questionnaire considers the following domains:52
Self-regulation;
Compliance;
Social-communication;
Adaptive functioning;
Autonomy;
Affect; and
Interaction with people.
A pilot took place between April and June 2016 in 43 pre-school settings across
Northern Ireland, with evaluation underway. The Department expects the 3+ Review to be implemented between September 2016 and June 2017 in pre-school settings with DE-funded places, with remaining providers included between September 2017 and June 2018.53
It is important to note that pre-school is not compulsory, and not all children attend DE-funded pre-school settings; 92% of the eligible population, or 24,200, received a place in 2015/16.54
The role of pre-school in child development
Longitudinal research in Northern Ireland demonstrates that access to high quality pre-school provision improves attainment at the end of primary pre-school, but that low quality provision does not provide benefits.55 International research supports this, with
pre-school attendance correlated with performance at age 15.56
However, in the period 2012-14, almost a quarter (23%) of voluntary and private pre-school settings and 10% of statutory settings inspected in Northern Ireland were not evaluated as good or better.57
52 Information provided by the Department of Education, April 2016 53 Information provided by the Department of Education, April 2016
54 Department of Education (2016) Annual enrolments at schools and in funded pre-school education in Northern Ireland,
2015/16 Bangor: DE
55 Melhuish, E., Quinn, L., Sylva, K., Sammons, P., Siraj-Blatchford, Taggart, B. (2012) “Preschool affects longer term literacy
and numeracy: results from a general population longitudinal study in Northern Ireland” School Effectiveness and School Improvement pp. 1-17
56 OECD (2011) PISA in focus 2011: Does participation in pre-primary education translate into better learning outcomes at
school? Paris: OECD Publishing
NIAR 209-16 Research Paper
Northern Ireland Assembly, Research and Information Service 26
Summary
This indicator aims to improve child development, measured using a new assessment of children in DE funded pre-school provision. This presents a number of potential challenges. Areas for consideration could include:
The evaluation findings of the 3+ Review pilot and the implications for this indicator;
The implications of the lack of baseline data for measuring improvement over time;
How, if at all, the Department plans to ensure that children who do not attend DE-funded pre-school provision are included in the 3+ Review;
What actions the Department is taking to improve the availability and uptake of funded pre-school provision; and
Whether measures on the availability, quality and outcomes of pre-school education will be included.
9
PfG 2016-2021: other relevant indicators
The PfG includes a range of other indicators for which the Department does not have senior responsibility, but may contribute to in some way. This section considers a number of these indicators.
Improve support for looked after children
Looked after children are defined as those in the care of a Trust or who are provided with accommodation by a Trust.58
The framework document highlights the particular challenges looked after children face, suggesting that providing the best standards of support can help to improve their well-being. The Senior Responsible Officer for the indicator on looked after children is within the Department of Health, although the Department of Education will have a key role in this regard.
Figure 7: Indicator 10 on improving support for looked after children
Care Leavers data relates to looked after children who turned 19 during the year ending 31st March who had been looked after on 1st April three years previously.
Factors affecting outcomes for looked after children
In Northern Ireland educational outcomes for looked after children are significantly poorer than for those of other children, particularly at post-primary.59 Contributing
factors include:60
Placement changes and school changes (often linked);
Type of placement (those in foster or kinship care tend to perform better than those in residential care);
Length of placement (longer placements are associated with better outcomes; Absence from school;
Access to high quality teaching and tuition; and Social work support for birth families.
Care as a protective factor for educational outcomes
Research in England suggests that the correlation between being in care and poor educational outcomes reduces when other factors such as gender, ethnicity, SEN and circumstances prior to going into care are taken into account.61
This suggests that being looked after in itself may not be damaging to a child’s
education; rather, poorer educational outcomes arise from looked after children’s prior experiences and other factors.62 In fact, care can be a protective factor for education,
59 Department of Health, Social Services and Public Safety (2015) Children in Care in Northern Ireland 2013-14, Statistical
Bulletin Belfast: DHSSPS
60 Sebba, J., Berridge, D., Luke, N., Fletcher, J. et al. (2015) The Educational Progress of Looked After Children in England:
Linking Care and Educational Data Rees Centre for Research in Fostering and Education: University of Oxford
61 O’Higgins, A., Sebba, J., Luke, N. (2015) What is the relationship between being in care and the educational outcomes of
children? Rees Centre for Research in Fostering and Education: University of Oxford
62 O’Higgins, A., Sebba, J., Luke, N. (2015) What is the relationship between being in care and the educational outcomes of
NIAR 209-16 Research Paper
Northern Ireland Assembly, Research and Information Service 28
with children entering foster or kinship care at an earlier stage generally achieving better outcomes, possibly due to improvements in their learning environment.63
Value-added
Research highlights the complex challenges many looked after children face. It suggests that a focus on progress, rather than on outputs, is likely to provide a more realistic picture of the achievements of the care system.64
Summary
This indicator aims to improve support for looked after children, measuring the proportion of care leavers at 19 in education, training or employment. However, as drafted, the measure does not take account of the wide range of variables affecting outcomes for this cohort, or consider the value-added by the care system. Areas for consideration could include:
The quality of the data currently available on looked after children, including Department of Education data and the scope of Care Leavers data;
Whether the measure will take into account (control for) other variables, such as SEN, gender and ethnicity, in order to accurately assess the impact of care and the support provided;
Whether measures of value added will be included, and the current lack of baseline data to assess value added; and
Whether other measures will be included to assess educational factors and outcomes at earlier ages, for example: the proportion of looked after children with a pre-school place and personal education plan; outcomes at other key stages; and absences from school.
Improve the skills profile of the population
The Senior Responsible Officer for indicator 14, which relates to skills, is within the Department for the Economy. As the indicator refers to those qualified to Level 2, which refers to GCSEs at grades A*-C or equivalent, and those qualified to Level 3, which relates to A level or equivalent, the Department is likely to have an important role to play.
63 Sebba, J., Berridge, D., Luke, N., Fletcher, J. et al. (2015) The Educational Progress of Looked After Children in England:
Linking Care and Educational Data Rees Centre for Research in Fostering and Education: University of Oxford
64 Sebba, J., Berridge, D., Luke, N., Fletcher, J. et al. (2015) The Educational Progress of Looked After Children in England:
Figure 8: Indicator 14 on improving skills profile
The Department is likely to play a role in contributing to a range of other PfG economic indicators, for example:
16: Increase the proportion of people in work;
17: Reduce economic inactivity;
18: Increase the proportion of people working in good jobs; and
22: Increase innovation in our economy.
In relation to these indicators, areas for consideration could include:
What, if any, role the Department of Education will play in supporting these indicators; and
Whether there will be measures to take account of the science, technology engineering and maths (STEM) ‘artery’ or pipeline in schools.
Respect and reconciliation indicators
It is possible that the Department may contribute to a number of indicators held by the Executive Office:
26: Increase respect for each other;
31: Increase shared space (although the draft indicator refers only to leisure centres, parks, libraries and shopping centres); and
35: Increase reconciliation.
Areas for consideration could include:
What, if any, role the Department of Education will play in supporting these indicators (for example, in relation to shared and integrated education); and Whether there is scope for measures to consider bullying in schools, particularly
NIAR 209-16 Research Paper
Northern Ireland Assembly, Research and Information Service 30
Justice indicators
As educational provision for young people in custody is due to transfer from the Department of Justice to the Education Authority, it is possible that the Department of Education will contribute to the following justice indicators: 65
38: Increase the effectiveness of the justice system (although the current lead indicator refers to processing criminal cases within guideline time limits and not to other outcomes); and
39: Reduce reoffending.
Areas for consideration could include:
What, if any, role the Department of Education will play in supporting these indicators; and
What actions the Department is undertaking in regard to educational provision for young people in custody.
Quality of life for people with disabilities
Indicator 42, with senior responsibility held by the Department for Communities, refers to increasing quality of life for people with disabilities, based on a measure of life satisfaction (such data is not currently collected).
Areas for consideration could include:
Whether this indicator will consider measures in regard to young people with SEN, including their levels of satisfaction with education;
Whether it will take into account issues such as timely access to assessment and support for SEN, as well as wider issues such as participation in
educational decision-making; and
Whether indicators will be included on implementation of the Children’s
Services Co-operation Act (Northern Ireland) 2016 and the Special Educational Needs and Disability Act (Northern Ireland) 2016.
10 Conclusion
This research paper has found that the Department achieved a number of its
commitments in the previous PfG, but failed to meet others. In addition, some of the targets were not directly measurable, preventing an accurate assessment of its achievements.
The Department will contribute to a number of outcomes in the new PfG 2016-21. It is possible that the new outcomes-based approach may have implications for
transparency and accountability.
There are a number of potential issues with many of the measures associated with the PfG indicators. Some of these relate to an inability to measure the value government has added, as opposed to change that may have happened anyway or as a result of other factors. Other issues relate to the limited scope of many of the measures, as drafted, and their robustness. Further areas for consideration could include:
The failure to meet the previous PfG target on disadvantaged learners achieving the GCSE threshold measure, and how the Department plans to meet the Count Read: Succeed target of 65% of FSME pupils achieving the measure by 2019/20;
The value added by the Signature Programme on literacy and numeracy;
The effectiveness of the Department’s actions on shared education;
The availability and quality of pre-school education across Northern Ireland;
The robustness of the data collected for the PfG, for example, in relation to schools sharing facilities and the lack of baseline data for some indicators; The implications of the outcomes-based approach in the draft PfG, including
the lack of defined outcomes, for accountability and transparency; and Indicators that have not been included, for example, in relation to