University of Southern Queensland
Faculty of Health, Engineering and Sciences
Depth of Anaesthesia Assessment and Higher
Brain Function Modelling for Consciousness
A thesis submitted by
Richard George Landers
in fulfilment of the requirements of
Doctor of Philosophy
Copyright
by
Richard George Landers
Abstract
Anaesthesia is the corner stone of modern surgical medicine. Despite a long pe-riod of enquire beginning with Snow (1847) anaesthesia remains a field in which there are more questions than answers. This thesis reports findings on three different aspects of anaesthesia.
1. Initially, a method for calculating a population pharmacokinetic model for propofol infusion is described. This method greatly reduced the time required to calculate the model (0.1 seconds per iteration) compared to the NONMEM method (hours per iteration (Minto, Schnider, Egan, Youngs, Lemmens, Gam-bus, Billard, Hoke, Moore, Hermann, Muir, Mandema & Shafer 1997)). The resultant model achieved improved fit to the data than the model of Sch¨uttler & Ihmsen (2000b) achieving a mean squared error of 0.2835 compared to 0.6413 respectively.
2. Second, a neural network (NN) method is presented to assess Depth of Anaes-thesia from long segments of raw EEG. The proposed method was able to ap-proximate the output from a BIS XP monitor for the training data. The linear regression, between the NN and the BIS monitor, resulted in an R value of 0.99963. The network was able to approximate the BIS monitor output for new (unseen) data.
3. Finally, a lumped parameter neural mass, anaesthesia, model is presented. This model is capable of generating changes in EEG associated with increas-ing doses of γ-aminobutyric acid type A (GABAA) hypnotic agent (propofol).
This model was not a fitting exercise rather it was constructed based on known brain physiology, and the changes to α1 GABAA receptors conductance caused
by propofol. Encompassing the regional interactions, that are thought to be, altered by GABA hypnotic agents.
The model is capable of producing five distinct EEG patterns (β,α,θ,δ and iso-electric) in response to different levels of hypnotic agent. The model is reactive capable of switching from α to β band EEG when the eyes open. Anaesthetic supresses the models transition to a higher state EEG.
The model suggest that the effect site for propofol as α1 GABAA receptors of
Certification of Dissertation
I certify that the ideas, designs and experimental work, results, analyses and conclusions set out in this dissertation are entirely my own effort, except where otherwise indicated and acknowledged.
I further certify that the work is original and has not been previously submitted for assessment in any other course or institution, except where specifically stated.
Richard George Landers
D1113507
Signature of Candidate
Date
ENDORSEMENT
Signature of Supervisor/s
Acknowledgments
During the progress of this program there have been a number of people whose assistance I would like to acknowledge.
My supervisor, Dr Peng Wen, for giving me the opportunity to undertake this journey and pushing this research to places I though impossible. Dr Andrew Wandel, Dr Selvan Panther and, Dean Beliveau, for giving me the opportunity to work for them. Dr Andrew Maxwell, for his effort in making this disserta-tion readable. My colleagues Dr Shahaba Abdulla, Dr Syed Salman Shahid, and Mario Palendeng for the countless discussions. Finally my wife, Barbara Spadaro, for tolerating this adventure.
Richard George Landers
Contents
Abstract i
Acknowledgments iii
List of Figures ix
List of Tables xviii
Notation xx
Acronyms & Abbreviations xxii Chapter 1 Introduction 1
1.1 Overview of the Dissertation . . . 3
Chapter 2 Understanding anaesthesia; system wide effects 5 2.1 Introduction . . . 5
2.2 Defining anaesthesia . . . 6
2.2.1 Immobility, muscle relation . . . 7
CONTENTS v
2.3 Clinical practice . . . 9
2.4 Assessing anaesthesia . . . 11
2.4.1 Stimulate and Observation. . . 12
2.4.2 Measurement and correlation . . . 13
2.5 Drugs . . . 18
2.6 Pharmacodynamic . . . 20
2.7 Measuring drug concentration . . . 20
2.8 Pharmacokinetics . . . 22
Chapter 3 Population pharmacokinetic modelling 23 3.1 Introduction . . . 23
3.1.1 Compartment models . . . 23
3.1.2 Physiologically based models . . . 25
3.1.3 Modeling methods . . . 25
3.1.4 Data . . . 30
3.1.5 Modelling . . . 30
3.2 Population model . . . 30
3.2.1 Covariates . . . 32
3.2.2 Mapping . . . 33
3.3 Results . . . 34
3.3.1 Three compartment ANN PK model . . . 34
3.3.2 Evaluation of ARMAX ANN PK model . . . 34
vi CONTENTS
3.5 Summary . . . 43
Chapter 4 Depth of anaesthesia from raw EEG 45 4.1 Introduction . . . 45
4.1.1 Depth of anaesthesia (DoA) monitoring. . . 45
4.1.2 Artificial neural networks . . . 49
4.1.3 Data . . . 49
4.1.4 Features . . . 55
4.2 Method . . . 58
4.3 Results . . . 59
4.4 Discussion . . . 62
4.5 Summary . . . 69
Chapter 5 Subsystem effects and analysis of anaesthesia 71 5.1 Introduction . . . 71
5.2 Mechanisms of anaesthesia action . . . 72
5.2.1 Neurons and synapses . . . 72
5.2.2 Brain circuits and altered functionality . . . 75
5.2.3 Regional effects of anaesthesia . . . 77
5.2.4 Anaesthesia effect site . . . 79
5.3 Anaesthetic drug effect . . . 83
5.3.1 Hypnotic effect . . . 84
CONTENTS vii Chapter 6 Brain and neuron modelling 87
6.1 Introduction . . . 87
6.2 Neuron models . . . 87
6.3 Mean field neural mass models . . . 89
6.4 Lumped parameter neural mass models . . . 90
6.5 Summary . . . 92
Chapter 7 Anaesthesia brain model and implementation for EEG 93 7.1 Introduction . . . 93
7.2 Base model . . . 93
7.2.1 Synaptic response . . . 98
7.2.2 Action hillock response . . . 98
7.3 Implementation . . . 100
7.4 Modifying base model for Anaesthesia . . . 101
7.4.1 Unconsciousness . . . 102
7.4.2 Stimuli . . . 103
7.5 Summary . . . 104
Chapter 8 Brain model assessment 105 8.1 Introduction . . . 105
8.2 Methodology for assessment . . . 105
8.2.1 Hypnotic effect . . . 106
viii CONTENTS
8.2.3 Model searching . . . 109
8.3 Discussion . . . 113
8.4 Summary . . . 120
Chapter 9 Conclusion 121 9.1 Population pharmacokinetics model . . . 121
9.2 DoA . . . 122
9.3 Brain model . . . 123
9.4 Future work . . . 124
9.5 Summary . . . 125
References 127 Appendix A PK modeling results 143 A.1 Three compartment model results . . . 143
Appendix B Brain Model 153 B.1 Brain regions . . . 153
B.2 Cortex . . . 155
List of Figures
2.1 Movement response curves for Alfentanil to different stimuli (adapted from Gelb, Leslie, Stanski & Shafer 2009). . . 8
2.2 Hierarchical model of the interaction between pain and anaesthetic agents to achieve unconsciousness ( adapted from Gelb et al. 2009). Anaesthesia is the blancing of the drug effects aganst the stimuli of the operation. Anaesthetic agents act across the entire neverous system. . . 10
2.3 Probability of movement as a function of BIS at different sites. Site 5 had no movements, (adapted from Bowdle 2006). . . 15
2.4 Population distributions for two anaesthetic regiments. Both regi-ments require a blood plasma concentration of propofol of 4µg/ml. The second regiment a co-administration of remifentanil of 4ng/ml. Part a shows the estimate of BIS value while b shows the estimate of the probability of conciseness returing after incision. . . 16
2.5 Time line showing the devlopment of anaesthetic agents (adapted from Bowdle 2006). . . 19
2.6 Probability of response vs alfentanil conc. (adapted from Gelb et al. 2009). Logistic regression of the data upper part of fig A population curves. Fig B individual curves for incision . . . 21
x LIST OF FIGURES
3.2 Three compartment PK model. The flow of drug into the model is represented as the function I(t) representing the time course of the infusion. The flow of the agent between the compartments by the four rate constants. The agent is cleared from the central compartment according to k10. . . 25
3.3 Upton drug distribution model (adapted from Upton & Ludbrook 2005). . . 26
3.4 Comparison of three current population PK models to the mea-sured blood concentration, during and following, infusion of propo-fol. The difference between a estimate of propofol concentration and the measured concentration can be large. . . 28
3.5 Histrgram of blood concertration for 1000 male patients (43 yrs., 1.84 m, and 72 Kg.). Infused with 5mg/Kg/hr of propofol. Each patient model is ramdomly drawn from the prameter populations of the Sch¨uttler & Ihmsen (2000b) model. . . 29
3.6 Gepts et al. (1987) data. Measured blood concentration (propo-fol) for each patient as a function of time. The time scale of the x axis is in minutes while the drug concentration is in mg/ml . . 31
3.7 Scatter plots population three compartment model estimates and the measured propofol blood concentration of each patient (circles). The dotted line is y = x and the solid line is the line of best fit, linear regression, between the model and the patient the r value along with the patient No. can be found in the title of each plot. . . 35
3.8 Liner regression between the measures blood concentrations and the population three compartment model estimates. . . 36
3.9 Scatter plots of population five compartment model estimates and the measured blood propofol concentration of each patient (circles). The dotted line is y = x and the solid line is the line of best fit, linear regression, between the model and the patient the r value along with the patient No. can be found in the title of each plot. . . 38
LIST OF FIGURES xi
3.11 Liner regression between the measures blood concentrations and Schubert, Simanski, Janda, Hofmockel & Lampe model estimates. 41
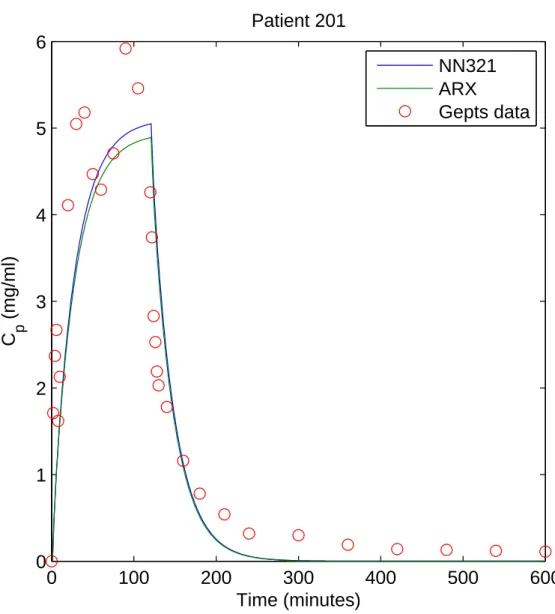
3.12 Comparasion between NN population PK model, individual AR model and data for patient 201. . . 42
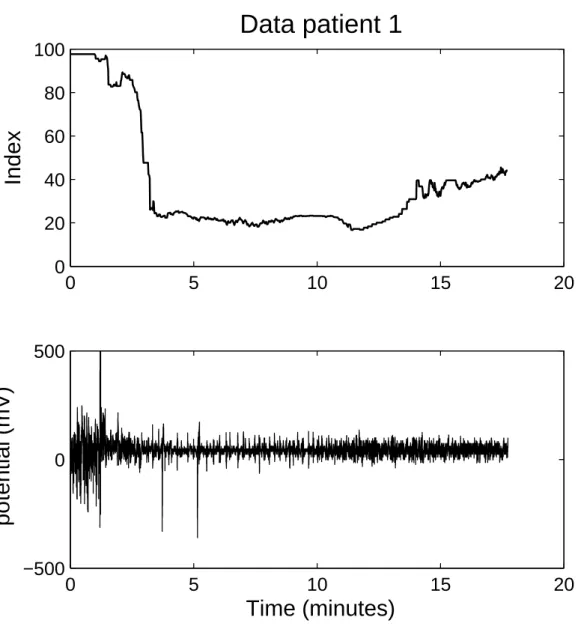
4.1 Data for patient one. The upper figure show the BIS index. The lower figure contain the raw EEG. . . 50
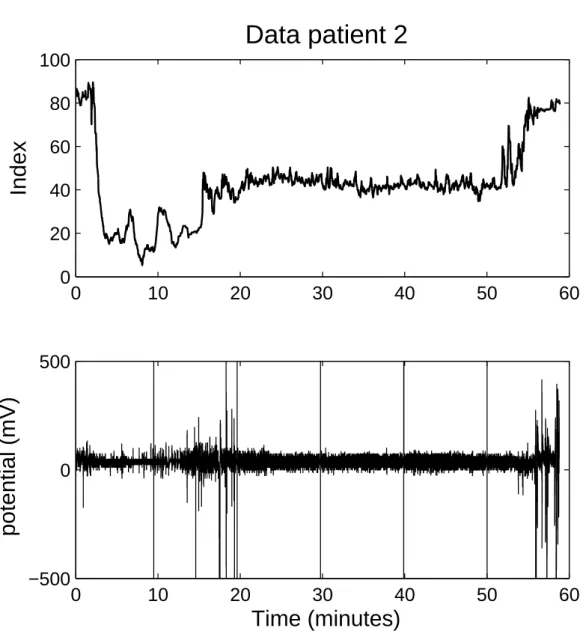
4.2 Data for patient two. The upper figure show the BIS index. The lower figure contain the raw EEG. . . 51
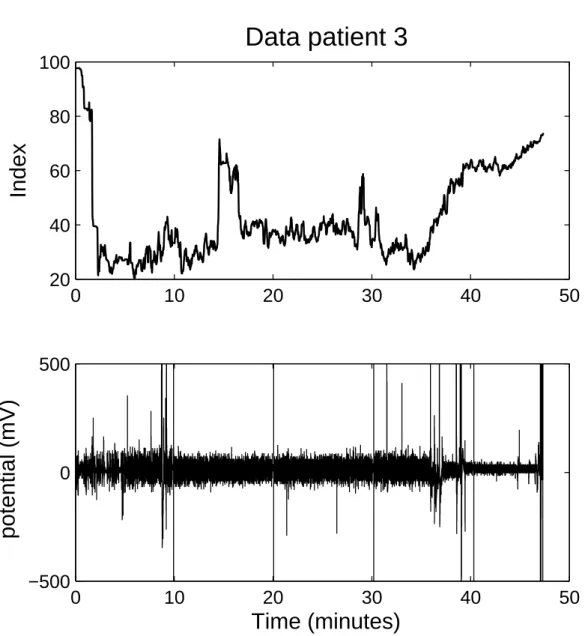
4.3 Data for patient three. The upper figure show the BIS index. The lower figure contain the raw EEG. . . 52
4.4 Data for patient four. The upper figure show the BIS index. The lower figure contain the raw EEG. . . 53
4.5 Data for patient five. The upper figure show the BIS index. The lower figure contain the raw EEG. . . 54
4.6 Akaike information criterion calculated for AR model orders from 4 to 24. The figure shows comparisons for epochs across the range BIS index. . . 57
4.7 Effect of segment length on the fit of the network to the BIS monitor. Increasing the segment length improves the ability of the method to reproduce the DoA estimate from the BIS monitor. 60
4.8 ANN trained with 23 features using de-trended EEG segments, of 64 seconds length, was able to learn the relationship between the first 23 features and the BIS XPTM monitor. . . . . 61
4.9 DoA estimate from ANN, trained with all 28 features using raw
data segments of 64 seconds length, and the output of the BIS XPTM mon-itor. The upper part shows the output of the ANN for the new
xii LIST OF FIGURES
4.10 Output of ANN 1 for patient one. AAN1 was trained with all 28 exemplars extracted from 64 second segments of raw EEG from the other four patients. The network estimates the patients state changed at 40 seconds followed by a brief spike at 90. A similar spike occurs at the two minute mark. The BIS monitor is known to lag the state of the patient. The network index drops rapidly after the propofol bolus. It is common for the anaesthetic agent to be stopped prior to the end of the procedure, so that the patient regains consciousness quickly at the end of the procedure. The ANN estimated Index may reflect this occurrence at around 13 minutes. . . 66
4.11 Output of ANN 2 for patient one. AAN2 was trained with the first 21 exemplars extracted from 64 second segments of raw data from the other four patients. This index classifies the EEG similarly to the BIS XPTM the index drops quickly following the induction unlike the BIS monitor. There is a peak at the insertion of the LMA. This index shows the patient as awake at the end of the procedure unlike the BIS monitor. . . 67
4.12 Output of ANN 3 for patient one. AAN 3 was trained with the first 23 exemplars extracted from 64 second segments of raw EEG from the other four patients. This index falls after the administration of each agent. The DoA produced increases after each agent. This index appears to respond to stimuli. This index like the first trends down at the end of the procedure this does not demonstrate a return to consciousness. . . 68
LIST OF FIGURES xiii
5.2 Structure of the cortex. The blue shading represents the six lay-ers of the cortex. The central orange axon is a projection from a thalamic relay neuron, bringing sensory information into the cor-tex. Both the spiny stellate and pyramidal cell have excitatory synapses. The other neurons of the cortex produce inhibition. The axons of the pyramidal cell project down into the mid brain (sourced from public domain 2013). . . 76
5.3 Changes in brain conductance during induction with propofol (adapted from Pollard, Pomfrett, Bryan, Quraishe, Davidson & McCann 2011). . . 78
5.4 Brain regions and connections thought to mediate consciousness during propofol anaesthesia. Propofol is thought to potentate the GABAA receptors of interneurons in the cortex (adapted from
Brown, Lydic & Schiff 2010). . . 79
5.5 The effects of a number of anaesthetic agents across a range of anaesthetic targets. All eight agents result in unconsciousness (sourced from Alkire, Hudetz & Tononi 2008). . . 81
5.6 Propofol potienates GABA induced currents (adapted from Krasowski, O’Shea, Rick, Whiting, Hadingham, Czajkowski & Harrison 1997).
. . . 82
5.7 Changes in action potential rate. Upper pane is the control result for awake un-restrained rat. The lower section shows the results for anaesthetized rats. The bars above each figure indicate the iontophoretic current (sourced from Windels & Kiyatkin 2004). Anaesthesia causes a change in the distribution of the firing rate, with both a reduction in the mean and standard deviation. The anaesthetic produces a marked increase in the inhibition of the neural activity. The * represents p <0.05 students t test. . . 84
7.1 Block diagram showing the top level of the base model. The EEG is the only output of the base model. . . 95
xiv LIST OF FIGURES
7.3 Block diagram showing the connections of the neuronal masses in the thalamus. . . 96
7.4 Block diagram showing the connections of the neuronal masses in the cortex. . . 97
7.5 Block diagram showing the interneuron population . . . 98
7.6 Average response of each synapse type to an action potential. . . 99
7.7 The response of the action hillock to a range of membrane poten-tials for three different membrane resting potenpoten-tials. . . 100
7.8 Effect of transmitter concentration on the decay of PSC. . . 103
8.1 Examples of the EEG of each band. . . 106
8.2 EEG from base model with hypnotic agent potentiating the GABA synapses of slow interneurons in the cortex. The drug effect in-creases after each ten seconds. The amplitude if the EEG clearly increased as the drug effect increases from left to right. In the last 10 seconds (t = 70 to 80) however the model produces very low amplitude EEG. . . 108
8.3 A typical power spectral density estimate for the EEG from a good model. The model shows a clear transition betweenα and β
generation with the change in the stimuli. In the upper pain the PSD is clearly in the αrange. Opening the eyes causes the model to produce EEG in the β range. . . 110
8.4 Changes in power spectral density due to increasing drug effect. . 111
LIST OF FIGURES xv
8.6 Temporal changes in neuronal activity across model 55 without anaesthesia. The main figure shows the time course of the average neuronal activity in each population of the model. The lower left figure is five seconds from the EEG generated by the model to the right is the power spectral density estimate for the generated EEG.114
8.7 Temporal changes in neuronal activity across model 55 with a low drug effect. . . 115
8.8 Temporal changes in neuronal activity across model 55 with a moderate drug effect. . . 116
8.9 Temporal changes in neuronal activity across model 55 with a high drug effect. . . 117
8.10 Changes in neuronal activity across the model populations due to a high level of drug. The high potentiation of the sIN neurons cause all the neuron populations of the cortex to hyperpolarize. The resultant EEG has a very low amplitude less than 1 mV the neurons of the thalamus show some activity due to the afferent stimuli. . . 118
8.11 Temporal changes in neuronal activity across model 55 popula-tions in an un-anaesthetized brain with the eyes open. . . 119
A.1 Comparasion between NN population PK model, individual AR model and data for patient 201. . . 143
A.2 Comparasion between NN population PK model, individual AR model and data for patient 202. . . 144
A.3 Comparasion between NN population PK model, individual AR model and data for patient 203. . . 144
A.4 Comparasion between NN population PK model, individual AR model and data for patient 204. . . 145
A.5 Comparasion between NN population PK model, individual AR model and data for patient 206. . . 145
xvi LIST OF FIGURES
A.7 Comparasion between NN population PK model, individual AR model and data for patient 208. . . 146
A.8 Comparasion between NN population PK model, individual AR model and data for patient 209. . . 147
A.9 Comparasion between NN population PK model, individual AR model and data for patient 210. . . 147
A.10 Comparasion between NN population PK model, individual AR model and data for patient 211. . . 148
A.11 Comparasion between NN population PK model, individual AR model and data for patient 212. . . 148
A.12 Comparasion between NN population PK model, individual AR model and data for patient 213. . . 149
A.13 Comparasion between NN population PK model, individual AR model and data for patient 214. . . 149
A.14 Comparasion between NN population PK model, individual AR model and data for patient 215. . . 150
A.15 Comparasion between NN population PK model, individual AR model and data for patient 217. . . 150
A.16 Comparasion between NN population PK model, individual AR model and data for patient 219. . . 151
B.1 Block digram of the brain model. At this level the model consits of four functional regions: afferent pain; thalamus; cortex and; afferent cortex. . . 153
B.2 Block digram of the afferent pain to the thalamus. . . 154
B.3 Block digram of the afferent cortex. This block represent afferents from negibouring cortex regions. . . 154
LIST OF FIGURES xvii
B.5 Block digram of the pyramidal cells, cortex. . . 156
B.6 Block digram of the slow internurons, cortex. . . 156
B.7 Block digram of the fast internurons, cortex. . . 157
B.8 Block digram of the excitatory internurons, cortex. . . 157
B.9 Block digram of the brain model, thalamus. The thalaus consists of three neuron populations; internurons; thalamic relay cells and; thalamic reciticular formation cells. . . 158
B.10 Block digram of the internurons, thalamus. . . 159
B.11 Block digram of the thalamic relay cells, thalamus. . . 159
List of Tables
2.1 Standard anaesthetic monitors . . . 11
2.2 Standard anaesthetic stimuli and the responses used to assess anaesthesia (adapted from Gelb et al. 2009). . . 12
2.3 OAAS scale (adapted from Jensen, Litvan, Struys & Vazquez 2004). 13 2.4 Curentaly avaiable DoA monitoring methods (adapted from Gover & Bharti 2008). . . 14
2.5 BIS Guided Hypnosis and Anaesthetic Management (adapted from Kelley 2007) . . . 17
2.6 Median effective dose of thiopental, diazepam, isoflurane, and morphine for different endpoints of anaesthesia in rats. . . 19
3.1 Four methods that produce high levels of fit (%) for the blood concentration data of each patient. . . 32
3.2 Performance of the individual ARX models. . . 34
3.3 Performance of the individual ARMAX models. . . 37
3.4 MSE compaired . . . 40
4.1 Patient Details . . . 49
LIST OF TABLES xix
4.3 Performance of ANN trained with different feature sets extracted from raw EEG estimation of the BIX monitor Index for the EEG. The correlation was calculated with linear regression. . . 62
5.1 Brain receptors of the two main superfamilys (adapted from Campagna, Miller & Forman 2003). . . 74
5.2 Brain regions with altered functional connectivity during mild propofol sedation (apapted from Gili, Saxena, Diukova, Murphy, Hall & Wise 2013). . . 77
5.3 Distribution of major GABAA receptors subtypes in the rat brain
(adapted from McKernan & Whiting 1996). . . 83
7.1 Brain model prameters . . . 101
7.2 Afferent stimuli leves for the base model. . . 104
8.1 Synapse combinations that produce EEG similar to that presented in Figure 8.2 . . . 107
8.2 Values across which the model was simulated to find sub set of models that switch output due to a change in stimuli. . . 109
Notation
Pharmacokinetic modelling
A Initial concentration compartment A
B Initial concentration compartment B
C Initial concentration compartment C
C1(t) Concentration compartment one over time t
C2(t) Concentration compartment two over time t
C3(t) Concentration compartment three over time t
Cp(t) Plasma concentration over time t
C(s) Concentration function Laplace domain
I(t) Infusion over time t
I(s) Infusion function Laplace domain
V1 Volume of the central compartment
k10 Clearance rate constant compartment one
k12 Rate constant compartment one to two
k13 Rate constant compartment one to three
k21 Rate constant compartment two to one
k31 Rate constant compartment three to one
α Decay constant compartment A
β Decay constant compartment B
γ Decay constant compartment C
DoA estimation
ak Coefficient of kth output
p Model order
Pi Power of ith frequency
P Total power of signal
SE Spectral entropy
xn Zero mean white noise input
yn Current output
yn−k kth past output
Notation xxi
Brain modelling
Ii Current ith ion channel
Vi Reversal potentialith ion channel
Vm Membrane potential
Vm(t) Membrane potential as a function of time t
gi Conductance per unit area ith ion channel
Im Membrane current per unit area
Cm Membrane capacitance per unit area
m Activation gating variable
h Inactivation gating variable
gi Maximal valueith conductance
α Activation constant
β Inactivation constant
u(x, t) Neural field representing the local activity of a popula-tion of neurons at posipopula-tion xand time t
w(y) Strength of connections between neurons separated by a distance y
Φ Temporal decay rate of synapse
u(x−y, t−|yv|) Axonal conduction delay arising from the finite speed of signals travelling over a distance y
P(t) Average pulse density of action potentials
A Maximum amplitude of the PSP
a Reciprocal, lumped representation, passive membrane and all other spatially distributed delays in the dendritic network
t Time
Vn(t) Single neuron membrane potentia
Ci Synaptic connectivity constant
pi(t) Unit impulse function
hi(t) Synaptic response
Vm(t) Membrane potential neural mass
P(t) Average pulse density of action potentials 2e0 Maxium firing rate neuronal population
S0 Resting membrane potential
Acronyms & Abbreviations
AAI A-Line autoregressive index AEP Auditory Evoked potentials AIC Akaike information criteria ANN Artificial neural network ANS Autonomic nervous system AP Action potential
AR Autoregressive
ARMA Autoregressive moving average Ac Afferent cortex
Ap Afferent pain BIS Bispectral Index
CNS Central nervous system CS Cerebral State index Ce Concentration effect Site
DoA Depth of Anaesthesia ECG Electrocardiogram EEG Electroencephalograph EMG Electromyogram EOG Electrooculogram eIN Excitatory interneurons
ePSP Excitatory post synaptic potential FFT Fast fourier transform
fEITER Functional electrical impedance tomography by evoked response fIN Fast interneurons
fMRI Functional magnetic resonance imaging GABA γ-aminobutyric acid
GABAA γ-aminobutyric acid type A
HR Heart rate
HRV Heart rate variability IN Interneurons, thalamus IoC Index of Consciousness
Acronyms & Abbreviations xxiii
iPSP Inhibitory post synaptic potential LGIC Ligand gated ion channels
LMA Laryngeal mask airway
MAC Minimum alveolar concentration MAP Mean arterial pressure
MSE Mean squared error
NONMEM Non-linear mix effect models NMB Neuromuscular block
NMDA N-Methyl-D-aspartic acid NLTEO Nonlinear total energy operator NN Neural network
NO2 Nitrogen dioxide NT Neural transmitter
nACHr Nicotinic acetylcholine receptor
OAAS Observers Assessment of Alertness and Sedation PD Pharmacodynamics
PK Pharmacokinetics
PNS Peripheral nervous systems PPG Photoplethysmography PSA Patient State Analyser PSC Post synaptic current PSD Power spectral density PSP Post synaptic potential PY Pyramidal cells
qEEG Qualitative EEG RTN Reticular nucleus SE Spectral entropy SnS Shaking and shouting
SWT Stationary wavelet transform sIN Slow interneurons
TEO Total energy operator TRC Thalamic relay cells
TRF Thalamic reticular formation VB Ventrobasal nucleus
Chapter 1
Introduction
Anaesthesia is an important process in modern medicine, which allows modern surgical practices. Anaesthesia modifies the body’s responses to stimuli, resulting from a medical procedure, so that the procedure may proceed. A series of the bodies control systems are altered with a range of relative toxic compounds. The essential features of a general anaesthesia are a reversible loss of consciousness with a lack of movement, a lack of awareness, unresponsiveness to painful stimuli and a lack of recall of the surgical intervention. Inappropriate general anaesthesia may lead to intraoperative awareness with recall (due to patient under dosage) or prolonged recovery and increased risk of postoperative complications (due to over dosage).
We assume that anaesthesia, as a critical part of modern medicine, is a well understood. As an anaesthesia patient we take comfort in the fact that the procedure will be meticulously planned and the drug regiment tailored to our personal needs, assured that very few persons are harmed directly by the anaes-thetic. In reality anaesthesia is more art than science.
Anaesthesia disrupts or modifies the functioning of the nervous system. This is not a single system; it is divided into a series of sub systems that control portions of the body. The areas that are targets of the anaesthetic are dependent upon the patient and the procedure performed. For most surgical procurers relaxation of the muscle is required to allow the progress of surgery. Other goals are absence of memory, unconsciousness, and removal of pain.
2 Introduction
concentration required is well defined, calculation of the dose contains significant error (Dhillon & Gill 2009, Schnider, Minto, Gambus, Andresen, Goodale, Shafer & Youngs 1998). An average dose has the potential to kill some while it will have no effect on others; variation within the population is large. Improvement in population PK modelling represents a clear opportunity to improve anaesthetic practice.
Patients undergoing general anaesthesia for operations always have their vital signs and other markers checked throughout the operation (Eskaros, Papadakos & Lachmann 2009, Schroeder, Barbeito, Bar-Yosef & Mark 2009, Sessler 2009, Viby-Mogensen 2009) to ensure; firstly, that the patient survives the intoxica-tion. Then detect deviations in normal body function as early as possible in order that counter measures may be taken when necessary (Gelb et al. 2009). Secondly, amongst other things if the patient is sufficiently unconscious. Estima-tion of the anaesthetic effect is a considerable challenge for those who administer anaesthesia. Assessment of anaesthetic state relies on the subjective assessment of a range of factors that could be influenced by the anaesthetic (Urban 2002). This subjective process is a complex task prone to error (Rall et al. 2009). De-spite a range of DoA monitors subjective assessment still represents the gold standard in patient care.
Monitoring of this ill-defined phenomenon is a complex challenge. Current moni-tors rely on processed EEG to estimate Depth of Anaesthesia (DoA). EEG based monitors have yet to prove their benefit (Bleijenberg, van Oostrom, Akkerdaas, Doornenbal & Hellebrekers 2011, Jensen, Callesen, Hagemo, Hreinsson, Lund & Nordmark 2010, Kaskinoro, Maksimow, L˜angsj¨o, Aantaa, J¨a¨askel¨ainen, Kaisti, S¨arkel¨a & Scheinin 2011, Leslie 2007). Anaesthesia agents alter function of a host of bodily functions other than EEG. These changes are relied on during the subjective assessment. This visual information is present in the changing potential of the patients skin. Current EEG DoA methods rely on the re-moval of this noise (Schachinger, Schindler & Kluge 2007, Nguyen-Ky, Wen & Li 2009a, Rampil 1998, Zikov, Bibian, Dumont, Huzmezan & Ries 2006) for their estimation process. An important contributing factor in inadequate anaesthesia is the current limited ability to assess the level of consciousness. Information, which is routinely removed, has the potential to improve estimation of DoA. Improved estimation holds out the promise of closed loop control of anaesthetic delivery.
1.1 Overview of the Dissertation 3
A grey box model was developed to produce the typical changes in EEG, fre-quency and amplitude, expected from increasing levels of hypnotic anaesthetic. The model is capable of producing changes in EEG in response to increased stimuli. Anaesthetic supress the models response to stimuli requiring increased stimuli to produce a transition in the EEG. Brain modelling in the study of anaesthesia is a recent development (Steyn-Ross, Steyn-Ross, Sleigh & Wilcocks 2001) there are not many existing models in my understanding (Liley, Foster & Bojak 2011, Molaee-Ardekani, Shamsollahi & Senhadji 2011).
1.1
Overview of the Dissertation
This dissertation is presented in two parts, 1. The first part of this dissertation focuses on controlling anaesthesia automatically providing methods for measure-ment of DoA, and modelling of population pharmacokinetics for propofol infu-sion. 2. The second part focuses on a brain model for anaesthesia.
Chapter 2 provides background on anaesthesia.
Chapter 3 discusses the development of a population pharmacokinetic model for propofol infusion.
Chapter 4 investigates techniques to estimate DoA from raw potential of the human forehead.
Chapter 5 introduces understanding of anaesthetic induced changes in brain function as the basis for the development of an anaesthesia brain model.
Chapter 6 introduces brain modelling methods.
Chapter 7 describes the base model and the modifications required to pro-duce a brain model capable of generating changes in electroencephalograph (EEG) caused by stimuli and γ-aminobutyric acid type A (GABAA)
hyp-notic agents (propofol).
Chapter 8 reports the model testing results and discussion of their significance.
Chapter 2
Understanding anaesthesia;
system wide effects
2.1
Introduction
Anaesthesia evolved from recreational drug use of the 1840s, (Rushman, Davies & Atkinson 1996) and from this dubious beginning it has become the cornerstone of modern medicine. Despite the primacy of anaesthesia in the practice of surgical medicine, the administration of anaesthesia is still an art. The anaesthetic state consists of suppression of responses from the nervous system to the stimuli of the medical procedure. Several complex physiological mechanisms are modified by chemical agents. Although there is understanding regarding the effects the drugs have across a range of sub cellar targets, this has not however enhanced understanding of the anaesthetic state. Understanding of anaesthesia is in part theoretical, as some of the effects are not defined in real terms.
The purpose of anaesthesia is to control or modify responses from the bodies con-trol systems to optimise the outcome of the patient for a medical procedure. The systems that regulate biological function have complex interactions. A cocktail of drugs are introduced to these systems to achieve the anaesthetic state. The administration of an adequate anaesthetic is complex and at times a compromise. In which the negative side effects of the agents are traded against the anaesthetic outcomes.
(Pharmacodynam-6 Understanding anaesthesia; system wide effects
ics (PD)). Each particular drug has a number of different effects that occur at different concentrations. The order in which the effects occur and the relative concentration required vary between agents.
Anaesthesia is the product of the reversible states being: unconsciousness; am-nesia; analgesia; and immobility produced by controlled intoxications. Despite being meticulously planned, unexpected incidents are common in anaesthesia (Drews, Syroid, Agutter, Strayer & Westenskow 2006). Twenty percent of all surgeries contain unexpected incidents that potentially impact on patient safety. One incident in four is critical, posing a significant danger to the patient (Cook, Potter, Woods & McDonald 1991). A retrospective review, (Caplan, Vistica, Posner & Cheney 1997), of cases in which patients suffered injury during anaes-thesia found that 75%±3% of the adverse outcomes could have been prevented with better patient monitoring. Whether these often subtle incidents build to a catastrophic event relies on the vigilance of the anaesthetist.
Anaesthesia is the foundation upon which surgical procedures sit. Balancing the surgeons need for an optimal work place and the patients need to live, those who undertake administration of anaesthetic agents face a considerable challenge due in part to the nature of biological systems and the fact that multiple meth-ods that can achieve equivalent out comes. As physicians, anaesthesiologists are responsible for administering anaesthesia to render the patient to a set of states that allow the procedure and for managing vital life functions, including breathing, heart rhythm and blood pressure, during surgery. After surgery, they maintain the patient in a comfortable (pain free) state during the recovery and are involved in the provision of critical care medicine in the intensive care unit.
2.2
Defining anaesthesia
Plomley (1847) is recognised as the first person to define anaesthesia. Since then there have been a large number of contributions to this field reflecting a variety of drugs and anaesthetic techniques. Still, no general hypotheses exists (Urban & Bleckwenn 2002) for the mechanism of anaesthesia. There is a lack of consensus as to which physiological features constitute anaesthesia.
2.2 Defining anaesthesia 7
stimuli. In 2002 Heinke used three components to define General Anaesthesia (Urban & Bleckwenn 2002), 1. Unconsciousness; 2. amnesia; and 3. immobility. While Orser (2007) gave the following components, 1. Sedation; 2. unconscious-ness; 3. immobility; 4. amnesia; and 5. other. There is some consensus on what anaesthesia is, although the concepts that describe some anaesthetic effects are themselves abstract in nature.
2.2.1
Immobility, muscle relation
Most anaesthetic agents cause immobility at relative high concentrations. This removal of movement is however a function of the stimuli the progression of ever increasingly painful events can be seen in Figure 2.1 (Gelb et al. 2009). The suppression of movement during intubation requires a fourfold increase in the blood plasma concentration of alfentanil (ng/ml) compared to that required for skin closure.
Ever since first use of a neural muscular blocker (NMB) in 1947 the need to achieve immobility through anaesthetic agents has reduced. NMB agents unlike anaesthetics have their effect site in the peripheral nervous system; they act at the neuromuscular junctions. The use of NMB may contribute to the incidence of awareness (Myles, Symons & Leslie 2003) as they have no effect on analgesia or hypnosis.
2.2.2
Awareness, memory and unconsciousness
Intraoperative awareness is a complicated issue. All anaesthetic agents cause amnesia at relative low doses∼1/10 of the dose required for hypnosis. Regardless of this, the incidence of intraoperative awareness is∼0.1% in low risk procedures (Jones & Aggarwal 2001, Sandhu & Dash 2009) and as high as 4% in high risk procedures (Tonner & Bein 2006). Awareness in anaesthesia most often refers to remembering events from the procedure and signifies inadequate anaesthesia.
8 Understanding anaesthesia; system wide effects
Figure 2.1: Movement response curves for Alfentanil to different stimuli (adapted from Gelb et al. 2009).
Somatic and procedural memories, require effortless retrieval, are referred to as implicit memory. Episodic memory requires effort for recall and is referred to as explicit memory. Explicit memory is more sensitive than implicit memory to the effects of anaesthesia. There is little effect on conscious awareness or explicit memory at very low concentration of anaesthetic. Increasing the concentration will first remove explicit memory with little effect on conscious awareness. In-crease the anaesthetic concentration further abolishes conscious awareness. Im-plicit memory, however may still remain, these represent perception of events without consciousness. Kaul & Bharti (2002) outlines the types of memory.
1. Short term memory
2. Long term memory
(a) Procedural memory (implicit memory)
(b) Declarative memory
i. Somatic memory (implicit memory)
ii. Episodic memory (explicit memory)
The spectrum of consciousness in anaesthesia is divided into four stages;
2.3 Clinical practice 9
2. Conscious awareness with no explicit recall
3. Subconscious awareness with implicit recall
4. No awareness or recall.
Awareness occurs most commonly during relaxant anaesthesia (Myles et al. 2003).
Gelb et al. (2009) provide the model shown in Figure 2.2 as a frame work in which to discuss the anaesthetic effects. The model depicts anaesthesia as a hierarchical system in which anaesthetic agents operate at three distinct levels in the nervous system. Consciousness is thought to exist in the cortex; anaesthetic agents alter the function of the cortex to produce the anaesthetic state. Anaesthetic agents also act in the midbrain and thalamus to reduce the flow of information into the cortex. The unconscious state requires the suppressive effect of the agents to outweigh the restorative effect of the pain projections to the cortex. We will see later awareness, activity in the cortex, is required for the anaesthetic effect (chapter 7). This model of anaesthesia is well suited to the definition of Prys-Roberts (1987),
state of drug induced unconsciousness in which the patient neither perceives nor recalls noxious stimulation.
The effectiveness of an anaesthetic is not just the achieving of the required state but the stability of that state regardless of external events that may normally modify it. The challenge is to provide the required state, while minimising the negative effects of agent. All anaesthetic agents have relative small therapeutic ratios. That is the lethal dose is less than 10 times the therapeutic dose. For inhaled anaesthetics the therapeutic ratio is ∼ 3. This fact combined with the variation in pharmacokinetics across the population requires constant assessment of the patient response to the anaesthetic agent.
2.3
Clinical practice
10 Understanding anaesthesia; system wide effects
Figure 2.2: Hierarchical model of the interaction between pain and anaesthetic agents to achieve unconsciousness ( adapted from Gelb et al. 2009). Anaesthesia is the blancing of the drug effects aganst the stimuli of the operation. Anaesthetic agents act across the entire neverous system.
The anaesthetist begins by developing a drug regiment for the procedure based on the patient. The selection of agents will be influenced by both the procedure and the patients history. Duration of the anaesthetic has a significant role in the administration of anaesthesia where the duration of effect is assessed in terms of half-lives. The half- life refers to the time required for the concentration of the drug to reduce by 50%. Half-lives of anaesthetics range from the short acting propofol and isoflurane both with half-live of less than three minutes to long acting agents with half-lives in the hours. When agents with long half-lives are used the anaesthesia is terminated before the end of the procedure to allow the patient to regain consciousness quickly at the end of the procedure.
2.4 Assessing anaesthesia 11
Table 2.1: Standard anaesthetic monitors
Anaesthesia monitors
Arterial oxygen saturation (SpO2) Venous oxygen saturation (SvO2) Heart rate from ECG (HR) Mean arterial pressure (MAP)
Mean Central venous pressure (MCVP) Systolic pressure (BPsys)
Diastolic pressure (BPdia)
Depth of Anaesthesia
Measured Tidal Volume (TV)
End tidal concentration of oxygen (EtO2)
End tidal concentration of carbon dioxide (EtCO2) End tidal concentration of anaesthetic (EtAgent) Actual Respiratory Rate (RR)
inadequate intoxication, the rate is increased to the previous level. Through this recursive process the patients dose is minimized (Sebel, Lang, Rampil, White, Cork, Jopling, Smith, Glass & Manberg 1997).
2.4
Assessing anaesthesia
The monitoring of anaesthesia was first put forward by Snow (1847) who recog-nised that through observation of the patient insights into the effectiveness of the anaesthetic could be gained. Snows work formed the basis of anaesthetic practice until the work of Guedel (1951). Anaesthesia depth assessment remains primar-ily a subjective process requiring observation of physiological parameters. The anaesthetist subjective monitors the DoA with following autonomic responses; hemodynamic changes; lacrimation; sweating and; pupillary dilation. Table 2.1 (Yang & Guo 2007), demonstrates the relative importance of the vital signs to Anaesthetists. Six of the standard monitors relate to respiration, five relate to cardiac function and the remaining two relate to DoA.
12 Understanding anaesthesia; system wide effects
Table 2.2: Standard anaesthetic stimuli and the responses used to assess anaes-thesia (adapted from Gelb et al. 2009).
Stimuli Responses
Benign Noxious
Calling name Pinprick Verbal
Light touch Electrical twitch Memory; Implicit Shouting Electrical tetanus Memory; Explicit Shouting and shacking Trapezius squeeze Movement; Purposeful
Skin closure Movement; Involuntary Incision Ventilation
Abdominal exploration Sudomotor, Tearing Rib retraction Sudomotor, Sweating
Laryngoscopy Hemodynamic, Blood pressure Intubation Hemodynamic, Heart rate
2.4.1
Stimulate and Observation.
This method requires the assessment of the patients response to defined stimuli as present or not. This approach predominantly requires a suitably qualified human to make the subjective assessment of the patient. A particular advantage of the method is that it is flexible allowing features rendered irreverent by the procedure to be replaced. There is considerable down sides to a system that relies on humans to continuously make repetitive complex decisions (Rall et al. 2009). Subjective processes are prone to error (Allnutt 1987) but in the case of anaesthesia they represent the pinnacle of practice (Heyer, Adams, Moses, Quest & Connolly 2000, Leslie 2005).
There are fourteen standard stimuli that are applied to patients when determin-ing DoA. They are shown in Table 2.2 along with the ten standard responses. These produce a matrix of 140 stimuli response pairs over which, anaesthetist considers DoA (Gelb et al. 2009). Fortunately, it is not necessary to character-ize the response to every stimulus. If we charactercharacter-ize the response to a benign stimulus, such as shaking and shouting, and several noxious stimuli, such as elec-trical tetanus, incision, laryngoscopy, and intubation, these capture the clinically relevant range from benign to noxious. The Observers Assessment of Alertness and Sedation (OAAS) scale was defined by Chernik (Jensen et al. 2004) in order to have a standardized and graduated assessment of hypnosis. Cherniks scale is provided in Table 2.3.
2.4 Assessing anaesthesia 13
Table 2.3: OAAS scale (adapted from Jensen et al. 2004).
Score Responsiveness
5 Responds readily to name spoken in normal tone 4 Lethargic response to name spoken in normal tone
3 Responds only after name is called loudly and/or repeatedly 2 Responds only after mild prodding or shaking
1 Responds only after painful trapezius squeeze 0 No response after painful trapezius squeeze
are the most common. These devices rely on sound stimuli of 70 dB (Jensen, Strays, Vazquez, Rodriguez & Litvan 2003) to produce a change in the electroen-cephalogram (EEG). Detection of the response to the stimuli is a demanding task. Requiring complex signal processing up to 256 segments are needed to detect the responses. These methods suffer with poor signal to noise ratio. The other monitoring methods fall into the second category.
2.4.2
Measurement and correlation
This method relies on measurement of a feature that statistically represents the subjective assessment for a limited set of patient states, commonly five (awake, moderate sedated, sedated, deeply sedated, iso-electric (Showing no variation in electric potential)). Predominantly process EEG is used to produce an index that correlates with a subjective assessment of sedation (Glass, Bloom, Kearse, Rosow, Sebel & Manberg 1997). The method relies on assumptions that hypnosis is DoA and the effects of hypnotic agent upon EEG are consistent (Kelley 2007). Both assumptions are false. The response surface modelling (Bouillon, Bruhn, Radulescu, Andresen, Shafer, Cohane & Shafer 2004, Schumacher, Dossche, Mortier, Luginbuehl, Bouillon & Struys 2009) based on the work of (Kissin 1997) demonstrated that DoA requires consideration of the effects of analgesia along with hypnosis. While it is well known that ketamine anaesthesia does not pro-duce the typical progression in EEG (Voss & Sleigh 2007).
There are currently a number of commercially available DoA monitors. Gover & Bharti (2008) listed them in Table 2.4. These monitors belong to five groups based on the source of the bio-signal used to determine the anaesthetic state. The two largest groups are the evoked potentials and the EEG derived indexes.
anaes-14 Understanding anaesthesia; system wide effects
Table 2.4: Curentaly avaiable DoA monitoring methods (adapted from Gover & Bharti 2008).
1. Spontaneous surface electromyogram (SEMG)
2. Lower oesophageal contractility (LOC)
3. Heart rate variability (HRV)
4. Electroencephalogram derived indices
(a) Spectral edge frequency
(b) Median frequency
(c) Bispectral index
(d) Entropy
(e) Narcotrend
(f) Patient state index
(g) Snap index
(h) Cerebral state index
5. Evoked potentials
(a) Auditory evoked potentials
(b) Visual evoked potentials
(c) Somatosensory evoked potentials
(d) Auditory evoked potentials index
2.4 Assessing anaesthesia 15
Figure 2.3: Probability of movement as a function of BIS at different sites. Site 5 had no movements, (adapted from Bowdle 2006).
thesia monitoring. They listed the following limitations to EEG in determining DoA:
• Low amplitude EEG
• Drug choice
• Paradoxical delta activity
• Processing time
• Sleep
Voss & Sleigh (2007), in part concludes
... there is no known qEEG measure that can be shown to be causally related to either consciousness or memory 100% of the time. Existing EEG monitors use cortical activity as a proxy for conscious-ness.
16 Understanding anaesthesia; system wide effects
20 30 40 50 60 70 80
0 ng/ml 4 ng/ml
BIS estimate
a
0 0.1 0.2 0.3 0.4 0.5 0.6 0.7 0.8 0.9 1
0 ng/ml 4 ng/ml
Probability of consciousness
b
Figure 2.4: Population distributions for two anaesthetic regiments. Both regiments require a blood plasma concentration of propofol of 4µg/ml. The second regiment a co-administration of remifentanil of 4ng/ml. Part a shows the estimate of BIS value while b shows the estimate of the probability of conciseness returing after incision.
The PD modeling of Bouillon et al. (2004) demonstrates the differences between the BIS monitor and the probability that the patient will wake when their name is shouted and they are shaken. Figure 2.4 shows the difference between patients drawn from the models parameter population of Bouillon’s PD models for BIS and probability of response to shaking and shouting (SnS).
2.4 Assessing anaesthesia 17
notch. The points marked (+) are statistical outliers. Figure 2.4 encapsulates the criticism that EEG based DoA monitors receive from anaesthetists (Jensen et al. 2004, Leslie 2005, Leslie 2007, Myles et al. 2003).
A DoA monitoring index value has to be interpreted in the context of the drugs that have been given to produce it. Bouillon et al. (2004) experimental work measured the BIS index values while they determined the 95% boundary for the suppression of movement responses to the stimuli of shouting and shaking and laryngoscopy for Propofol / Remifentanil Anaesthesia. Dependent on the relative concentrations, BIS index value between 70 and 30 formed the boundary between an adequate and inadequate level of hypnosis. The anaesthetist is interested in whether the patient level of anaesthetic depth is stable to the ongoing experience of the surgery. The BIS monitor cannot directly answer the anaesthetist question. Aspect medical systems in their pocket guide (Kelley 2007) provide Table 2.5 to demonstrate the way in which there monitor should be used in conjunction with intraoperative response to manage anaesthetic producers.
Table 2.5: BIS Guided Hypnosis and Anaesthetic Management (adapted from Kelley 2007) Intraoperative Response BIS value Treatment Increase BP, HR, Autonomic or Somatic Response
>65 Increase Hypnotic - Increase Analgesic Iden-tify Strong Stimuli Source
50-60 Rule out Artifact, then Increase hypnotic
<50 Support BP Decrease Analgesic Consider Amnesic
Stable
>65 Increase Analgesic / Maintain Hypnotic An-tihypertensive add NMB
50-60 Titration Target Maintain Vigilance
<50 Support BP & Decrease Analgesic Hypotension
Unstable
>65 Decrease Hypnotic - Increase Analgesic - An-tihypertensive
50-60 Decrease Hypnotic & Decrease Analgesic
<50 Support BP Decrease Hypnotic and Anal-gesic
18 Understanding anaesthesia; system wide effects
for movement) in rats before and after surgical decerebration and found that MAC was unchanged by removal of cortical and forebrain structures. Antognini, Carstens & Atherley (2002) devised a goat model in which isoflurane could be delivered selectively to the brain or to the entire body. Isoflurane MAC was twice as large when only the brain received isoflurane, as when isoflurane was administered to the entire body. These studies further question the validity of measuring EEG changes to predict DoA.
In 2006 the American Society of Anesthesia task force on interoperation aware-ness, did not recommend routine DoA monitoring be included in the society stan-dards of carePractice Advisory for Intraoperative Awareness and Brain Function Monitoring: A Report by the American Society of Anesthesiologists Task Force on Intraoperative Awareness (2006).
There is a wide range of other electrophysiological monitoring available to the anaesthetist. Miller’s Anesthesia (Miller, Eriksson, Fleisher, Wiener-Kronish & Young 2009) contain chapters on Cardiovascular Monitoring (Schroeder et al. 2009), Electrocardiography (Hillel & Landesberg 2009), Respiratory Monitor-ing (Eskaros et al. 2009), Neuromuscular MonitorMonitor-ing (Viby-Mogensen 2009) and Temperature Regulation and Monitoring (Sessler 2009).
This group of monitors are generally referred to as objective methods. Although measurement of changes to the complex systems can be made (Hemmerling & Charabati 2009, Rampil 1998, Thakor & Tong 2004, Wennervirta, Hynynen, Koivusalo, Uutela, Huiku & Vakkuri 2008, Zikov et al. 2006), the meaning of these measurements are unclear, they require interpretation (Kelley 2007), to determine their significance. The problem with all methods of non-clinical elec-trophysiological scoring of anaesthetic depth is the inter-individual variation be-tween the values of different patients during similar clinical depths of anaesthesia and similar strengths of noxious stimulation. Although the mean values for a group of patients may be different at different levels of sedation and stimulation, there is considerable overlap.
2.5
Drugs
2.5 Drugs 19
Figure 2.5: Time line showing the devlopment of anaesthetic agents (adapted from Bowdle 2006).
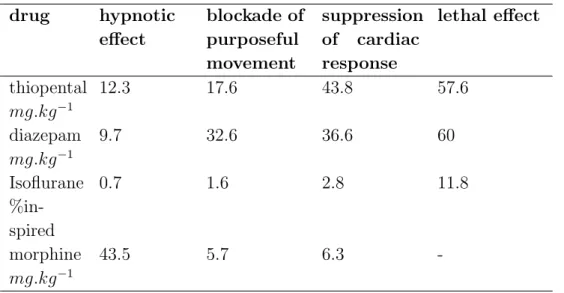
stimuli. The progression of the anaesthetic effect is unique to the agent. Table 2.6 demonstrates this point by listing the median effective dose of four anaesthetic agents for three anaesthetic end points.
Table 2.6: Median effective dose of thiopental, diazepam, isoflurane, and morphine for different endpoints of anaesthesia in rats.
drug hypnotic effect
blockade of purposeful movement
suppression of cardiac response
lethal effect
thiopental
mg.kg−1
12.3 17.6 43.8 57.6
diazepam
mg.kg−1
9.7 32.6 36.6 60
Isoflurane %in-spired
0.7 1.6 2.8 11.8
morphine
mg.kg−1
43.5 5.7 6.3
20 Understanding anaesthesia; system wide effects
2.6
Pharmacodynamic
Pharmacodynamics (PD) describe the effect of the anaesthetic as a function of drug concentration. PD models exist for a wide range of agents and effects (Calvey & Williams 2008).
Figure 2.6 from Millars Anaesthesia (Gelb et al. 2009) shows the PD modeling for Alfentanil for a seriese of end points. At the top of the figure it can be seen the blood plasma concentration of Alfentanil was determined for the time at which the stimulis was applied then patients were divided into those who respond and those who do not. Part A of the Figure 2.6 shows the population results from the logistic regression of the data. The error bars indicate the error for the effect site concentration for the median response. The low part shows response curves, for incision, calculated for individual patients. Although, there is considerable variation in drug effect across the population, population PD models are well defined. The use of PD modelling is limited by determination of the drug concentration. There are no real time methods available to measure blood plasma drug concentration.
2.7
Measuring drug concentration
For inhaled agents, the blood plasma concentration can be accurately estimated from the end tidal concentration. This underlies the dominance of inhaled agents in the maintenance phase of the anaesthetic. Eger II, Saidman & Brandstater (1965) defined the minimum alveolar concentration (MAC) of inhaled anaesthet-ics as the concentration required to prevent 50% of subjects from responding to painful stimuli. The level of the anaesthetic is set in terms of the MAC equivalent dose. The concept of MAC has been extended to cover a range of other end points, MACawake, MACincision , MACintubation, and MACbar (Kaul &
Bharti 2002).
The practice of minimization of the drug concentration requires a periodic as-sessment of effect. An asas-sessment that the anaesthesia is adequate results in a reduction of agent supply; when the assessment is that the anaesthetic is inad-equate the supply is returned to the previous level. The PK systems have long time constants with equilibrium only being reached after hours.
2.7 Measuring drug concentration 21
22 Understanding anaesthesia; system wide effects
loop control to achieve the desired blood plasma concentration. These pumps require a pharmacokinetic model to estimate drug concentration.
2.8
Pharmacokinetics
The development of pharmacokinetic (PK) models is based on the use of com-partment models (Clewell, Reddy, Lave & Andersen 2007). The compart-ments are traditionally defined by physiological features. Commonly anaesthesia models have three compartments. The three compartment model is defined as
Cp(t) = Ae−at+Be−bt+Ce−ct (Gentilini 2001). The first compartment represents
the blood and blood rich organs; the second compartment represents muscle; the third compartment represents body fat. Non-linear mix effect models ( NON-MEM), thegold standardfor PK modeling, a software package developed by Beal and Sheiner in the late 1970s (Sheiner, Rosenberg & Marathe 1977) is used to fit non-linear mixed effects models to data. NONMEM allows for the statisti-cal analyses of covariates. The population of the parameters can be assessed in terms of both inter- and intraindividual variability.
Chapter 3
Population pharmacokinetic
modelling
3.1
Introduction
Population PK is the study of the variability of drug concentration between individuals when a standard dosage regiment is administered. PK models are a major part of any drug therapy. Being able to estimate the time course of the drug disruption within the body allows for calculation of dose regiments for the chemical agent. The modern practice of anaesthesia relies on the use of PK models to estimate the blood plasma drug concentration (Calvey & Williams 2008, White & Ghouri 1991).
There is an increasing body of work that suggests that higher doses of anaesthetic agent reduce the long term life expectancy of patient. This result has driven a move to minimise the administration of anaesthetic during surgical procedures. This has seen the development of methods to administer the high potency short acting agent Propofol with syringe pumps that rely on a population PK model to calculate the infusion rate required to achieve the desired blood plasma con-centration (Cp).
3.1.1
Compartment models
24 Population pharmacokinetic modelling
Figure 3.1: Single compartment PK model.
as single compartment model. A single compartment model is represented as a volume and a clearance rate (see Figure 3.1). These models represent exponential decay. Anaesthetic agents are better represented as a three compartment model. A block representation of the three compartment mammillary model is shown in Figure 3.2.
The compartments are; the central; the fast peripheral; and the slow peripheral. Often these will be referred to in terms of physiology. It is common for the fast compartment to be referred to as the vessel rich group and the slow compartment is thought of as the fat or vessel poor group. However, for the most part the model is a mathematical construct that describes the drug distribution over time. Compartment models do not, in fact, describe drug concentration, they represent the distribution of the drug mass. Only the central compartment needs a volume to convert the mass to a concentration. The three compartment model is described by the following set of differential equations (Abdulla 2012, Gentilini 2001).
dC1(t)
dt = −(k10+k12+k13)C1(t) +k21C2(t) +k31C3(t) +I(t) (3.1) dC2(t)
dt = k12C1(t)−k21C2(t) (3.2) dC3(t)
dt = k13C1(t)−k31C3(t) (3.3) Cp(t) =
C1(t)
V1
(3.4)
whereCi(t) is the concentration of the ith compartment,k10 is the drug clerance rate, kij is the drug transfer rate from the ith compartment to the jth, V1 is the volume of the central compartment and,Cp(t) is the plasma concentration over
time t.
3.1 Introduction 25
Figure 3.2: Three compartment PK model. The flow of drug into the model is represented as the functionI(t) representing the time course of the infusion. The flow of the agent between the compartments by the four rate constants. The agent is cleared from the central compartment according tok10.
A, B, and C are the initial concentrations of the compartment, and α; β; andγ
are the rate constants for each compartment. Gentilini (2001) was able to show that thestandard three compartment model used in pharmacokinetic modelling, of anaesthetic, can be represented in the Laplace domain as a single input single output transfer function with two-zeros, and three-poles (see equation 3.5).
C(s)
I(s) =
(s+k21)(s+k31)
(s+α)(s+β)(s+γ) (3.5)
3.1.2
Physiologically based models
PK models have also been developed using physiology (Hang, Xuan & Xin-zhong 2005, Upton & Ludbrook 2005) to construct the model. The Upton model is shown in Figure 3.3. Each compartment of the model is defined by an ap-parent volume of distribution (V) and a blood flow (Q). The lung compartment consists of a sub model, three, series, tank models. While the brain and slow compartments are two compartments, membrane limited, sub models, the model considers three drug clearance, lungs, liver, and kidneys.
3.1.3
Modeling methods
The three common approaches for population pharmacokinetic modelling are outlined below.
esti-26 Population pharmacokinetic modelling
Figure 3.3: Upton drug distribution model (adapted from Upton & Ludbrook 2005).
mated from balanced pharmacokinetic data using a pooled approach com-pare favourably with other methods (Egan, Kern, Johnson & Pace 2003).
Two-stage approaches. Initially, model parameter estimates are obtained for each patient, then, a population parameter set is obtained by averaging the individual parameter estimates. This method requires that the data from each patient is sufficient to allow the fitting of the individual models and that each individual is described by the same structural model.
NONMEM (Sheiner et al. 1977) is a software package that was developed in the mid 70s by Beal and Sheiner, University of California San Francisco, to calculate nonlinear mix effect population PK models. The NONMEM approach uses extended least squares in its minimization algorithm and weights values and individuals appropriately. Mixed effect models seek to explain inter-patient variability with covariate analysis, and, in some ap-proaches, to characterize the unexplained inter-individual variability. They take into account both fixed and random effects. The steps required in the formulation of a NONMEM model, according to Minto et al. (1997) are:
1. Explore data to examine distribution of and correlation among patient covariates.
2. Determine basic population pharmacokinetic and residual variance models.
3. Obtain Bayesian estimates of individual pharmacokinetic parameter estimates, and examine distribution.
4. Select covariates using multiple linear regression, case deletion diag-nostics, generalised additive models and tree based models.
5. Determine final population pharmacokinetic model.
3.1 Introduction 27
selection criteria, examination of standard error estimates and evalu-ation of clinical significance (repeat steps 5 and 6 as required).
NONMEM has grown to dominate the PK modelling, however there are two main disadvantages. Both arise from the complexities involved in the estimation process. First, many assumptions need to be made about the form of the structural model and the form of inter-individual variation be-tween parameters. Second is the overhead the computational time required to calculate, relative modest problems may take hours to produce a sin-gle estimation, when extensive data exists it is not uncommon for a sinsin-gle estimate to take several days (Wright 1998).
In Figure 3.4 the estimates of the propofol concentration are shown for the models of Hughes, Glass & Jacobs (1992), Masui, Kira, Kazama, Hagihira, Mortier & Struys (2009), and Sch¨uttler & Ihmsen (2000b) calculated for patient 201 from Gepts, Camu, Cockshott & Douglas (1987) along with the Gepts data. Each of these models was formulated to achieve different goals; the Masui model aims to capture the early phase kinetics of propofol infusion. The Sch¨uttler model encompasses both bolus and infusion.
NONMEM allows the estimation of the parameter populations these can be used to demonstrate the variation in plasma concentration within the pop-ulation for patients that have the same covariate values. Figure 3.5 shows the distribution of the steady state blood plasma concentration, using the Sch¨uttler & Ihmsen (2000b) model, for one thousand patients who are 43 years old, with a body weight of 72 Kg and a height of 1.84 meters given an infusion of 5 mg/kg/hr propofol. Parameters for the individual patients are randomly drawn from the parameter population estimates produced for the NONMEM model. The range of the resulting steady state blood plasma concentration is between 2 and 8 mg/ml. From Figure 3.5 it is easy to understand the uncertainty that exists when a patient is administered an anaesthetic. The majority of patients will either be, under dosed, or more commonly over dosed. Over dosing of the patient results from the need to assure that the patient receive an adequate anaesthetic.
28 Population pharmacokinetic modelling
0 100 200 300 400 500 600
0 1 2 3 4 5 6
time (minutes)
Blood plasma concentration (mg/l)
Patient ID 201
Gepts data
Schuttler & Ihmsen model Masui model
Hughes model
3.1 Introduction 29
2 3 4 5 6 7 8 9
0 5 10 15 20 25 30 35 40
Blood plasma concentration male,
43yrs, 1.84m, 72kg given 5mg/kg propofol
Blood plasma concentration (mg/ml)
Count
30 Population pharmacokinetic modelling
3.1.4
Data
The data obtained from Gepts et al. (1987). It consists of 16 patients receiving an infusion of propofol lasting at least two hours at an infusion rate of 3,6, or 9 mg/Kg/Hr. Arterial blood samples were collected at selected times during and up to eight hours after infusion. High performance liquid chromatography with fluorescence was used to measure whole blood propofol concentrations. The data for each of the sixteen patients can be seen in Figure 3.6. There was one data point in the record for patient 3 that was found to be a statistical outlier. It is assumed the value of 266 was missing the decimal point and set to 2.66.
3.1.5
Modelling
There are a number of modelling methods available with the System Identi-fication toolboxTM8.1 in MatlabR, MathWorks Inc. Their performance was assessed, four methods were capable of estimating the measured blood concen-trations with a high level of fit. The four methods were; a Hammerstein-Wiener model (Ljung 2010) using piecewise linear functions as its input and output non-linearity estimators. A fourth order state space model (Ljung 2010) with all parameters free, a 10-poles, 10-zeros model that was fitted with auto regressive (AR) method (Ljung 2010), and a 5-poles, 4-zeros model that was fitted using an auto regressive moving average (ARMA) method (Ljung 2010). As it can be seen in Table 3.1 no method was able to model the blood concentration of every patient. That is a common problem in PK modelling as not all patients are well described with a single model (Gepts et al. 1987).
These methods made no concessions to the physiology that is often referenced in construction of a pharmacokinetic model. One of the models however coin-cides with the structure of a five compartment model (Yasuda, Lockhart, Eger, Weiskopf, Liu, Laster, Taheri & Peterson 1991). In this work, the ARMA model and the standard three compartment model were used to assess the ability of a neural network to map the patient covariates to the individual model parameters as a method for generating a population PK model.
3.2
Population model
3.2 Population model 31 0 500 0 5 Patient 201 Cp (mg/ml) 0 500 0 1 Patient 202 0 500 0 1 2 Patient 203 0 500 0 5 Patient 204 0 500 0 0.5 1 Patient 206 Cp (mg/ml) 0 500 0 2 4 Patient 207
0 200 400
0 2 4 Patient 208 0 500 0 5 Patient 209 0 500 0 1 Patient 210 Cp (mg/ml) 0 500 0 1 2 Patient 211 0 500 0 1 2 Patient 212 0 500 0 2 Patient 213 0 500 0 2 Patient 214 Time (minutes) Cp (mg/ml) 0 500 0 2 Patient 215 Time (minutes) 0 500 0 1 Patient 217 Time (minutes) 0 500 0 5 Patient 219 Time (minutes)
32 Population pharmacokinetic modelling
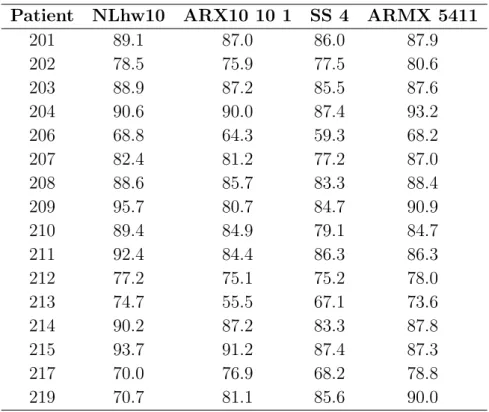
Table 3.1: Four methods that produce high levels of fit (%) for the blood concen-tration data of each patient.
Patient NLhw10 ARX10 10 1 SS 4 ARMX 5411
201 89.1 87.0 86.0 87.9
202 78.5 75.9 77.5 80.6
203 88.9 87.2 85.5 87.6
204 90.6 90.0 87.4 93.2
206 68.8 64.3 59.3 68.2
207 82.4 81.2 77.2 87.0
208 88.6 85.7 83.3 88.4
209 95.7 80.7 84.7 90.9
210 89.4 84.9 79.1 84.7
211 92.4 84.4 86.3 86.3
212 77.2 75.1 75.2 78.0
213 74.7 55.5 67.1 73.6
214 90.2 87.2 83.3 87.8
215 93.7 91.2 87.4 87.3
217 70.0 76.9 68.2 78.8
219 70.7 81.1 85.6 90.0
estimated for each minute. The interpolation should also have the effect of removing some of the error associated with the data collection process.
Two population PK models were investigated. The first utilised the standard three compartment model show in Equation 3.5. The re-sampled data for each patient was fitted to a 2-zero 3-pole model with a delay of 1 time unit using the ARX method (Ljung 2010).
The second model used the five pole four zero model in Table 3.1 as it structurally represents the five compartment model from Yasuda et al. (1991).
3.2.1