0022-538X/11/$12.00 doi:10.1128/JVI.02529-10
Copyright © 2011, American Society for Microbiology. All Rights Reserved.
HLA-DR
⫹
CD38
⫹
CD4
⫹
T Lymphocytes Have Elevated CCR5
Expression and Produce the Majority of R5-Tropic
HIV-1 RNA
In Vivo
䌤
Amie L. Meditz,
1Michelle K. Haas,
1† Joy M. Folkvord,
1Kelsey Melander,
1Russ Young,
1Martin McCarter,
2Samantha MaWhinney,
3Thomas B. Campbell,
1Yolanda Lie,
4Eoin Coakley,
4‡ David N. Levy,
5and Elizabeth Connick
1*
Division of Infectious Diseases, Department of Medicine, University of Colorado Denver, Aurora, Colorado1; Department of
Surgery, University of Colorado Denver, Aurora, Colorado2; Department of Biostatistics and Informatics, University of
Colorado Denver, Aurora, Colorado3; Monogram Biosciences, South San Francisco, California4; and
New York University, College of Dentistry, New York, New York5
Received 3 December 2010/Accepted 13 July 2011
Percentages of activated T cells correlate with HIV-1 disease progression, but the underlying mechanisms are not fully understood. We hypothesized that HLA-DRⴙ CD38ⴙ (DRⴙ 38ⴙ) CD4ⴙ T cells produce the majority of HIV-1 due to elevated expression of CCR5 and CXCR4. In phytohemagglutinin (PHA)-stimulated CD8-depleted peripheral blood mononuclear cells (PBMC) infected with HIV-1 green fluorescent protein (GFP) reporter viruses, DRⴚ38ⴙT cells constituted the majority of CCR5 (R5)-tropic (median, 62%) and CXCR4 (X4)-tropic HIV-1-producing cells (median, 61%), although cell surface CCR5 and CXCR4 were not elevated in this subset of cells. In lymph nodes from untreated individuals infected with R5-tropic HIV-1, percentages of CCR5ⴙcells were elevated in DRⴙ38ⴙCD4ⴙT cells (median, 36.4%) compared to other CD4ⴙ T-cell subsets (median values of 5.7% for DRⴚ38ⴚcells, 19.4% for DRⴙ38ⴚcells, and 7.6% for DRⴚ38ⴙcells;
nⴝ18;P< 0.001). In sorted CD8ⴚlymph node T cells, median HIV-1 RNA copies/105
cells was higher for DRⴙ 38ⴙcells (1.8ⴛ106
) than for DRⴚ38ⴚ(0.007ⴛ106
), DRⴚ38ⴙ(0.064ⴛ106
), and DRⴙ38ⴚ(0.18ⴛ106
) subsets (nⴝ8;P< 0.001 for all). After adjusting for percentages of subsets, a median of 87% of viral RNA was harbored by DRⴙ38ⴙcells. Percentages of CCR5ⴙCD4ⴙT cells and concentrations of CCR5 molecules among subsets predicted HIV-1 RNA levels among CD8ⴚDR/38 subsets (P< 0.001 for both). Median HIV-1 DNA copies/105
cells was higher in DRⴙ38ⴙcells (5,360) than in the DRⴚ38ⴚ(906), DRⴚ38ⴙ(814), and DRⴙ 38ⴚ(1,984) subsets (nⴝ 7;P<0.031). Thus, DRⴙ38ⴙCD4ⴙT cells in lymph nodes have elevated CCR5 expression, are highly susceptible to infection with R5-tropic virus, and produce the majority of R5-tropic HIV-1. PBMC assays failed to recapitulatein vivo findings, suggesting limited utility. Strategies to reduce numbers of DRⴙ38ⴙCD4ⴙT cells may substantially inhibit HIV-1 replication.
Activated T lymphocytes, identified by expression of CD38 (38) alone or in combination with HLA-DR (DR), are strongly implicated in the pathogenesis of HIV-1 infection. Susceptibil-ity to HIV-1 infection has been linked to the percentages of activated CD4⫹T cells in peripheral blood (1, 24). Further-more, the percentages of activated lymphocytes in peripheral blood (14, 21, 23) and lymph nodes (2, 35) are increased during HIV-1 infection, correlated with plasma HIV-1 RNA concen-tration (9, 19), and associated with disease progression (9, 16) and death (15, 30). The mechanisms underlying the strong association between activated lymphocytes and HIV-1 suscep-tibility and disease progression are not fully understood; both direct infection and replication of HIV-1 by activated CD4⫹ lymphocytes and indirect effects of immune activation resulting
in CD4⫹T-cell depletion have been hypothesized to play a role (44).
Knowledge of the proportion of virus replication that is supported by activated CD4⫹T cells could provide insight into the relative importance of direct infection of activated cells versus indirect effects of immune activation in HIV-1 immu-nopathogenesis. One study reported that HIV-1gag DNA is elevated in activated peripheral blood memory CD4⫹T cells (defined as 38⫹, DR⫹, or Ki67⫹ cells that also expressed CD45RO) than in other memory CD4⫹T cells (31), suggesting that activated cells may be preferentially infectedin vivo. Nev-ertheless, neither the proportion ofgagDNA nor the amount of HIV-1 RNA produced by activated memory CD4⫹T cells was determined in this study. Furthermore, it is unclear if peripheral blood measurements reflect those in lymphoid tis-sues, where the majority of HIV-1 replication occursin vivo
(12, 42, 45, 47). Most HIV-1 RNA in lymphoid tissues is pro-duced by T lymphocytes (42, 47, 50).In situanalyses of lymph nodes from 5 HIV-1-infected humans in early HIV-1 infection revealed that approximately half of the HIV-1 RNA-producing cells expressed DR (59%) or Ki67 (43%), and in 10 subjects with AIDS, even higher proportions of virus-producing cells were found in DR⫹(85%) and Ki67⫹(76%) cells (50). Nev-* Corresponding author. Mailing address: Division of Infectious
Diseases, Department of Medicine, University of Colorado Denver, 12700 E. 19th Avenue, Box B168, Aurora, CO 80045. Phone: (303) 724-4930. Fax: (303) 724-4926. E-mail: liz.connick@ucdenver.edu.
† Present address: HIV Care and Support Program, Botswana-UPenn Partnership, Gaborone, Botswana.
‡ Present address: Abbott Laboratories, Abbott Park, IL.
䌤Published ahead of print on 3 August 2011.
10189
on November 7, 2019 by guest
http://jvi.asm.org/
ertheless, the magnitude of HIV-1 RNA and DNA harbored by DR⫹38⫹T cells, which are more strongly linked to viral load and disease progression than either DR⫹cells or Ki67⫹ cells alone, has never been quantified. Furthermore, mecha-nisms underlying infection and replication of HIV-1 by acti-vated lymphocytes in lymphoid tissues, such as HIV-1 chemo-kine coreceptor expression, have not been evaluated. The purpose of the present study was to measure the amount of HIV-1 produced by DR⫹ 38⫹ CD4⫹ T cells in peripheral blood mononuclear cells (PBMC) in vitro and in lymphoid tissuesin vivoand to investigate whether HIV-1 infection of these cells is related to the levels of HIV-1 chemokine core-ceptors. We hypothesized that DR⫹38⫹CD4⫹T cells produce the majority of HIV-1 and that this is related to increased susceptibility of these cells to HIV-1 infection conferred by elevated levels of cell surface CCR5 and CXCR4.
(Part of this research was presented at the 16th Conference for Retroviruses and Opportunistic Infections in 2009 [abstract 311].)
MATERIALS AND METHODS
Study subjects and clinical specimens. Individuals at low risk for HIV-1 infection donated peripheral blood specimens forin vitroHIV-1 replication assays. Inguinal lymph nodes were obtained as previously described (12) from individuals with documented HIV-1 infection for at least 6 months, who were not receiving antiretroviral therapy and had CD4⫹T-cell counts ofⱖ300/mm3
. None of these subjects had an opportunistic infection, malignancy, or acute illness at the time of lymph node excision. Inguinal lymph nodes were also obtained from HIV-1-seronegative individuals while they underwent a nonemergent surgical procedure in the groin area. Peripheral blood specimens were obtained at the same time as lymph node specimens. Informed consent was obtained from all subjects, and the study was approved by the Colorado Multiple Institutional Review Board.
Peripheral blood mononuclear cells (PBMC) were isolated by density centrif-ugation using lymphocyte separation medium (Mediatech, Herndon, VA) ac-cording to the manufacturer’s instructions. Inguinal lymph nodes were disaggre-gated as previously described (12), and cells were either used immediately in assays or cryopreserved for future studies. In HIV-1-seropositive subjects, pe-ripheral blood CD4⫹T-cell counts were determined by flow cytometry, plasma HIV-1 RNA concentration was measured by Roche COBAS TaqMan 96 HIV-1 test (Indianapolis, IN), and HIV-1 coreceptor tropism was assayed by the Trofile test (Monogram Biosciences, South San Francisco, CA). For seronegative lymph node donors, HIV-1 serostatus was confirmed by an enzyme-linked immunosor-bent assay (ELISA).
In vitroinfection with HIV-1 GFP reporter viruses.The HIV-1 NL4-3-based CXCR4 (X4)-tropic green fluorescent protein (GFP) reporter virus NLENG1-IRES has been described elsewhere (28). A CCR5 (R5)-tropic GFP reporter virus called NLYUV3-GFP was constructed from NLENG1-IRES by replacing the envelope V3 region with the V3 loops from the YU-2 HIV-1 molecular clone. CCR5 tropism was demonstrated by successful infection of CCR5-GHOST cells, but not CXCR4-GHOST cells (NIH AIDS Research and Reference Reagent Program) (33). Virus stocks were generated by transfection of 293T cells using Effectene (Qiagen, Valencia, CA), and p24 concentration was determined by ELISA (PerkinElmer, Shelton, CT). Freshly isolated PBMC from individuals at low risk for HIV-1 infection were depleted of CD8⫹cells using CD8 anti-body-coated magnetic beads (Invitrogen, Carlsbad, CA). The cells were stimu-lated with phytohemagglutinin (PHA) (5g/ml, Sigma) in RPMI 1640 (Medi-atech, Inc., Manassas, VA) with 10% fetal bovine serum (FBS) (Invitrogen Life Science, San Diego, CA) and 10 U/ml interleukin 2 (IL-2) (Roche, Indianapolis, IN) for 60 h, and then 1⫻107
to 3⫻107
cells were incubated with 0.5 ml to 1.5 ml of either CCR5-tropic reporter virus stock (ranging from 400 to 1,050 ng of p24 antigen/ml) or CXCR4-tropic reporter virus stock (ranging from 380 to 1,050 ng of p24 antigen/ml) for 2 h at 37°C. The cells were diluted to 1⫻106cells/ml
in RPMI 1640 with 10% FBS and 10 U/ml IL-2 and incubated for 2 days at 37°C with 5% CO2. The cells were then stained with monoclonal antibodies, CD3-PE
(phycoerythrin [PE]-conjugated CD3), CD4-APC-H7 (allophycocyanin [APC] H7-conjugated CD4), HLA-DR-APC (APC-conjugated HLA-DR), CD38-PE-Cy5 (PE- and CD38-PE-Cy5-conjugated CD38) (all obtained from BD Biosciences, San
Diego, CA), and CD8-AF405 (Alexa Fluor 405 [AF405]-conjugated CD8) (In-vitrogen Life Science). Data were acquired on an LSR II flow cytometer (BD Immunocytometry System, San Jose, CA) and analyzed using FlowJo (Tree Star, Ashland, OR). For a control, a well containing uninfected cells was included in each experiment.
HIV-1 chemokine coreceptor flow cytometry analyses.Lymph node and whole blood cells were incubated with 1% normal goat serum to block nonspecific staining and then treated with antibodies to CD3-PE-Cy5 (BD Biosciences, San Jose, CA), CD4-APC-H7, CD8-AF405, CD38-fluorescein isothiocyanate (FITC) (Invitrogen Life Science), HLA-DR-APC, and CCR5-PE or CXCR4-PE (man-ufactured by BD Biosciences with known 1:1 PE/antibody ratio) for 30 min at room temperature. Red blood cells were lysed with fluorescence-activated cell sorting (FACS) lysis buffer (BD Biosciences) from whole-blood samples, and all cells were washed with phosphate-buffered saline (PBS) (Mediatech, Inc.) con-taining 1% bovine serum albumin (Sigma, St. Louis, MO) and fixed in 2% paraformaldehyde. Data were acquired using an LSR II flow cytometer (BD Immunocytometry Systems) and analyzed using FlowJo (Tree Star, Ashland, OR). QuantiBRITE beads (BD Biosciences, San Diego, CA) were used to determine the mean number of CCR5 or CXCR4 molecules on the surfaces of lymphocyte subsets as previously described (32). The linear range of these mea-surements was 474 to 69,045 PE molecules/cell.
Sorting of lymph node cells into subsets.Cryopreserved lymph node cells were thawed, stained, and sorted on a FACSAria (BD Immunocytometry Systems, San Jose, CA). To determine the amount of HIV-1 RNA in CD4⫹and CD8⫺ lymphocyte subsets, cells were stained with antibodies to CD3-PE-Cy5, CD4-APC-H7 (BD Biosciences) and CD8-AF405 (Invitrogen Life Science), gated on the CD3⫹population, and sorted into the following subsets: CD4⫹CD8⫹, CD4⫹ CD8⫺, CD4⫺CD8⫹, and CD4⫺CD8⫺. To determine the amount of HIV-1 RNA and DNA harbored by subsets defined by HLA-DR and CD38, the cells were stained with antibodies to CD3-FITC, CD38–PE-Texas Red HLA-DR-APC (BD Biosciences) and CD8-PE (Invitrogen Life Science), gated on the CD3⫹CD8⫺population, and sorted into the following subsets: DR⫹38⫹, DR⫹ 38⫺, DR⫺38⫹, and DR⫺38⫺. Aliquots of 100,000 sorted cells were stored at ⫺70°C as a dry pellet.
Quantification of HIV-1 RNA within lymph node cell subsets.Cellular RNA was extracted using a RNA blood extraction kit (Qiagen, Gaithersburg, MD). HIV-1 RNA was quantified by a nested PCR amplification of the HIV-1 long terminal repeat (LTR) by previously described methods (8, 40). HIV-1 RNA standards were included in each PCR by dilution of known amounts of the HIV-1 BAL strain in a background of 105
HIV-1 uninfected tonsil cells ranging from 100 to 106HIV copies/ml to obtain a range of 5 to 50,000 HIV copies per
first-round PCR. A standard curve was constructed by plotting the cycle thresh-old in the second PCR (cutoff, fluorescence⬎10 times the background) versus RNA concentration of HIV-1 RNA standards. All HIV-1 RNA measurements were corrected for HIV-1 DNA contamination of the RNA preparations. HIV-1 DNA concentration in the RNA preparations was determined by PCR amplifi-cation without reverse transcription. The HIV-1 DNA concentration was sub-tracted from the measured HIV-1 RNA concentration to obtain a corrected HIV-1 RNA concentration. RNA recovery was measured by adding 50 to 500,000 copies of 1 RNA (1 BAL strain) to tonsil cells from HIV-seronegative donors at the time of RNA extraction. Mean HIV-1 RNA recovery was 74% (95% confidence interval [CI], 33 to 115%).
Quantification of HIV-1 DNA within lymph node cell subsets.HIV-1 DNA was extracted using a DNeasy blood and tissue kit (Qiagen, Gaithersburg, MD). Cell-associated HIV-1 DNA was quantified by nested PCR amplification of the HIV-1 long terminal repeat. A total of 105sorted lymph node cells were
resus-pended in 200l of phosphate-buffered saline, and DNA was extracted and purified with the QIAamp blood kit (Qiagen, Inc., Chatsworth, CA). Purified cell DNA was quantitated by absorption spectroscopy at 260 nm and by real-time PCR quantification of human-actin DNA using TaqMan reagents according to the manufacturer’s instructions (Applied Biosystems, Carlsbad, CA). HIV-1 DNA was quantified by a two-step PCR amplification by previously described methods (8, 40). HIV-1 DNA standards were included in each PCR by dilution of HIV-1-infected U1 cells (7) in a background of HIV-1 uninfected MT-2 cells (17) to obtain a range of HIV-1 DNA concentrations from 1.5 to 150,000 genome copies per first-round PCR. To determine the HIV-1 DNA concentration in samples, a standard curve was constructed by plotting the cycle threshold in the second PCR (cutoff, fluorescence ofⱖ10 times the background) versus DNA concentration of HIV-1 DNA standards. All PCRs were performed by a person who was blinded to the identity of the samples, and all measurements were the means of triplicate analyses. HIV-1 DNA recovery was measured by extracting total cellular DNA from 10 to 106
chronically HIV-1-infected U1 cells (2 copies
on November 7, 2019 by guest
http://jvi.asm.org/
of HIV-1 proviral DNA/cell) (11, 26). Mean HIV-1 DNA recovery was 50% (95% CI, 22 to 78%).
Statistical analysis.All analyses assumed a two-sided test of hypothesis. Fish-er’s exact test and Wilcoxon rank sum tests were used for comparing demo-graphic data between groups. Spearman correlations were used. Nonparametric Friedman tests were used to obtain overallPvalues for analysis of DR/38 subsets nested within subject. Assuming overall significance (␣ ⫽0.05), Wilcoxon signed-rank tests were used for subsequent pairwise comparisons under a Bonferroni’s corrected significance level of␣ ⫽0.017 (0.05/3). Analyses of log10HIV-1 RNA
copies/ml as a function of subset percentage and density utilized the mixed procedure in SAS (SAS Institute, Inc., Cary, NC) with the repeated option for DR/38 subsets nested within subject. An unstructured variance/covariance matrix was chosen based on Akaike’s information criterion (25).
RESULTS
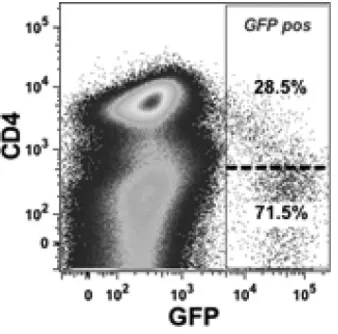
HIV-1 replication is concentrated within DRⴚ38ⴙ lympho-cytes in cultured PBMC.To determine whether the majority of HIV-1 is produced by DR⫹38⫹CD4⫹T cellsin vitro, phyto-hemagglutinin (PHA)-stimulated peripheral blood mononu-clear cells (PBMC) from 10 individuals at low risk for HIV-1 infection were infected with CCR5 (R5)- and CXCR4 (X4)-tropic HIV-1 green fluorescent protein (GFP) reporter viruses. It has previously been shown that replication of the X4-tropic reporter virus decreases CD4 expression (25), and we con-firmed that this is also true for the R5-tropic reporter virus, as shown in a representative flow cytometry plot (Fig. 1). For this reason, PBMC were first depleted of CD8⫹cells, resulting in a median of 92% (range, 65% to 96%) of CD4⫹cells within the CD3⫹ population. The cells were cultured with PHA for 2 days, then infected with R5- and X4-tropic HIV-1 GFP re-porter viruses, and analyzed for GFP expression in the lym-phocyte population 48 h later. The median percentages of GFP-positive (GFP⫹) lymphocytes were 0.07 (range, 0.03 to 1.25) for R5-tropic virus cultures and 0.19 (range, 0.06 to 1.82) for X4-tropic virus cultures (P⫽0.006). Medians of 25% and 21% of GFP⫹cells in R5-tropic and X4-tropic cultures,
re-spectively, expressed cell surface CD4 even when CD4 dim cells were included in the CD4⫹population (Fig. 1).
The proportion of DR⫺38⫹lymphocytes was 2-fold higher in the GFP⫹subset than in the GFP⫺ subset for both R5-tropic (median, 62.4% versus 31.6%, respectively) and X4-tropic virus cultures (median, 61.3% versus 31.6%, respec-tively) (Fig. 2A and B). There was no significant difference in the proportions of DR⫹38⫹cells in the GFP⫹versus GFP⫺ lymphocyte populations (median values for R5-tropic virus cultures, 8.0% versus 7.7%, respectively; median value for X4-tropic virus cultures, 8.8% versus 8.2%, respectively). Signifi-cantly lower proportions of GFP⫹compared to GFP⫺ lympho-cytes were demonstrated in the DR⫹38⫺subset (median value for R5-tropic virus cultures, 1.4% versus 6.0%, respectively; median value for X4-tropic virus cultures, 1.7% versus 5.5%, respectively) and DR⫺38⫺subset (median for R5-tropic virus cultures, 27.3% versus 54.7%, respectively; median for X4-tropic virus cultures, 22.9% versus 54.0%, respectively). Per-centages of lymphocyte subsets defined by DR and 38 were not significantly different between infected cells and cells in unin-fected control wells within each experiment (data not shown). In experiments using R5-tropic reporter virus, the mean fluo-rescence intensity (MFI) of GFP in DR⫺38⫹cells was signif-icantly higher than in DR⫹38⫹cells (Fig. 2C) (P⫽0.014). No statistically significant differences in MFI were demonstrated between other subsets infected with either reporter virus (Fig. 2C and D). Further, when the fraction of GFP⫹ cells was evaluated within each subset, the DR⫺38⫹subset harbored significantly higher percentages of GFP⫹ lymphocytes than other subsets (P⬍0.03 for all pairwise comparisons to DR⫺ 38⫹) (Fig. 2E and F). Thus, in contrast to our hypothesis, the majority of HIV-1-producing T cells were DR⫺38⫹, whereas DR⫹38⫹cells constituted a minority of virus-producing cells after 48 h ofin vitroculture.
Heightened replication of HIV-1 by the DRⴚ 38ⴙ CD4ⴙ lymphocyte subsetin vitrois not related to HIV-1 chemokine receptor levels.To evaluate whether preferential replication of HIV-1 by DR⫺38⫹T cells was related to HIV-1 chemokine receptor levels, we assessed CCR5 and CXCR4 expression on CD4⫹CD3⫹lymphocytes in additional experiments using pe-ripheral blood samples from several of the same blood donors. Density centrifugation, as well asin vitroculture with PHA, are known to alter chemokine receptor levels (4, 32, 35). Because of this, we evaluated chemokine receptor expression on CD4⫹ lymphocyte subsets defined by DR and 38 in whole blood, after density centrifugation, and after 2 days in culture with PHA (Fig. 3). Percentages of CCR5⫹and CXCR4⫹cells and con-centrations of these receptors declined in most subsets after density centrifugation to isolate PBMC but recovered to levels similar to or higher than whole-blood levels in most subsets after 2 days in culture with PHA. At this time point, which corresponds to the time when virus was added to culturesin
vitroand consequently when chemokine receptor levels would
be of greatest relevance, there was no evidence that HIV-1 chemokine coreceptors were elevated on DR⫺38⫹CD4⫹cells compared to other subsets of cells. Indeed, the median pro-portion of CCR5⫹cells in PHA-stimulated PBMC tended to be lower among DR⫺ 38⫹ CD4⫹ cells (9.0%) than among DR⫺38⫺CD4⫹(11.1%;P⫽0.84), DR⫹38⫺CD4⫹(44.6%;
[image:3.585.77.246.69.236.2]P⫽0.09), and DR⫹38⫹CD4⫹(53.9%;P⫽0.031) cells (Fig. FIG. 1. Representative flow cytometry plot of CD8-depleted
PHA-stimulated PBMC 48 h after inoculation with R5-tropic HIV-1 GFP reporter virus. The cells were acquired from the lymphocyte gate of the forward-scatter versus side-scatter profile. The majority of GFP⫹tonsil cells were CD4 negative. The cutoff between CD4⫹and CD4⫺cells is indicated by the broken line. CD4⫹ dim cells were included in the CD4⫹gate. Data were analyzed using FlowJo software (Tree Star). pos, positive.
on November 7, 2019 by guest
http://jvi.asm.org/
FIG. 2. Percentages of DR/38 lymphocyte subsets in non-virus-producing (GFP⫺) and virus-producing (GFP⫹) PHA-stimulated PBMC inoculated with R5-tropic (A) and X4-tropic (B) HIV-1 GFP reporter viruses. Mean fluorescence intensity (MFI) of GFP within virus-producing DR/38 subsets of cells inoculated with R5-tropic (C) and X4-tropic (D) HIV-1 reporter viruses. Percentages of GFP⫹cells within DR/38 subsets inoculated with R5-tropic (E) and X4-tropic (F) HIV-1 reporter viruses. PBMC from 10 individuals at low risk for HIV-1 infection were depleted of CD8⫹cells, cultured for 2 days with PHA and IL-2, inoculated with HIV-1 GFP reporter viruses, and evaluated 48 h later by flow cytometry. For panels A through D, the percentages of DR/38 subsets of cells were determined after first gating on cells in the lymphocyte gate and then on GFP⫹and GFP⫺cells. For panels E and F, the percentages of GFP⫹cells were determined after first gating on cells in the lymphocyte gate and then on each DR/38 subset. Lines link the values from an individual subject.
on November 7, 2019 by guest
http://jvi.asm.org/
3A). The numbers of cell surface CCR5 molecules per cell were higher on DR⫺38⫹cells (median, 4,094) than on DR⫺ 38⫺cells (median, 1,938;P⫽0.03) but did not differ signifi-cantly from those on DR⫹38⫹cells (median, 4,685;P⫽1.0) or DR⫹38⫺ cells (median, 3,607; P ⫽ 0.09) (Fig. 3B). No significant differences among subsets were observed in CXCR4 percentages (Fig. 3C; overallP⫽0.49) or concentrations (Fig. 3D; overallP⫽0.36). Thus, heightened replication of HIV-1 within the DR⫺38⫹lymphocyte subsetin vitrowas not related to HIV-1 chemokine receptor expression.
[image:5.585.44.543.71.414.2]DRⴚ38ⴙT cells predominate in culture conditions after 4 days of culture with PHA. To further investigate potential explanations for the concentration of virus replication within the DR⫺38⫹subset, data from the cells in control wells from the GFP reporter virus infection experiments were assessed to determine whether there was evidence that the proportions of subsets changed over time (Fig. 4). The median percentages of DR⫺38⫹cells increased from 37 at day 2 to 55 at day 4, the time of GFP analysis. The median percentages of DR⫺ 38⫺ cells also increased from 12 at day 2 to 39 at day 4. In contrast, the percentages of both DR⫹subsets declined between day 2
FIG. 3. Percentages of CCR5⫹(A) and CXCR4⫹(C) and cell surface concentrations (B and D) of these receptors, respectively, on DR/38 CD4⫹T-cell subsets in whole-blood (WB) samples, PBMC isolated by density centrifugation, and CD8-depleted PHA-stimulated PBMC cultured for 2 days. Peripheral blood samples were obtained from 6 individuals at low risk for HIV-1 infection and stained with antibodies to cell surface markers at each time point, and results were determined by flow cytometry. Chemokine receptor expression on DR/38 subsets was determined after first gating on cells in the lymphocyte gate, then on CD3⫹ CD4⫹ cells, and finally on each DR/38 subset. Asterisks indicate the values for PHA-stimulated PBMC that were different from the values for whole blood (P⫽0.03 in all instances).
FIG. 4. Percentages of DR/38 CD4⫹T-cell subsets in PBMC after 2 and 4 days of culture with PHA. PBMC from 6 individuals at low risk for HIV-1 infection were depleted of CD8⫹cells and cultured with PHA. Using flow cytometry, the percentages of DR/38 subsets of cells were determined by first gating on cells in the lymphocyte gate and then on CD3⫹ CD4⫹ cells. Lines indicate paired values from one subject. Differences between day 2 and day 4 were significant within all subsets (P⫽0.03).
on November 7, 2019 by guest
http://jvi.asm.org/
[image:5.585.301.540.500.651.2]and day 4; in particular, DR⫹38⫹CD3⫹cells declined from a median of 36% at day 2 to a median of 3% at day 4 (P⫽0.031). Thus, significant fluctuations in lymphocyte subsets were ob-served between days 2 and 4 ofin vitro culture, resulting in relative expansion of the DR⫺38⫹subset and profound re-ductions in the percentages of DR⫹38⫹cells.
Clinical characteristics of human lymph node donors. To investigate the relationship between DR⫹38⫹CD4⫹T cells and HIV-1 replication in vivo, lymph nodes and peripheral blood samples from 22 HIV-1-seropositive individuals not receiving an-tiretroviral therapy and 6 HIV-1-seronegative individuals were evaluated. Demographic and clinical characteristics of these sub-jects are shown in Table 1. Overall, 55% of HIV-1-seropositive subjects and 45% of seronegative subjects were women (P⫽1.0). Compared to seronegative individuals, seropositive individuals were younger (median age, 34 versus 51 years;P⫽0.006) and more likely to be nonwhite (75% versus 17%;P⫽0.03). Among seropositive subjects, the median CD4⫹ T-cell count was 621 (range, 256 to 1,117) cells/mm3, and the median plasma viral load
was 4.36 (range, 1.70 to 5.88) log10copies/ml. All HIV-1-infected
subjects harbored only R5-tropic virus.
The percentages of DRⴙ38ⴙCD4ⴙT cells are elevated in lymph nodes of HIV-1-seropositive subjects and correlate with CD4ⴙT-cell counts and plasma viral load.The percentages of
lymph node DR⫹38⫹ CD4⫹T cells were higher in HIV-1-seropositive subjects (median, 14.9; range, 2.1 to 32.8;n⫽18) than in seronegative subjects (median, 2.4; range, 1.3 to 10.5;
n⫽6;P⫽0.004), consistent with previous studies (35, 49). In seropositive subjects, the percentages of DR⫹38⫹CD4⫹ T cells were higher in lymph nodes (median, 20.6) than in whole blood (median, 6.9;n⫽11;P⫽0.001), as previously reported by others (35, 49). The percentages of lymph node DR⫹38⫹ CD4⫹T cells correlated inversely with CD4⫹T cell counts (r⫽
⫺0.74; 95% CI,⫺0.9 to⫺0.41;P⫽0.002) and directly with plasma HIV-1 RNA (r⫽0.53; 95% CI, 0.08 to 0.8,P⫽0.03).
Lymph node DRⴙ38ⴙCD4ⴙT cells have elevated levels of cell surface HIV-1 chemokine coreceptors.To assess whether DR⫹38⫹CD4⫹T cells have increased expression of HIV-1 chemokine receptors compared to other CD4⫹T-cell subsets, the percentages of cells that expressed HIV-1 chemokine re-ceptors and numbers of cell surface chemokine rere-ceptors were determined in lymph node cells from 18 HIV-1-seropositive and 6 HIV-1-seronegative individuals. Representative flow cy-tometry plots of the gating strategy used for stained lymph node cells are pictured in Fig. 5. Among HIV-1-seropositive subjects, the proportions of CCR5⫹ cells were significantly higher in DR⫹38⫹lymph node CD4⫹T cells (median, 36.4%) than in all other subsets (median values of 5.7% DR⫺ 38⫺ cells, 19.4% for DR⫹38⫺cells, and 7.6% for DR⫺38⫹cells) (Fig. 6A), whereas the percentages of CXCR4⫹cells did not significantly differ among subsets (Fig. 6B). The numbers of both CCR5 molecules and CXCR4 molecules per cell were also elevated on DR⫹ 38⫹ cells (Fig. 6C and D). Similar patterns of HIV-1 chemokine receptor expression were ob-served in seronegative subjects, although differences among subsets were not statistically significant after adjusting for mul-tiple comparisons. There was a trend for higher percentages of CCR5⫹cells in the DR⫹38⫹CD4⫹T-cell subset in HIV-1-seropositive versus HIV-1-seronegative subjects (median, 36.4 versus 22.5, respectively;P⫽ 0.06). However, there were no significant differences between seropositive and seronegative subjects in the proportions of CXCR4⫹cells (median value of 64.1 versus 78%, respectively;P ⫽ 0.16), numbers of CCR5 molecules (median, 3,986 versus 4,364 mol/cell, respectively;
P ⫽ 0.67) or numbers of CXCR4 molecules (median, 2,933 versus 3,834 mol/cell, respectively;P⫽0.67) in the DR⫹38⫹ CD4⫹T-cell subset.
The majority of HIV-1-producing cellsin vivodo not dem-onstrate cell surface CD4 expression. Our in vitro experi-ments demonstrated that CD4 is expressed on only a minor-ity of virus-producing cells. To determine the extent to which CD4 is downregulated on virus-producing cells in vivo, we sorted CD3⫹ lymph node cells from 6 untreated HIV-1-infected subjects into subsets defined by CD4 and CD8 expression. As shown in Fig. 7A, significantly more HIV-1 RNA copies/105cells were found in CD4⫺CD8⫺T
cells (median, 3.1 ⫻ 106) than in CD4⫹ CD8⫺ (median,
0.18 ⫻106), CD4⫹CD8⫹(median, 0.5⫻ 106), and CD4⫺
CD8⫹ (median, 0.035 ⫻ 106) (overall P ⫽ 0.001; for all
[image:6.585.43.283.91.401.2]pairwise comparisonsP⫽0.03) subsets. After adjusting for the proportion contributed by each subset (Fig. 7B), the CD4⫺CD8⫺fraction contributed a median of 48% of the total HIV-1 RNA copies compared to CD4⫹ CD8⫺ (me-dian, 15%), CD4⫹CD8⫹(median, 29%), and CD4⫺CD8⫹ TABLE 1. Demographic and clinical characteristics of
HIV-1-seropositive and -seronegative subjects
Group and subjecta Age
(yr) Sex
b Race
No. of CD4⫹T
cells/ mm3
No. of HIV-1 RNA copies (log10
copies/ml)
HIV-1-seropositive subjects
77 40 M Caucasian 913 5.26 87 26 F Caucasian 256 4.36
90 34 F Black 332 4.86
91 36 M Black 691 4.49
95 29 M Hispanic 932 3.99 102 42 F Native American 682 3.89 105 34 M Native American 568 4.66
106 41 M Black 706 5.61
110 27 M Caucasian 654 4.62
115 50 M Black 712 4.21
116 45 F Black 271 3.26
117 25 F Hispanic 1117 4.35
118 29 F Black 588 3.62
119 29 F Caucasian 257 3.85 120* 42 F Black 327 5.88 121* 36 M Black 720 4.26 122* 38 F Black 462 4.70
124 34 F Black 854 1.70
125 51 F Caucasian 351 4.80
127 23 F Black 521 3.84
129 49 F Black 547 3.06
131 27 M Caucasian 564 4.97
HIV-1-seronegative subjects
76 42 F Caucasian 89 72 M Caucasian 96 35 M Caucasian 97 73 M Caucasian 108 44 F Caucasian 109 58 F Hispanic
a
Asterisks denote the subjects who previously received antiretroviral therapy. At the time of enrollment in this study, they had been off therapy for 6 months or longer.
b
M, male; F, female.
on November 7, 2019 by guest
http://jvi.asm.org/
(median, 8%) (P⫽0.14 overall) subsets (Fig. 7C). Further analyses revealed that a strategy based on gating on CD4⫹ T cells would include only 41% (range, 25 to 53%) of HIV-1 RNA, whereas a strategy based on gating on CD8⫺ cells would include a median of 58% (range, 56 to 78%). Thus, on the basis of these data, we opted to sort CD8⫺rather than CD4⫹DR/38 T-cell subsets, as described below.
HIV-1 RNA is concentrated in DRⴙ38ⴙ T cells in lymph nodes.To evaluate whether DR⫹38⫹T cells produce the ma-jority of HIV-1in vivo, HIV-1 RNA was measured in lymph node CD8-T-cell subsets defined by DR and 38 from 8 HIV-1-seropos-itive subjects. As shown in Fig. 8A, significantly more HIV-1 RNA copies/105cells were found in CD3⫹CD8⫺T cells that
were DR⫹38⫹(median, 1.8⫻106) than in DR⫺38⫹(median,
0.064⫻ 106), DR⫹38⫺(median, 0.18⫻ 106), and DR⫺38⫺
subsets (median, 0.007⫻106) (overallP⬍0.001; for all pairwise
comparisons to DR⫹38⫹, P⫽ 0.008). After adjusting for the proportion contributed by each subset (Fig. 8B), the DR⫹38⫹ fraction contributed a median of 86% (range, 61% to 100%), of the total HIV-1 RNA copies (P⬍0.001 overall;P⫽0.008 for all pairwise comparisons to DR⫹38⫹) (Fig. 8C).
CCR5 expression on CD4ⴙT cell DR/38 subsets predicts cell-associated HIV-1 RNA concentration within CD8ⴚT-cell DR/38 subsets. We evaluated whether CCR5 expression on CD4⫹T cell DR/38 subsets predicted cell-associated HIV-1 RNA concentration within the sorted CD8⫺DR/38 subsets. The rationale for evaluating CCR5 expression on CD4⫹rather than CD8⫺subsets was that CD4⫹cells are the target cells for HIV-1, and both CD4 and CCR5 are downregulated on cells after infection with HIV-1 (6, 22, 48). The percentages of CCR5⫹CD4⫹T cells and concentrations of CCR5 receptors
on the surfaces of CD4⫹T-cell subsets were significantly re-lated to concentrations of virus within the subsets; log10HIV-1 RNA/105cells increased 0.54 (95% CI, 0.33 to 0.74) for each
10% increase in the percentage of CCR5 (Fig. 9A) and 0.73 (95% CI, 0.38 to 1.11) for each increase of 1,000 in the number of CCR5 molecules per cell (Fig. 9B). CCR5 expression on CD8⫺T cells was less strongly related to HIV-1 RNA within CD8⫺ DR/38 subsets; log10 HIV-1 RNA/105 cells increased
0.85 (95% CI,⫺0.14 to 1.82;P⫽0.088) for each 10% increase in the number of CCR5 molecules per cell and 0.61 (95% CI, ⫺0.25 to 1.48; P ⫽ 0.16) for each increase of 1,000 in the number of CCR5 molecules per cell.
HIV-1 DNA is concentrated in DRⴙ38ⴙT cells in lymph nodes.To evaluate whether elevated levels of HIV-1 RNA in DR⫹ 38⫹ cells were related to increased infection of these cells, HIV-1 DNA measurements were performed in lymph node CD8⫺T-cell subsets from 7 subjects. Significantly more HIV-1 DNA copies/105cells was found in lymph node DR⫹
38⫹CD8⫺T cells (median, 5,360; n⫽ 7) than in DR⫺38⫹ (median, 814;n⫽6;P⫽0.031), DR⫹38⫺(median, 1,984;n⫽
6;P⫽0.031), and DR⫺38⫺(median, 906;n⫽7;P⫽0.016) subsets (Fig. 8D). After adjusting for the proportion of total cells contributed by each subset (Fig. 8B), DR⫹ 38⫹ cells harbored a median of 64% (range, 19 to 87%) of CD8⫺ T-cell-associated HIV-1 DNA in 5 subjects for whom DNA data were available for all 4 subsets (P⫽0.16) (Fig. 8E).
DISCUSSION
This is the first study to quantify HIV-1 RNA and chemo-kine coreceptor levels in activated T cells from human lym-FIG. 5. Representative flow cytometry plots of lymph node cells. The cells were acquired from the lymphocyte gate of the forward- versus side-scatter profile. A dot plot was used to define CD3⫹CD4⫹cells (A) and gates for CD38 (B) and HLA-DR (C) set with fluorescence minus one (FMO) controls. CD4⫹CD3⫹lymphocytes were evaluated in a CD38 versus HLA-DR plot (D), and CCR5 expression was evaluated in four DR 38 subsets using histograms (E). Data were analyzed using FlowJo software (Tree Star).
on November 7, 2019 by guest
http://jvi.asm.org/
phoid tissues. While prior studies have suggested that activated lymphocytes are preferentially infected (31) and contribute to HIV-1 replicationin vivo(51), the proportion of virus replica-tion that occurs in these cells in vivo and the mechanisms underlying their facility to propagate HIV-1 are not known. The present study was designed to evaluate the hypothesis that activated CD4⫹T cells are the source of the majority of HIV-1
both in vitro and in vivo and to explore the role of HIV-1
chemokine coreceptors in promoting virus replication by these cells.In vitro, DR⫹38⫹T cells constituted a minority of virus-producing cells, and replication was unrelated to HIV-1 chemokine receptor expression.In vivo, the majority of R5-tropic HIV-1 RNA was found in DR⫹38⫹T cells, and in four of five subjects, the majority of HIV-1 DNA was found in these cells as well. The percentages of CCR5⫹cells were higher in the DR⫹38⫹CD4⫹T-cell subset than in other CD4⫹T-cell subsets in lymphoid tissues, and the percentages and density of CCR5⫹ CD4⫹ T cells predicted the amount of R5-tropic HIV-1 RNA among subsets. These data demonstrate that DR⫹38⫹CD4⫹T cells in lymphoid tissues are highly suscep-tible to infection with R5-tropic virus, possibly due to
height-ened expression of CCR5, and produce the majority of R5-tropic HIV-1in vivo.
In vitro studies in PBMC failed to recapitulate thein vivo
observation that HIV-1 replication is concentrated within lymph node DR⫹38⫹ lymphocytes. Instead, the majority of both R5- and X4-tropic HIV-1 replication in PBMC occurred within DR⫺38⫹lymphocytes and was unrelated to chemokine receptor expression. A dramatic decline in percentages of DR⫹38⫹cells was seen in culture, consistent with prior ob-servations that activated T cells are predisposed to apoptosis (3, 18). In addition, some HIV-1-producing DR⫹38⫹cells may have been transformed into DR⫺38⫹cells because HIV-1nef
[image:8.585.111.472.73.407.2]is known to downregulate major histocompatibility complex class II (MHC-II) by endocytosis (5, 43, 46). Thus, preferential replication of HIV-1 by DR⫺38⫹cellsin vitromay have been due to relative resistance of these cells to HIV-1-induced apop-tosis and/or downregulation of DR on HIV-1-producing DR⫹ 38⫹cells. Fundamental differences between peripheral blood and lymphoid tissue lymphocytes in their ability to support HIV-1 replication could explain the differences between cell types that propagated HIV-1in vitroandin vivo. Tonsil cells FIG. 6. Percentages of CCR5⫹(A) and CXCR4⫹(B) and concentrations of these HIV-1 coreceptors (C and D), respectively, in DR/38 CD3⫹ CD4⫹ subsets of lymph node cells from HIV-1-seropositive individuals (n⫽18) and HIV-1-seronegative individuals (n⫽6). Each symbol represents the value for an individual. Short horizontal lines indicate median values for groups of individuals.Pvalues indicate comparisons between DR⫹38⫹cells and other subsets in seropositive subjects. Asterisks denotePvalues that were no longer statistically significant after Bonferroni’s correction for multiple comparisons (cutoff,P⫽0.017). Differences between DR⫹38⫹cells and other subsets in seronegative subjects and differences between seropositive and seronegative subjects were not statistically significant after adjusting for multiple comparisons.
on November 7, 2019 by guest
http://jvi.asm.org/
have been demonstrated to be more permissive for HIV-1 than PBMC (10). In anex vivohuman tonsil tissue model, cells that expressed CD25 and/or DR were the major cell types that replicated R5 virus (3). In an ex vivo cervicovaginal tissue model, productive R5 infection occurred preferentially in CD38⫹T cells (41). Nevertheless, none of these studies exam-ined whether cells that expressed both DR and 38
preferen-tially replicated HIV-1, and therefore, it is not possible to determine whether these model systems recapitulated the pref-erential propagation of HIV-1 by DR⫹38⫹cells that we ob-served in lymphoid tissuesin vivo. Differences between acute HIV-1 infection of seronegative human cells using soluble ex-tracellular virus compared to cell-to-cell transfer of virus in lymphoid tissues during chronic HIV-1 infection may also ac-count for the failure of the vitro culture system to parallel HIV-1 replication in lymph node cellsin vivo. Future studies could be directed at dissecting out reasons why PBMC assays failed to recapitulate in vivofindings from lymph node cells from untreated HIV-1-infected subjects. The discordance be-tween ourin vitroandin vivofindings illustrates the limitations of the PHA-stimulated PBMC model of HIV-1 replication and underscores the importance of validatingin vitrofindings with
in vivodata.
This is the first study to demonstrate that CCR5 is highly expressed on DR⫹38⫹CD4⫹T cells in lymph nodes and that differences in the amounts of HIV-1 RNA produced by DR/38 subsetsin vivoare related to the percentages of CCR5⫹cells and density of CCR5 on these cells. One prior study that evaluated lymph nodes from HIV-1-infected individuals did not detect a correlation between CCR5 expression on CD4⫹T cells and lymph node cellular HIV-1 RNA (35). This study included individuals who were receiving antiretroviral therapy and individuals with X4-tropic HIV-1 in their analyses, how-ever, which may have obscured an association.In vitrostudies have suggested that the number of CCR5 molecules per cell is a critical determinant of HIV-1 susceptibility (27, 36, 38), and one group reported that the concentrations of CCR5 mole-cules on CD4⫹ T cells, but not the percentages of CCR5⫹ CD4⫹ T cells in peripheral blood, correlate with viral load (39). In the present study, however, both the percentage of CCR5⫹cells and number of CCR5 molecules per cell corre-lated with HIV-1 RNA within lymphocyte subsets, suggesting that both may be major determinants of HIV-1 susceptibility in lymphoid tissues. Prior studies have demonstrated that HIV-1 infection itself does not alter CCR5 levels in peripheral blood CD4⫹T cells (29, 39), and we found similar percentages of CCR5 molecules in activated lymph node cells from seropos-itive and seronegative individuals in this study. Thus, the cor-relation between percentages and density of CCR5⫹activated T cells and HIV-1 RNA observed in this study is unlikely to be due to induction of CCR5 by HIV-1 replication. These findings provide circumstantial evidence that expression of CCR5 fa-cilitates the preferential replication of R5-tropic HIV-1 by DR⫹38⫹T cellsin vivobut do not eliminate the possibility that other factors may play a role. Further studies including studies of a larger number of subjects are warranted to confirm or refute the preliminary findings of the relationship between CCR5 expression and HIV-1 RNA from this study.
Whether activated CD4⫹ T cells propagate HIV-1 more efficiently than other CD4⫹T cells is unknown.In situanalyses of lymph nodes from 5 HIV-1-infected humans in early HIV-1 infection revealed that the amount of HIV-1 RNA per pro-ductively infected cell was approximately 4 times higher in HLA-DR⫹or Ki67⫹cells than in other cells (50). Neverthe-less, that study did not evaluate the amount of HIV-1 RNA in DR⫹ 38⫹ cells. Two lines of evidence in the present study suggest that the amount of HIV-1 RNA produced per produc-FIG. 7. HIV-1 RNA measurements within subsets of CD4/CD8
CD3⫹lymph node cells (n⫽6). (A) Numbers of HIV-1 RNA copies/ 105cells; (B) percentages of CD4/CD8 subsets within CD8⫺CD3⫹ lymph node cells; (C) percentages of total RNA copies contributed by each CD4/CD8 subset after adjusting for percentages of subsets shown in panel B. For each box-and-whisker plot, the line indicates the median and the whiskers (error bars) indicate the range. Lymph node cells from untreated HIV-1-seropositive subjects were sorted into sub-sets on a cell sorter, and aliquots of 105cells were frozen as pellets. HIV-1 RNA was then extracted and measured by PCR.
on November 7, 2019 by guest
http://jvi.asm.org/
tively infected DR⫹38⫹ cell is not different from that pro-duced by other cells. First,in vitroinfection of PHA-stimulated PBMC with HIV-1 reporter viruses did not reveal consistent differences in the mean fluorescence intensity (MFI) of GFP between DR⫹38⫹cells and other subsets (Fig. 2). Second, the pattern of concentration of HIV-1 RNA and DNA among the 4 subsetsin vivo(Fig. 8) was similar in most subjects, suggest-ing that the amount of DNA, rather than the cell type, was the major determinant of how much RNA was produced. Never-theless, these observations do not exclude the possibility that DR⫹ 38⫹ cells produce more virions per infected cell than other subsets. This question could be addressed definitively by
limiting dilution assays and measurement of HIV-1 RNA among purified cells from each subset.
[image:10.585.91.490.73.505.2]A shortcoming of this study is that virus replication and chemokine receptor levels were determined only in lymph nodes, whereas HIV-1 is propagated within a variety of other secondary lymphoid tissuesin vivo, including spleen and mu-cosal lymphoid tissues. The percentage of total body lympho-cytes that are harbored within lymph nodes is controversial, but it has been estimated that approximately 41% of lympho-cytes are found in lymph nodes (13). It would be important to determine in future studies whether R5-tropic HIV-1 replica-tion in other secondary lymphoid tissues is concentrated within FIG. 8. HIV-1 RNA and DNA measurements within subsets of DR/38 CD8⫺CD3⫹lymph node cells. (A) Numbers of HIV-1 RNA copies/105 cells; (B) percentages of DR/38 subsets within CD8⫺CD3⫹lymph node cells; (C) percentages of total RNA copies contributed by each DR/38 subset after adjusting for percentages of subsets shown in panel B; (D) numbers of HIV-1 DNA copies/105cells; (E) percentages of total DNA copies contributed by each DR/38 subset after adjusting for percentages of subsets shown in panel B. Lymph node cells from untreated HIV-1-seropositive subjects were sorted into subsets on a cell sorter, and aliquots of 105cells were frozen as pellets. HIV-1 RNA and DNA were then extracted and measured by PCR.
on November 7, 2019 by guest
http://jvi.asm.org/
activated lymphocytes and whether these cells also have ele-vated CCR5 expression. Another limitation of the present study is that none of the study subjects harbored X4-tropic virus, and consequently, conclusions concerning HIV-1 repli-cationin vivoare limited to R5-tropic virus. Interestingly, un-like CCR5, the percentages of CXCR4⫹cells were not ele-vated in DR⫹38⫹CD4⫹T-cell subsets in lymph node (Fig. 6). Measurement of HIV-1 RNA in T-cell subsets from lymphoid tissues of individuals infected with X4-tropic virus or with mixed tropic viruses could potentially provide important in-sight regarding the immunopathogenesis of X4-tropic virus. A final limitation of this study is that although our gating strategy on CD8⫺ T cells included the majority of HIV-1 RNA-pro-ducing cells, it excluded the CD4⫹CD8⫹subset, which pro-portionally accounted for a median of 29% of total RNA copies (Fig. 7C). One prior study characterized the HIV-1-specific functional properties of these cells in peripheral blood samples from HIV-1-infected individuals and concluded that they shared effector profiles of both CD4⫹and CD8⫹T cells (20). Virtually nothing is known, however, about the CD4⫹ CD8⫹T-cell population in lymph nodes. Because of the low frequency of CD4⫹ CD8⫹ T cells in the lymph node cell population, we were unable to perform parallel sorting exper-iments to measure HIV-1 RNA in DR/38 subsets. Neverthe-less, further study of this subset, which harbored the second highest burden of HIV-1 RNA, is warranted.
The present study significantly advances understanding of the link between immune activation and HIV-1 pathogenesis, as it demonstrates that activated T cells are central to the propagation of HIV-1 in vivo. It has been hypothesized that immune activation may also contribute to CD4⫹T-cell deple-tion indirectly through a variety of mechanisms, including ac-tivation-induced death, immune senescence, and immune sup-pression (44). Results of the present study do not exclude a potential role for these mechanisms, although the need to invoke indirect mechanisms seems less clear in light of the pivotal role of activated lymphocytes in HIV-1 replication. The findings from this study suggest that therapeutic strategies to reduce the number of DR⫹ 38⫹ CD4⫹ T cells could limit HIV-1 replication and consequently disease progression. The
efficacy and feasibility of such interventions are supported by the fact that HIV-1-infected individuals with remarkably low levels of immune activation and very low viral loads have been reported (7); these individuals seem to be otherwise healthy, suggesting that low levels of DR⫹38⫹CD4⫹T cells do not confer an immune deficit. Although therapies to suppress im-mune activation have not resulted in dramatic improvements in virologic control in HIV-1-infected individuals so far (34, 37), it is unclear whether these therapies truly reduced frac-tions of DR⫹38⫹T cells in lymphoid tissues where the ma-jority of HIV-1 is produced. A better understanding of the ontogeny of DR⫹38⫹CD4⫹T cells in lymphoid tissues and identification of enzymes that are specific to their development could reveal potential targets for intervention. Development of
in vitromodels that accurately recapitulate HIV-1 replication
in vivocould facilitate studies to develop targeted therapies to
interrupt immune activation-associated HIV-1 replication in vivo. Ultimately, strategies aimed at reducing the number of DR⫹38⫹CD4⫹T cells could represent a new class of host-directed therapies and further add to the armamentarium of antiretroviral therapies for HIV-1 infection.
ACKNOWLEDGMENTS
This work was supported by Public Health Services grant R21 HD051450 from the National Institute of Child Health and Human Development and the University of Colorado Center for AIDS Re-search grants P30 AI054907 and K08 AI080285 from the National Institute of Allergy and Infectious Diseases, National Institutes of Health.
We express our gratitude to the subjects who participated in this study. We also thank John Koeppe, Patty Caraway, Graham Ray, Cathi Basler, and Beverly Putnam for assistance in recruiting study subjects; Karen Whalen for assistance in lymph node surgical procedures; Mark Nehler and David Fullerton for assistance in procuring HIV-1-sero-negative nodes; the NIH AIDS Research and Reference Reagent Program and Vineet N. Kewal Ramani and Dan R. Littman for pro-vision of GHOST cells; and Elizabeth Kelly and Brent Palmer for assistance with cell sorting.
REFERENCES
[image:11.585.46.541.69.239.2]1.Begaud, E., et al.2006. Reduced CD4 T cell activation and in vitro suscep-tibility to HIV-1 infection in exposed uninfected Central Africans. Retrovi-rology3:35.
FIG. 9. Percentage of CCR5⫹(A) and number of CCR5 molecules (B) on CD4⫹T cells within lymph node cell DR/38 subsets and predicted log10HIV-1 RNA within the corresponding DR/38 CD8⫺CD3⫹subset.
on November 7, 2019 by guest
http://jvi.asm.org/
2.Biancotto, A., et al.2007. Abnormal activation and cytokine spectra in lymph nodes of people chronically infected with HIV-1. Blood109:4272–4279. 3.Biancotto, A., et al.2008. HIV-1 induced activation of CD4⫹T cells creates
new targets for HIV-1 infection in human lymphoid tissue ex vivo. Blood 111:699–704.
4.Bleul, C. C., L. Wu, J. A. Hoxie, T. A. Springer, and C. R. Mackay.1997. The HIV coreceptors CXCR4 and CCR5 are differentially expressed and regu-lated on human T lymphocytes. Proc. Natl. Acad. Sci. U. S. A.94:1925–1930. 5.Chaudhry, A., et al.2009. HIV-1 Nef promotes endocytosis of cell surface MHC class II molecules via a constitutive pathway. J. Immunol.183:2415– 2424.
6.Choudhary, S. K., et al.2005. R5 human immunodeficiency virus type 1 infection of fetal thymic organ culture induces cytokine and CCR5 expres-sion. J. Virol.79:458–471.
7.Choudhary, S. K., et al.2007. Low immune activation despite high levels of pathogenic human immunodeficiency virus type 1 results in long-term asymptomatic disease. J. Virol.81:8838–8842.
8.de Baar, M. P., et al.1999. Design and evaluation of a human immunode-ficiency virus type 1 RNA assay using nucleic acid sequence-based amplifi-cation technology able to quantify both group M and O viruses by using the long terminal repeat as target. J. Clin. Microbiol.37:1813–1818.
9.Deeks, S. G., et al.2004. Immune activation set point during early HIV infection predicts subsequent CD4⫹T-cell changes independent of viral load. Blood104:942–947.
10.Doitsh, G., et al.2010. Abortive HIV infection mediates CD4 T cell deple-tion and inflammadeple-tion in human lymphoid tissue. Cell143:789–801. 11.Folks, T. M., et al.1988. Characterization of a promonocyte clone
chroni-cally infected with HIV and inducible by 13-phorbol-12-myristate acetate. J. Immunol.140:1117–1122.
12.Folkvord, J. M., C. Armon, and E. Connick.2005. Lymphoid follicles are sites of heightened human immunodeficiency virus type 1 (HIV-1) replica-tion and reduced antiretroviral effector mechanisms. AIDS Res. Hum. Ret-roviruses21:363–370.
13.Ganusov, V. V., and R. J. De Boer.2007. Do most lymphocytes in humans really reside in the gut? Trends Immunol.28:514–518.
14.Giorgi, J. V., and R. Detels.1989. T-cell subset alterations in HIV-infected homosexual men: NIAID Multicenter AIDS cohort study. Clin. Immunol. Immunopathol.52:10–18.
15.Giorgi, J. V., et al.1999. Shorter survival in advanced human immunodefi-ciency virus type 1 infection is more closely associated with T lymphocyte activation than with plasma virus burden or virus chemokine coreceptor usage. J. Infect. Dis.179:859–870.
16.Giorgi, J. V., et al.1993. Elevated levels of CD38⫹CD8⫹T cells in HIV infection add to the prognostic value of low CD4⫹T cell levels: results of 6 years of follow-up. The Los Angeles Center, Multicenter AIDS Cohort Study. J. Acquir. Immune Defic. Syndr.6:904–912.
17.Goldsmith, M. A., M. T. Warmerdam, R. E. Atchison, M. D. Miller, and W. C. Greene. 1995. Dissociation of the CD4 downregulation and viral infectivity enhancement functions of human immunodeficiency virus type 1 Nef. J. Virol.69:4112–4121.
18.Gougeon, M. L., et al.1996. Programmed cell death in peripheral lympho-cytes from HIV-infected persons: increased susceptibility to apoptosis of CD4 and CD8 T cells correlates with lymphocyte activation and with disease progression. J. Immunol.156:3509–3520.
19.Hazenberg, M. D., et al.2003. Persistent immune activation in HIV-1 infec-tion is associated with progression to AIDS. AIDS17:1881–1888. 20.Howe, R., et al.2009. Phenotypic and functional characterization of
HIV-1-specific CD4⫹CD8⫹double-positive T cells in early and chronic HIV-1 infection. J. Acquir. Immune Defic. Syndr.50:444–456.
21.Hunt, P. W., et al.2008. Relationship between T cell activation and CD4⫹ T cell count in HIV-seropositive individuals with undetectable plasma HIV RNA levels in the absence of therapy. J. Infect. Dis.197:126–133. 22.Karlsson, I., et al.2005. Differential pathogenesis of primary CCR5-using
human immunodeficiency virus type 1 isolates in ex vivo human lymphoid tissue. J. Virol.79:11151–11160.
23.Kestens, L., et al.1994. Selective increase of activation antigens HLA-DR and CD38 on CD4⫹CD45RO⫹T lymphocytes during HIV-1 infection. Clin. Exp. Immunol.95:436–441.
24.Koning, F. A., et al.2005. Low-level CD4⫹T cell activation is associated with low susceptibility to HIV-1 infection. J. Immunol.175:6117–6122. 25.Kutsch, O., E. N. Benveniste, G. M. Shaw, and D. N. Levy.2002. Direct and
quantitative single-cell analysis of human immunodeficiency virus type 1 reactivation from latency. J. Virol.76:8776–8786.
26.Laurence, J., M. B. Sellers, and S. K. Sikder.1989. Effect of glucocorticoids on chronic human immunodeficiency virus (HIV) infection and HIV pro-moter-mediated transcription. Blood74:291–297.
27.Lee, B., M. Sharron, L. J. Montaner, D. Weissman, and R. W. Doms.1999.
Quantification of CD4, CCR5, and CXCR4 levels on lymphocyte subsets, dendritic cells, and differentially conditioned monocyte-derived macro-phages. Proc. Natl. Acad. Sci. U. S. A.96:5215–5220.
28.Levy, D. N., G. M. Aldrovandi, O. Kutsch, and G. M. Shaw.2004. Dynamics of HIV-1 recombination in its natural target cells. Proc. Natl. Acad. Sci. U. S. A.101:4204–4209.
29.Lin, Y. L., et al.2002. Cell surface CCR5 density determines the postentry efficiency of R5 HIV-1 infection. Proc. Natl. Acad. Sci. U. S. A.99:15590– 15595.
30.Liu, Z., et al.1997. Elevated CD38 antigen expression on CD8⫹T cells is a stronger marker for the risk of chronic HIV disease progression to AIDS and death in the Multicenter AIDS Cohort Study than CD4⫹cell count, soluble immune activation markers, or combinations of HLA-DR and CD38 expres-sion. J. Acquir. Immune Defic. Syndr. Hum. Retrovirol.16:83–92. 31.Maenetje, P., et al.2010. A steady state of CD4⫹T cell memory maturation
and activation is established during primary subtype C HIV-1 infection. J. Immunol.184:4926–4935.
32.Meditz, A. L., et al.2008. SDF-1alpha is a potent inducer of HIV-1-specific CD8⫹T-cell chemotaxis, but migration of CD8⫹T cells is impaired at high viral loads. AIDS Res. Hum. Retroviruses24:977–985.
33.Morner, A., et al. 1999. Primary human immunodeficiency virus type 2 (HIV-2) isolates, like HIV-1 isolates, frequently use CCR5 but show pro-miscuity in coreceptor usage. J. Virol.73:2343–2349.
34.Murray, S. M., et al.2010. Reduction of immune activation with chloroquine therapy during chronic HIV infection. J. Virol.84:12082–12086.
35.Nokta, M. A., et al.2001. Chemokine/CD4 receptor density ratios correlate with HIV replication in lymph node and peripheral blood of HIV-infected individuals. AIDS15:161–169.
36.Platt, E. J., K. Wehrly, S. E. Kuhmann, B. Chesebro, and D. Kabat.1998. Effects of CCR5 and CD4 cell surface concentrations on infections by mac-rophagetropic isolates of human immunodeficiency virus type 1. J. Virol. 72:2855–2864.
37.Read, S. W., et al.2010. The effect of leflunomide on cycling and activation of T-cells in HIV-1-infected participants. PLoS One5:e11937.
38.Reeves, J. D., et al.2002. Sensitivity of HIV-1 to entry inhibitors correlates with envelope/coreceptor affinity, receptor density, and fusion kinetics. Proc. Natl. Acad. Sci. U. S. A.99:16249–16254.
39.Reynes, J., et al.2001. CD4 T cell surface CCR5 density as a host factor in HIV-1 disease progression. AIDS15:1627–1634.
40.Rouet, F., et al.2005. Transfer and evaluation of an automated, low-cost real-time reverse transcription-PCR test for diagnosis and monitoring of human immunodeficiency virus type 1 infection in a West African resource-limited setting. J. Clin. Microbiol.43:2709–2717.
41.Saba, E., et al.2010. HIV-1 sexual transmission: early events of HIV-1 infection of human cervico-vaginal tissue in an optimized ex vivo model. Mucosal Immunol.3:280–290.
42.Schacker, T., et al.2001. Productive infection of T cells in lymphoid tissues during primary and early human immunodeficiency virus infection. J. Infect. Dis.183:555–562.
43.Schindler, M., et al.2003. Down-modulation of mature major histocompat-ibility complex class II and up-regulation of invariant chain cell surface expression are well-conserved functions of human and simian immunodefi-ciency virus nef alleles. J. Virol.77:10548–10556.
44.Sodora, D. L., and G. Silvestri.2008. Immune activation and AIDS patho-genesis. AIDS22:439–446.
45.Spiegel, H., H. Herbst, G. Niedobitek, H. D. Foss, and H. Stein.1992. Follicular dendritic cells are a major reservoir for human immunodeficiency virus type 1 in lymphoid tissues facilitating infection of CD4⫹T-helper cells. Am. J. Pathol.140:15–22.
46.Stumptner-Cuvelette, P., et al. 2001. HIV-1 Nef impairs MHC class II antigen presentation and surface expression. Proc. Natl. Acad. Sci. U. S. A. 98:12144–12149.
47.Tenner-Racz, K., and P. Racz.1995. Follicular dendritic cells initiate and maintain infection of the germinal centers by human immunodeficiency virus. Curr. Top. Microbiol. Immunol.201:141–159.
48.Wang, J. M., et al.1998. HIV-1 envelope gp120 inhibits the monocyte response to chemokines through CD4 signal-dependent chemokine receptor down-regulation. J. Immunol.161:4309–4317.
49.Yang, O. O., et al.2005. Effects of HIV-1 infection on lymphocyte pheno-types in blood versus lymph nodes. J. Acquir. Immune Defic. Syndr.39:507– 518.
50.Zhang, Z., et al.1999. Sexual transmission and propagation of SIV and HIV in resting and activated CD4⫹T cells. Science286:1353–1357.
51.Zhang, Z. Q., et al.2004. Roles of substrate availability and infection of resting and activated CD4⫹T cells in transmission and acute simian immu-nodeficiency virus infection. Proc. Natl. Acad. Sci. U. S. A.101:5640–5645.