A National Statistics publication
National Statistics are produced to high professional standards set out in the National Statistics Code of Practice. They undergo regular quality assurance reviews
Statistical First Release
Participation in Education, Training and Employment
by 16-18 year olds in England: End 2014
Reference SFR 19/2015 Date 25 June 2015 Coverage England
Theme Children, Education and Skills
Issued by Department for Education, Sanctuary Buildings, Great Smith Street, London SW1P 3BT Press office 020 7783 8300
Public enquiries 0370 000 2288 Statistician Sally Marshall
Phone 0114 2742317
Email Post16.Statistics@education.gsi.gov.uk
Internet Statistics: NEET and participation
Rise in full-time education at each age…largest increase at age 17
Participation in full-time education by 16-18 year olds rose by 1.6 percentage points (ppts) between 2013 and 2014 to 71.5%, the highest level since consistent records began in 1994. The largest annual increase was for 17 year olds (+2.8ppts to 76.8%). There were also increases in proportions in full-time education at age 16 (+1.9ppts to 87.9%) and at age 18 (+0.6ppts to 50.5%).
Continued rise in overall participation in
education and work based learning (WBL)
Participation by 16-18 year olds in education and WBL continues to rise. At end 2014 the participation rate was 81.8% - an increase of 1.0ppts since end 2013, and the highest level on record. As with full-time education, the annual increase in overall participation in education and WBL was largest for 17 year olds (+2.0ppts points to 87.2%).
16-18 year olds not in education, employment or training (NEET) has fallen further
Contents
1. Summary statistics for end 2013 and provisional end 2014 ... 2
2. Headline changes from 2013 to 2014 ... 2
3. Background and Content ... 4
4. Commentary – trends in participation since 1994 ... 5
5. Commentary – trends in the proportion NEET since 1994 ... 10
6. List of tables ... 13
7. Technical Notes and Definitions ... 15
8. Scheduled revisions to previously published statistics ... 20
9. Further information is available ... 22
10. Got a query? Like to give feedback? ... 23
[image:2.595.73.534.98.301.2]1.
Summary statistics for end 2013 and provisional end 2014
Table A: Key statistics for 16, 17 and 18 year olds
% of age 16 % of age 17 % of age 18 % of age 16-18 2013 2014
(prov)
2013 2014
(prov)
2013 2014
(prov)
2013 2014
(prov)
Annual change (ppts)
Full-time education 86.0 87.9 74.0 76.8 49.9 50.5 69.9 71.5 +1.6
Part-time education 4.7 3.3 5.5 4.0 6.2 5.4 5.5 4.2 -1.2
Work-based learning 3.3 3.5 6.1 6.9 8.2 8.8 5.9 6.5 +0.6
Education and WBL 93.7 94.4 85.3 87.2 63.8 64.3 80.9 81.8 +1.0
Education and training 95.5 96.4 89.2 91.0 71.5 72.3 85.4 86.4 +1.1
NEET 4.0 3.3 6.3 5.4 12.9 13.1 7.7 7.3 -0.4
1 Education and WBL takes into account overlaps between WBL and full and part-time education
2.
Headline changes from 2013 to 2014
Participation by 16-18 year olds in full-time education rose by 1.6 percentage points (ppts)
There were increases in full-time education at each of ages 16, 17 and 18 compared to 2013. The largest was seen at age 17 year olds, rising +2.8ppts to 76.8%. This cohort was the first to be required to continue in training or education for a year at age 16 under phase 1 of RPA, and the rise at age 17 this year follows an increase of 2.4ppts at age 16 between 2012 and 2013.
There was a shift from part-time to full-part-time learning in further education (FE) colleges2
Whilst the proportion of 16-18 year olds studying full-time in FE colleges rose by 0.6ppts – the biggest increase of all the main provider types - this was more than offset by a large fall in participation in part-time education (predominantly delivered via FE), which fell by -1.2ppts from 5.5% to 4.2% in 2014. This proportion of 16-18 year olds in part-time education was the lowest since consistent records began in 1994.
Falls in part-time participation were seen for all age groups, although larger for 16 and 17 year olds (-1.5ppts) than 18 year olds (-0.8ppts).
Participation by 16-18 year olds in education and work based learning increased by 1.0ppts
In addition to the increase in full-time education, participation in work-based learning (WBL) rose by +0.6ppts to 6.5% (mostly through apprenticeships at Level 2).
Overall, the proportion of 16-18 year olds in education and work based learning rose by +1.0ppts to 81.8% in 2014.
A large increase in study of GCSEs
Between 2013 and 2014 there was an increase from 2.0% to 3.3% in the proportion of 16-18 year olds in full-time education and studying for GCSEs as their highest qualification, with the biggest annual change at age 16, which rose 2.2ppts to 6.8%. This is likely to have been brought about by the requirements for meeting the new conditions of funding for maths and English introduced in August 2014 (see technical notes and definitions). Nearly half of 16-18 year olds were in full-time education studying for a level 3 qualification (48.3%), an increase of 0.7ppts from 2013. This reflects increased level 3 study at ages 16 and 17 (+0.6ppts and +2.1ppts respectively), and a roughly unchanged rate at age 18 (-0.1ppts).
16-18 year old NEET continues to fall
The proportion of 16-18 year olds not in education, employment or training (NEET) fell by -0.4ppts, from 7.7% in 2013 to 7.3% in 2014. This is the lowest level since consistent records began in 1994 and follows a -1.5ppts fall in 2013.
3.
Background and Content
This statistical first release (SFR) contains provisional estimates for end 2014 for the participation of 16 to 18 year olds in education, training and employment in England. It also updates the end 2013 estimates from SFR 18/2014 which were published in June 2014.
The estimates relate to a snapshot of activities at the end of the calendar year, and are based on academic age, defined as ‘age at the start of the academic year’.
Information is drawn together from various post-16 data sources to give a coherent and comprehensive picture of participation, including schools, further education, work-based learning and higher education.
The key analyses are by age, gender, type of learning, institution type, labour market status and highest qualification being studied.
These are the Department for Education’s definitive measures of participation for 16 to 18 year olds, and sets recent changes in the context of historical trends. These measures are used to monitor progress against the Department’s objectives of raising participation and reducing the number of young people NEET (not in education, employment or training).
Raising the Participation Age
Legislation was introduced in 2013/14 increasing the age to which all young people in England are required to remain in education or training.
Introduced in two stages it applies to:
Young people who left year 11 in summer 2013, who must stay in some form of education or training for at least a further year until 27 June 2014;
Young people who started in year 11 (or years below) in September 2013, who will have to continue until at least their 18th birthday.
The first cohort impacted by stage 1 of Raising the Participation Age (RPA) legislation were academic age 16 (first year of FE) in 2013/14 and are now academic age 17 in 2014/15. Those young people impacted by stage 2 of RPA are academic age 16 in 2014/15.
The definition of participation in this SFR differs from that which meets the RPA duty to participate – see Section 7 for more detail on the difference.
4.
Commentary – trends in participation since 1994
Participation at age 16 and 17 since 1994
Full-time education was broadly flat from the early 1990s to 2001…
….however, falls in part-time education and work-based learning led to the proportion not in any education and training (NET) increasing for both 16 and 17 year olds by 2001 (+4.9ppts to 14% for age 16 and +3.9ppts to 21.5% for age 17 from 1994 when consistent records began).
Full-time education then rose from 2001 to 2009….
….resulting in 83.8% of 16 year olds and 72.9% of 17 year olds participating in full-time education by 2009. Although some of the increase came from reductions in other forms of participation (part-time education, work-based learning, employer funded training or other education and training), for the most part the increase reflected an overall expansion in participation in education and training. This led to the proportion of 16 year olds not in education and training (NET) falling from 14.0% at end 2001 to 6.8% at end 2009, and from 21.5% to 12.9% at age 17.
Overall participation stagnated at age 16 and rose slightly at age 17 between 2009 and 2012
Between 2009 and 2012 overall participation in education and training for 16 year olds hovered in the range 93.1-93.5%, with increased part-time education (+1.4ppts) over the period being cancelled out by a fall in work-based learning (-1.6ppts).
At age 17 from 2009 to 2012 trends in participation are less clear cut, with full-time education fluctuating between 72.9-74.6%, but
increasing part-time education (+0.8ppts). The combined effect was overall participation by 17 year olds in education and training increasing by 1.8ppts between 2009 and 2012.
Following RPA legislation participation increased sharply in 2013 for 16 year olds and in 2014 for 17 year olds
In 2013, increases in 16 year olds participating in both full-time and part-time education (+2.4ppts and +0.2ppts respectively) meant overall participation in education and training at age 16 rose to its highest level since consistent records began in 1994. Figures for 2014 show overall participation levels for 16 year olds continue to rise. Part-time participation by 16 year olds fell by -1.5ppts between 2013 and 2014, but a further increase in full-time education (+1.9ppts) and in work-based learning (+0.3ppts) led to an overall increase.
in this SFR. However, the proportion in education and work-based learning will still be higher than the proportion engaging in RPA-compliant participation [see Section 3 for a link to the published statistics related to the duty to participate and Section 7 for detail on how they are different].
In the latest data for 2014 we observe a sharp increase in the
proportion of 17 year olds in full-time education, rising by +2.8% to 76.8%, part-time education falling by -1.5ppts to 4.0%, and WBL increasing by +0.7% to 6.9%. This has led to an increase of +2.0ppts in the proportion of 17 year olds participating in education and WBL (RPA compliance best estimate) and an increase of 1.8ppts in the overall education and training figure for 17 year olds in 2014
Chart 1: Trends in participation in education and training at
age 16 and 17: England end 1994-end 2014
Age 16
Full and part-time education at age 16 and 17 by institution type (see Table B for the detailed breakdown)
Full-time education increased across all institution types between 2013 and 2014…
The biggest increase was seen in FE colleges, rising by +1.1ppts to 30.7% of 16-17 year olds in 2014, but schools (+0.5ppts) and sixth form colleges (+0.3ppts) also saw rises.
…but part-time education fell sharply
Participation by 16-17 year olds in part-time education (predominantly delivered in FE colleges) fell -1.5ppts to 3.6% in 2014, the lowest level since consistent records began. In FE colleges, the fall in part-time education (-1.4ppts) more than offset the increase in full-time education at these ages (+1.1ppts). There was also a fall in part-time education in sixth form colleges (-0.1ppts), but a larger increase in full-time education (+0.3ppts) meant a small rise in participation by 16-17 year olds in sixth form colleges overall.
Table B: Participation in full and part-time education at age
16 and 17 by institution type
% of age 16 and 17
Full-time education Part-time education
end 2013 end 2014 (prov) annual change (ppts) end 2013 end 2014 (prov) annual change (ppts)
State-funded schools 32.0 32.5 0.5 0.0 0.0 0.0
Special schools 0.8 0.9 0.1 0.0 0.0 0.0
Independent schools 6.2 6.4 0.2 0.0 0.0 0.0
Sixth form colleges 11.0 11.3 0.3 0.2 0.1 -0.1
General FE, tertiary and specialist colleges 29.6 30.7 1.1 4.9 3.5 -1.4
Higher education institutions 0.4 0.5 0.0 0.0 0.0 0.0
Total 80.0 82.2 2.3 5.1 3.6 -1.5
Participation at age 18 since 1994
Full-time education, and overall participation, were fairly flat between 1994 and 2003
The proportion of 18 year olds in full-time education fluctuated in the range 38.2-41.3% in the 10 year period from 1994 to 2003, with a net change of -1.0ppts from 1994 to 2003.
Falls in part-time education over this period were offset by increases in work-based learning and other employer-funded training (EFT) to leave the proportion not in any education and training (NET) almost flat from 38.9% in 1994 to 39.0% in 2003.
Full-time education then rose every year from 2003 to 2011…
…..but then fell sharply between 2011 and 2012
In 2012 there was a large (-2.1ppts) fall in the proportion of 18 year olds studying full-time in higher education institutions– reversing a large increase in 2011 (+2.7ppts). This was the result of behavioural change due to changes to tuition fees – fewer people deferring entry to avoid higher fees. The fall in full-time education was mostly offset by increases in other participation, so the proportion of 18 year olds not in education or training (NET) only rose slightly (+0.04ppts).
By 2014 full-time
education at 18 was back to its 2011 level….
At the end of 2014 the proportion of 18 year olds in full-time education was 50.5%, an increase of +2.2ppts since 2012 and a return to the level seen in 2011 - equalling the highest level since consistent records began in 1994.
…and overall participation at its highest level since consistent records began
Participation in apprenticeships at age 18 has been rising since 2011, and rose by 0.6ppts to 8.8% between 2013 and 2014. Although this was offset by participation in part-time education falling (-0.8ppts) as at other ages, overall the proportion of 18 year olds in education and training rose by 0.8ppts to 72.3%- the highest level since consistent records began in 1994.
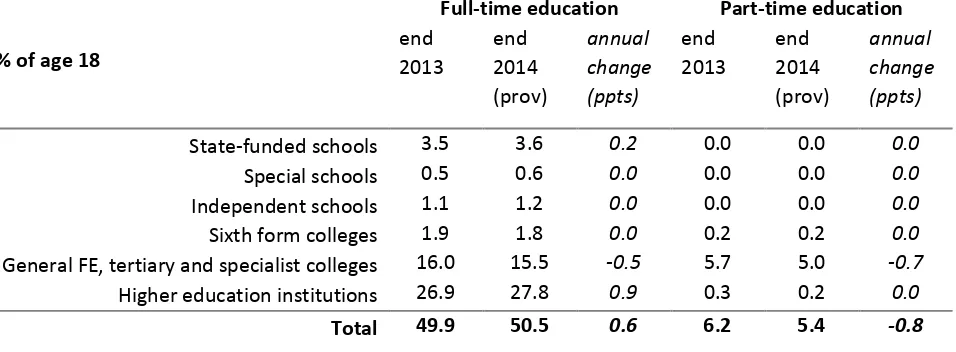
Full and part-time education at age 18 by institution type (see Table D for the detailed breakdown)
Full-time education in higher education
institutions rose between 2013 and 2014, but fell in FE colleges
Most full-time provision at age 18 occurs in higher education institutions. The proportion of 18 year olds studying full-time in higher education institutions rose by 0.9ppts to 27.8% in 2014, the highest level since consistent records began. The vast majority of these are studying for a level 4 or degree-level qualification (27.4% of the cohort). In the next most common setting for full-time education at age 18, FE colleges, there was a fall of -0.5ppts to 15.5% of the cohort in 2014.
As at 16 and 17, there was a fall in part-time
education at 18
[image:9.595.79.557.327.503.2]The vast majority of part-time education at age 18 takes place in FE colleges, where there was a fall of -0.7ppts between 2013 and 2014, from 5.7% to 5.0%. There was also a small fall in part-time education in higher education institutions, from 0.3% to 0.2% of the cohort.
Table D: Participation in full and part-time education at age
18 by institution type
% of age 18
Full-time education Part-time education
end 2013
end 2014 (prov)
annual change (ppts)
end 2013
end 2014 (prov)
annual change (ppts)
State-funded schools 3.5 3.6 0.2 0.0 0.0 0.0
Special schools 0.5 0.6 0.0 0.0 0.0 0.0
Independent schools 1.1 1.2 0.0 0.0 0.0 0.0
Sixth form colleges 1.9 1.8 0.0 0.2 0.2 0.0
General FE, tertiary and specialist colleges 16.0 15.5 -0.5 5.7 5.0 -0.7
Higher education institutions 26.9 27.8 0.9 0.3 0.2 0.0
5.
Commentary – trends in the proportion NEET since 1994
Two factors affect the proportion of young people not in education, employment or training (NEET)
NEET is determined by:
(i) the proportion not in any education and training (NET)
The proportion of young people who are not in education, employment or training (NEET) is determined by the size of the group not in education or training (NET), and the employment rate of that group. As we have seen above, the size of the NET group has been tending to fall at each of ages 16, 17 and 18 in recent years, and at end 2014 all are at their lowest level since consistent data began in 1994.
(ii) the employment rate for young people who are NET
As Chart 3 shows, the general long-term trend has been for the employment rate for young people NET at each age to fall since 1994. Between 2011 and 2013 we saw a rise in the employment rate for 17 and 18 year olds, but in 2014 it fell slightly at both these ages. Conversely, at age 16 the rate rose slightly, having previously fallen each year since 2007.
Chart 3: Employment rate of young people not in education
or training (NET) by age: England, end 1994 - end 2014
The impact on the proportion NEET depends on the balance between changes in NET and changes in the employment rate for the NET group at different ages
At age 16 NET fell and the NET employment rate rose slightly at end 2014; both combined to push the
SFR 18/2014: Participation in Education, Training and Employment by 16-18 year olds in England, end 2013, issued 25 June 2014
NEET rate to its lowest level
the lowest level since consistent records began. (see Chart 4 below).
At age 17, although the employment rate for the NET group fell, there was a large fall in the proportion NET, leading to a
reduction in NEET
The general trend in the proportion NEET at age 17 is similar to that observed at age 16, with the proportion tending to fall since 2005. Since 2012 the NEET rate has fallen more sharply, with a further 0.9ppts fall to 5.4% in 2014.
In 2014 we saw a large fall in the proportion of 17 year olds NET compared to 2013 (-1.8ppts); over the previous 4 year period NET fell by -1.6ppts in total for this age group. This fall in 17 year olds NET is likely to be in part a result of the RPA policy as this is the first cohort required to continue in some form of education and training at age 16, and many will have chosen to remain in education or training for a further year. The employment rate for the NET group was slightly lower in 2014 compared to 2013 (39.9% vs 41.8% respectively), but this was more than offset by the large reduction in the size of the NET group, leading to the fall in NEET.
At age 18 there was a fall in NET, but a fall in the employment rate for the NET group led to the NEET rising slightly.
At age 18 although there was a fall in the proportion NET (-0.8ppts), there was a larger fall in the employment rate for the NET group (from 54.9% in 2013 to 52.9% in 2014), which pushed the proportion of 18 year olds NEET up by +0.2ppts in 2014 to 13.1%. This slight increase follows a -1.8ppts change in 18 year olds NEET between 2012 and 2013.
Historically, at age 18 the employment rate of the NET group has a stronger influence over the NEET rate than at 16 and 17 because the size of the NET group is bigger. So whilst the proportion NET had tended to edge lower from 2003 to 2009, the consistently falling employment rate for the NET group more than offset that, leading to an increase in NEET. Since 2009 the employment rate of the NET group has been more erratic, but consecutive increases in the
SFR 18/2014: Participation in Education, Training and Employment by 16-18 year olds in England, end 2013, issued 25 June 2014
SFR 18/2014: Participation in Education, Training and Employment by 16-18 year olds in England, end 2013, issued 25 June 2014
6.
List of tables
The following tables are available in excel format on the department’s statistics website:
Statistics: NEET and participation
Main SFR tables Education and Training
1 Number in education and training, end
2012, end 2013, and end 2014 (provisional).
1a Participation rate in education and
training, end 2012, end 2013, and end 2014 (provisional).
Institution type
2 Number in education by institution type,
end 2012, end 2013, and end 2014 (provisional).
2a Participation rate in education by
institution type, end 2012, end 2013, and end 2014 (provisional).
Labour market
3 Number in education and training by
labour market status, end 2012, end 2013, and end 2014 (provisional).
3a Participation rate in education and
training by labour market status, end 2012, end 2013, and end 2014 (provisional).
Highest qualification aim
4 Number in full-time education by highest
qualification aim, and work-based
learning, end 2012, end 2013, and end 2014 (provisional).
4a Participation rate in full-time education
by highest qualification aim, and work-based learning, end 2012, end 2013, and end 2014 (provisional).
Education and Training (time-series)
5 Number in education and training, 1994
onwards.
5a Participation rate in education and
training, 1994 onwards.
Figures published with main SFR tables
Participation rates
1 Participation rate of 16 year olds in
education and training.
2 Participation rate of 17 year olds in
education and training.
3 Participation rate of 18 year olds in
education and training.
4 Participation rate of 16 to 18 year
olds in education and training.
Additional tables (time-series from 1985)
A1-A15 Participation in education and
training, equivalent to Table 1 in the SFR.
B1-B15 Participation in education by
institution type, equivalent to Table 2 in the SFR.
C1-C15 Participation in full-time education by
highest qualification aim and
institution type, and work-based learning. More detailed than Table 4 in the SFR.
D1-D15 Participation in education and training by labour market status, equivalent to Table 3 in the SFR.
E1-E15 Participation in full-time and
part-time education by highest
SFR 18/2014: Participation in Education, Training and Employment by 16-18 year olds in England, end 2013, issued 25 June 2014
When reviewing the tables, please note the following:
We preserve confidentiality
The Code of Practice for Official Statistics requires we take reasonable steps to ensure that our published or disseminated statistics protect confidentiality.
So we round numbers We round numbers to the nearest hundred. Because of this rounding, totals in text and in tables may not always equal the sum of their component parts. Similarly, differences quoted in text may not always be the same as differences shown in tables. Where any number is shown as zero the original figure was zero. Where a number rounds to zero, the figure has been replaced by a ‘-‘. This suppression and rounding is consistent with the Departmental statistical policy.
We’ve made some small but important changes to the tables in this year’s publication.
i) We are no longer publishing additional tables showing local authority (LA) estimates of participation in education and work-based learning by 16- to 17-year-olds as part of this statistical first release. The Department for Education now publishes alternative, timelier, figures for local participation based on local authority data, here: Participation in education and training by local authority ii) Labour Force Survey (LFS) datasets are routinely reweighted in line with population estimates. The most recent update introduced a new weighting variable, PWT14, to LFS datasets from July - September 2001 onwards. This is the first participation SFR to use this reweighted data. More information as to its impact on the NEET and NET rates was published as part of SFR 47/2014 NEET Quarterly Brief – July to September 2014.Trends of the NEET and NET estimates are largely unaffected by the reweighting.
SFR 18/2014: Participation in Education, Training and Employment by 16-18 year olds in England, end 2013, issued 25 June 2014
7.
Technical Notes and Definitions
We use a combination of different sources
The estimates of participation in education, training and employment combine data from a number of sources, with procedures to identify young people in more than one form of provision, to give a view of the cohort as a whole.
Academic Age The age of a learner is measured at the beginning of the academic year, 31 August.
Reference Dates Data for further education institutions (FEI) relate to November 2014 and higher education institution (HEI) data relate to December 2014. Data relates to January 2015 for population, schools and work-based learning (WBL). The Labour Force Survey relates to October 2014 to March 2015.
Figures for other years refer to the same months.
Provisional data The figures for end 2014 are provisional while the figures for end 2013 have been updated and are now final.
The full-time education definition varies according to institution type
Schools full-time= 10 sessions a week, where 1 session is half a day. FEI full-time= From 2013 a full-time learner is defined as someone enrolled on a programme of learning totalling 540+ planned hours per year, from either qualification guided learning hours (GLH) or employability, enrichment and pastoral (EEP) planned hours; pre 2013 full-time learners are defined as those enrolled on programme of learning of 450+ qualification guided learning hours per year, or at least 150 GLH per tri-annual period, or more than 16 GLH per week for shorter courses.
HEI fulltime= 21 hours a week for 24 weeks a year.
Full-time learners in private further and higher education establishments are excluded from the full-time education figures but included in ‘other education and training’ (OET).
Overlaps are accounted for
Learners studying an FE course as well as participating in WBL (in the same FEI) are included in the full-time figure as well as the WBL figure, but also reported in the overlap group and counted once in the totals. Learners participating only in WBL in an FEI are reported as WBL only. Learners in Employer Funded training (EFT) as well as publicly funded full-time education are only included in the full-time figure and not the EFT figure.
Work-based learning (WBL) comprises…
SFR 18/2014: Participation in Education, Training and Employment by 16-18 year olds in England, end 2013, issued 25 June 2014
Employer Funded Training (EFT)
Figures for EFT cover employees who have received training in the past 4 weeks; these figures are restricted to training other than WBL. They will include non-WBL apprentices and others on long and short term training programmes, but exclude those who have previously received training in their current job, though not in the last 4 weeks. They cover only young people who are in employment.
Other Education and Training (OET)
OET refers to young people who are studying, but are not included in other categories. The majority of these young people will be studying part-time in a further education college or sixth-form college or other institution types described under the heading ‘part-time education’ in SFR Table 2. However, some will be attending private colleges or training centres, and this activity is only reported under the OET heading. The relative contribution of private
institutions and part-time education to OET can be estimated from the more detailed data in Additional Tables A1-A15, published as ‘additional information’ to this SFR.
Labour market status The definitions of labour market status used in this publication are the same as those in the Labour Force Survey (LFS), and follow the conventions promoted by the International Labour Organisation (ILO):
in employment: an employee, self-employed, on a WBL programme
or an unpaid family worker. This includes young people in full-time education who also have part-time jobs.
ILO unemployed: anyone (including full-time learners) who is out
of work, available to start work in the next two weeks, and has either looked for work in the last four weeks or is waiting to start a job they have already obtained.
economically inactive: neither in employment nor ILO unemployed
i.e. not active in the labour market.
Labour Force Survey (LFS)
The LFS covers all residential households and nursing
accommodation. Householders are asked to reply on behalf of students living away in halls of residence. The LFS excludes people outside such accommodation - chiefly hospital residents, people in prison, people in army barracks and the homeless.
The LFS is a sample survey so all estimates of labour market participation are subject to sampling error, as are the estimates for the non-HEI (higher education institutions) based components of employer funded training (EFT) and other education and training (OET).
Not in education, employment or training (NEET) is estimated in two stages...
SFR 18/2014: Participation in Education, Training and Employment by 16-18 year olds in England, end 2013, issued 25 June 2014
Second, the proportion NEET from the total group NET is estimated using the LFS.
If a young person is studying qualifications at different levels they are reported against their highest level of study
All qualifications studied are classified as one of the following seven categories:
Higher education (Level 4 and above)
GCE and VCE A/AS levels
Level 3 equivalents
GCSE
Level 2 equivalents
Level 1
Other courses
Qualification levels are defined by the Qualification and Credit Framework (QCF) - for further information and examples see
Compare different qualifications
Young people in full-time education studying more than one course are attributed to the course appearing first in the list. Young people in special schools and Pupil Referral Units (PRUs), for whom there is no qualification breakdown, are included under ‘Other courses’ in SFR Table 4.
There are differences between activity that complies with the duty to participate under RPA and what is captured in this SFR
Activity that satisfies the duty to participate under RPA legislation is described in detail in the statutory guidance to Local Authorities. In summary, young people in full-time education or apprenticeships automatically meet the duty to participate, but in order to comply with RPA, part-time education for academic age 16 year olds: (i) must include planned qualification guided learning hours of a minimum 280hrs per year; (ii) should usually be combined with full-time employment or voluntary work (either 20hrs per week or 40hrs over 2 weeks for those with less regular hours).
In this SFR participation that is not full-time is automatically counted as part-time, irrespective of planned hours or whether it is combined with employment. This will mean that RPA-compliance will be significantly lower than the proportion of 16 year olds reported as being in education and work-based learning.
However, this will be partially offset as 16 year olds engaged in LA approved re-engagement activities will satisfy the duty to
participate but the activity might not be recorded in this SFR.
16 to 19 funding: maths and English condition of funding
SFR 18/2014: Participation in Education, Training and Employment by 16-18 year olds in England, end 2013, issued 25 June 2014
Data Sources for National Estimates Schools
Information for maintained schools, City Technology Colleges (CTCs), Academies, free schools, pupil referral units (PRUs) and special schools are derived from the school census. From 2002 this has collected data at pupil rather than school level. Data from independent schools are collected at school level from the annual school census. The schools figures are all final.
Further Education (FE) Institutions
The Skills Funding Agency (SFA) Individualised Learner Record (ILR) provides data on learners in FE sector colleges. The ‘FE college’ sector is mainly General FE, tertiary and specialist college provision, but also includes some other FE delivered through commercial, charitable and local authority providers.
Snapshot data as at 1 November has been used. The data underlying this SFR are the SN06 freeze for 2014/15 and the SN14 freeze for 2013/14. The ILR data for 2014 is provisional and will be revised in the June 2016 publication. Figures for previous years are final.
Work Based Learning (WBL)
The SFA ILR provides monthly data on young people on WBL programmes. Snapshot data as at 1 January has been used, for end 2001 onwards.
As with the FE data, the WBL data underlying this SFR come from the SN06 freeze for 2014/15 and the SN14 freeze for 2013/14.
Higher Education Institutions (HEI)
Students in institutions of higher education on 1 December are included from data supplied by the Higher Education Statistics Agency (HESA). Figures for end 2013 and earlier years are final.
HESA figures for end 2014 are not available until January 2016. Therefore, numbers on higher education courses have been carried over from the previous year. Student numbers on higher education courses in 2013 have been grossed up to produce 2014 estimates using information from the Higher Education Students Early Statistics (HESES) collected by the Higher Education Funding Council for England.
Labour Force Survey (LFS)
Figures on labour market status for end 2014 come from the average of Quarter 4 2014 (October to December 2014) and Quarter 1 2015 (January to March 2015) LFS data. It also supplies the non-HEI based data for Employer Funded Training (EFT) and for Other Education and Training (OET).
SFR 18/2014: Participation in Education, Training and Employment by 16-18 year olds in England, end 2013, issued 25 June 2014
Population estimates
The population estimates for academic year ages in January of each year are derived by DfE from mid-year estimates and projections provided by the Office for National Statistics (ONS).
ONS mid-year estimates are based on the 2011 Census and are subject to statistical uncertainties arising from sampling error and imputation effects in the 2011 Census, as well as from estimation of the components that age the population forward from the 2011 Census date.
SFR 18/2014: Participation in Education, Training and Employment by 16-18 year olds in England, end 2013, issued 25 June 2014
8.
Scheduled revisions to previously published statistics
Further Education Institution, Higher Education Institutions and work-based learning are revised
The numbers participating in further education institutions (FE colleges and sixth-form colleges) and higher education institutions are revised as the source data are finalised. These planned revisions only occur for the latest year for which statistics are published. For example, data described in this SFR “as end 2014 (provisional)” will be finalised as “end 2014” in the June 2016 update to this SFR. Such changes can affect both the numbers studying and the proportion of the age cohort studying.
Further Education Institution revisions impact on the ratio of full to part-time learners
The revisions to the data on further education institutions historically has had an impact on the estimates for full-time education versus part-time education, as the designation of a young person as either full or part-time in colleges could change retrospectively. The table below shows the difference between the provisional and final end 2011, 2012 and 2013 estimates for full-time and part-time education in further education institutions.
Provisional Final Change (final - provisional)
Full-time Part-time Full-time Part-time
Full-time
Part-time
End 2011
Age 16 268,638 34,940 272,661 30,450 4,023 -4,490
Age 17 253,341 39,269 256,266 35,760 2,925 -3,509
Age 18 122,792 37,205 124,506 34,864 1,714 -2,341
End 2012
Age 16 268,041 32,847 272,289 28,685 4,248 -4,162
Age 17 249,537 37,450 253,658 33,615 4,121 -3,835
Age 18 120,356 38,023 122,735 37,173 2,379 -850
End 2013
Age 16 277,640 31,166 278,034 30,199 394 -967
Age 17 246,837 36,700 248,378 35,247 1,541 -1453
Age 18 117,216 38,731 117,262 38,457 46 -274
The impact of revisions to Higher Education data
The changes in the Higher Education institution data from provisional to final for the last three years are shown below.
Provisional Final Change (final - provisional)
All HE (end 2011)
Age 16 2,139 2,180 41
Age 17 7,550 7,517 -33
Age 18 177,012 185,070 8,058
All HE (end 2012)
Age 16 1,639 1,114 -525
Age 17 5,922 6,221 299
Age 18 158,705 170,231 11,526
All HE (end 2013)
Age 16 1,112 858 -254
Age 17 6,377 5,286 -1,091
SFR 18/2014: Participation in Education, Training and Employment by 16-18 year olds in England, end 2013, issued 25 June 2014
Revisions to population estimates
All numbers published as a proportion of the population cohort will be revised when population estimates are revised by the Office for National Statistics (ONS). For example, if the population estimate is revised upwards then all things being equal (that is no change in the administrative-based estimate of learner numbers) the statistics for the proportion of the population studying will be revised downwards proportionately. In addition, there will be a more direct impact on the estimate of the numbers of young people not in education and training. This is calculated, for the most part, as a residual from the size of the population and the number of young people recorded as participating on administrative datasets, so an increase in the population will result in an increase in the estimate of young people not in education and training (NET) and correspondingly in the estimate of NEET. The ONS
population statistics are re-based every two years, but revisions can extend further back. If the size of the revision is significant we would retrospectively revise the SFR statistics, as
happened in February 2013 (when the June 2012 SFR statistics were updated earlier than normal given large revisions to the population).
SFR 18/2014: Participation in Education, Training and Employment by 16-18 year olds in England, end 2013, issued 25 June 2014
9.
Further information is available
Local Authority level participation estimates
Local authority (LA) level participation estimates can be obtained from the Client Caseload Information System (CCIS).
In earlier editions of this publication Additional tables were published alongside the national publication giving local authority participation statistics. These have now been discontinued and the CCIS data referenced above should be used for LA level participation estimates.
NEET estimates at local authority level
Local authority estimates are based on the Client Caseload
Information System. The time-series extends back to 2004. The current activity for some of the 16-18 year olds is unknown, and has to be estimated.
National NEET and participation figures in more recent time periods
The DfE also publishes participation and NEET statistics based on the Labour Force Survey on a quarterly basis in the NEET Quarterly
Brief. However, this data is based on relatively small survey samples
and therefore not as accurate.
Destinations of young people after Key Stage 4 and Key Stage 5
The destination measures SFR published on 27th January 2015 shows
percentage of young people in 2012/13 continuing in education, on apprenticeships or in employment after completing Key Stage 4 and Key Stage 5. These are based on the National Pupil Database matched to data from the Individualised Learner Record, Higher Education Statistics Authority data and the National Client Caseload Information System.
Previously published figures
These are still available on the government's website.
Figures for Wales, Scotland and the UK
These participation statistics only collect information about institutions in England. For information for Wales, Scotland and the UK, contact the departments below or access their statistics at the following links:
Wales: Welsh Government: Participation of young people in Education and the Labour Market
Scotland: Local Area Labour markets in Scotland: Statistics from the Annual Population Survey
SFR 18/2014: Participation in Education, Training and Employment by 16-18 year olds in England, end 2013, issued 25 June 2014
10.
Got a query? Like to give feedback?
If from the media Press Office News Desk, Department for Education, Sanctuary Buildings, Great Smith Street, London SW1P 3BT. 020 7783 8300
If non-media Department for Education, Education Standards Directorate, Level
5, 2 St Paul’s Place, 125 Norfolk St, Sheffield S1 2FJ. Tel: 0114 2742317.
SFR 18/2014: Participation in Education, Training and Employment by 16-18 year olds in England, end 2013, issued 25 June 2014
© Crown copyright 2015
You may re-use this information (excluding logos) free of charge in any format or medium, under the terms of the Open Government Licence. To
view this licence, visit Open Government Licence or e-mail:
psi@nationalarchives.gsi.gov.uk.
Where we have identified any third party copyright information you will need to obtain permission from the copyright holders concerned.
Any enquiries regarding this publication should be sent to us at: Press Office Desk, Department for Education, Sanctuary Buildings, Great Smith Street, London SW1P 3BT