ENERGY SCAVENGING USING
PIEZOELECTRIC MATERIALS
A thesis presented in partial fulfillment of the
requirements for the degree of
Master of Engineering
.
In
Mechatronics
at
Massey University,
Palmerston North, New Zealand
Huangbo Liang
Abstract
Abstract
In recent years, wireless devices have been developing rapidly for various uses that run on batteries. However, when the devices are made smaller and the networks increase in number, it is not practical to replace the depleted batteries, such as in areas difficult to access. Alternative method is to scavenge power available in the environment where the wireless device is placed.
This thesis is focused on scavengmg power via vibrations as a power source. According to the literature piezoelectric material is the best choice to convert mechanical forces into electric field. Piezoelectric generator devices have been modelled and analyzed.
A case study of power generator for use in traffic monitoring sensors is assumed. The thesis describes such a piezoelectric power generator. developed based on a cantilever beam and using modelling techniques available in literature. The design is optimized by Sequential Quadratic Programming method. A prototype of the generator is built and tested extensively. The generated power is stored in a specially built circuit.
The experiments show that the prototype piezoelectric power generator can provide 0.091 in a simulated traffic scenario. Also the generated energy can be stored in the electric circuit which gives a stable 5 V DC output. It is noted that piezoelectric material is very brittle and was cracked during the experiment. As a consequence, the most of the experiment were conducted with a slightly modified generator.
In conclusion this thesis research has developed successfully both mathematical and a physical model of the piezoelectric power generator for wireless traffic monitoring sensors. Further work will still be in order in improving the current design.
-Acknowledgements
ACKNOWLEDGEMENTS
I wish to express my deepest appreciation and gratitude to my supervisor. Professor Peter Xu, for his supervision, guidance and patience during the course of this project and for helping to solve the problems that have arisen throughout. I would also wish to extend my appreciation to my co-supervisors, Dr Xiang Gui, for his support and invaluable help. I am grateful for all the effort and encouragement provided.
For Mr Bruce Collins of the Electronics Workshop. I would like to thank for his technical assistance, particularly during the circuit design.
And I wish to extend my gratitude to the staff of the mechanical workshop of the !TE. Massey University, Palmerston orth. for their assistance.
Finally, I would like to express my special thanks to my mother, father and my wife, Baowei Chen, for their love, encouragement, patience and invaluable help and to my mother in law, Lifang Chen, for looking after my little son well.
-Contents
Contents
I
. l
ntroducti
o
n ..
.
..
..
.
..
...
...
..
...
.
.
.
.
....
...
...
...
.
..
.
..
..
...
.
...
...
1
2. Lit
e
r
a
tur
e
r
ev
i
ew
...
..
....
.
...
.
..
.
.
.
...
.
.
.
....
.
...
.
...
.
.
.
.
...
.
.
.
.
...
.
...
.
.
.
.
.
.
3
2.1. Introduction ... 3
2.2. Wireless medical sensor system ... 4
2.2.1. I'acen1aker ................................ 4
2.2.2. Electrocardiogram (ECG) ... 4
2. 2. 3. Pulse oxymeter ...... 5
2.2 . ./. Blood glucose monitor ............................... 5
2.3. Power sources for wireless sensor networks ... 6
2.3. I. Introduction ............................................... 6
2. 3. 2. Poil'er consumption ................................... 6
2.3.3. Comparison of energy scm·enging technologies .............. 7
2.4. Conclusion ... 14
3
.
Mo
d
e
lin
g and a
n
a
lys
i
s o
f
p
i
ezoe
l
ec
tri
c ge
n
e
r
a
t
or
...
..
.
.
.
.
.
...
1
5
3.1. lntroduction ... 15 3.2. Fundamentals of piezoelectric converter ... 173.3. Material selection ... 19 3.4. Mathematical modelling ... 22
3.-1. I. l'ihration-to-electricity conversion model ...... 22
3../.2. Modeling pie::oelectric elements ....... 24
3.5. Analysis of model for piezoelectric power generator ... 30
3.6. Simulation of initial model ... 32
3.7. Conclusion ... 36
4
.
Case St
u
dy
:
Powe
r
ge
n
e
r
a
t
o
r for u
se
in
w
ir
e
l
ess tra
ffic m
o
nit
o
rin
g
se
n
so
r
s ....
..
...
.
.
.
..
.
.
.
..
.
...
..
.
.
.
.
..
.
...
.
...
.
..
..
...
...
.
.
.
..
..
....
.
...
.
.
..
..
.
....
.
....
..
....
..
.
3
8
4.1. Introduction ... 384.2. SQP implementation ... 41
-1.2. I. Updating the Hessian matrix ...... .42
-1.2.2. Quadratic programming solution ...... .43 4.2.3. Line search and merit.function .... .47
-Contents
4.3.1. Cantilever heam vibration mode ... 48
-/..3.2. Bending n?ode ... 58
-1.3.3. Mounted hender mode ... 59
4.4. Conclusion ... 61
5. Circuit design for power storage ... 62
5.1. Introduction ... 62
5 .2. Circuit design ... 62
5.3. Conclusion ... 64
6. Experimental studies of prototyped power generator ... 66
6.1. Experimental setup ... 66
6.2. Experimental plan and procedure ... 69
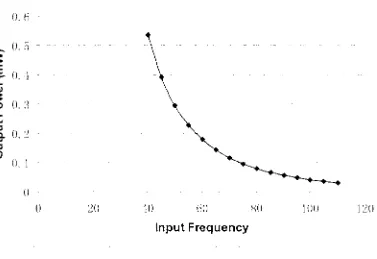
6. 2.1. Output peak voltage 1·s. input frequency ... 69
6. 2. 2. Load resistance rs. outpll! power ... 70
6.2.3. lvfechanical damping ratio measurement ... 70
6.2.-1. Output power 1·s. input.fi'equency ... 71
6.2.5. Input acceleration amplitude 1·s. power output ... 71
6.2.6. Experiments on circuit hoard ... 71
6.3. Experimental results and analysis ... 72
6.3.1. Output peak rnltage rs. input.fi'equenq ... 75
6.3.2. Load resistance 1·s. outplll power ... 76
6.3.3. 1ifeclwnica! damping ratio measurement ... 77
6. 3.-1. Output power 1·s. input.fi'equency ... 78
6.3.5. Input acceleration amplitude rs. power output ... 79
6. 3. 6. Experiments on circuit hoard ... 80
7. Conclusions and recommendation ... 89
7.1. Conclusions ... 89
7.2. Recommendation ... 90
8. References ... 91
APPEND IX ... 95
-Introduction
1.
Introduction
With the recent advances in wireless and Micro-electro-mechanical-systems (MEMS) technology, the requirement for portable wireless sensors and electronics is growing
rapidly. A significant engineering problem that needs to deal with is the supply power for the applications such as medical implants and structural monitoring. The power supply of the applications makes use of the conventional batteries in most cases, however, problems can happen because of their finite lifespan. In some cases, replacing the battery of portable electronics is problematic because the electronics could die at any time. For the wireless sensors application, the sensors can be placed in very remote locations such as structural sensors on a bridge or global positioning system (GPS) tracking devices on animals in the wild. When the battery of all its power goes flat, the sensor must be got back and the battery be replaced. Because these devices are placed in remote locations, only acquiring the sensors and replacing the batteries can become a very expensive task or even impossible. For some civil infrastructure applications the sensors are often expected to be embedded, replacing battery is unfeasible. As an alternative, scavenging energy from the surrounding medium seems very attractive, and then it could be used to replace or charge the battery. One method is to use piezoelectric materials to convert mechanical forces into an electric energy in response to the application of mechanical stresses. This scavenged energy could be used to extend the life of the power supply or in the ideal case provide endless energy for electronic devices lifespan.
The aim of this thesis research was to use piezoelectric material to design and build such a power supply device based on the principle of piezoelectric converter, as proposed by Roundy et al [ 1]. Then the model of piezoelectric generator was optimized for a wireless magnetic sensor node assumed as the power consumer. This work was carried out with the following objectives:
• Modelling and analysis of piezoelectric generator. A general model is formulated for the conversion of the kinetic energy of a vibrating mass to electrical power.
• Design optimization for wireless sensor node. A case study of energy scavenging for traffic surveillance is performed and a prototype is
-Introduction
designed and optimized for the wireless traffic sensor node.
• Circuit design for power storage. Once the piezoelectric device generated electric power by vibration the circuit is then designed as an energy buffer between the input from the piezoelectric generator and the output to the sensor node.
• Experimentation of the optimized prototype generator. A prototype converter is designed and built based on the optimizations. The test results would be presented.
The rest of the thesis is organized as follows. In Chapter Two, literature review is detailed. It focuses on the wireless medical sensor systems and enumerates available power sources for wireless sensor network. In Chapter Three, a brief review of the modelling piezoelectric generator is given first. Then based on the research deduction of Roundy et al [ 1] a piezoelectric generator is modelled mathematically and simulated for analysis. In Chapter Four, a case study of a wireless magnetic sensor powered by piezoelectric generator is analyzed and the design is optimized in Matlab. In Chapter Five, a circuit for power storage is designed. It is a classical AC-DC converter. In Chapter Six, according to the designed and optimized converter in previous chapter, experiments are conducted and the results analyzed. In Chapter Seven, the conclusions and recommendation are given.
-Literature review
2. Literature review
2.1. Introduction
Medical monitoring applications have continually developed for decades in healthcare industry. These platforms come with constraints. for example. they may be closed-source platforms or provide service only in limited locations. To achieve a ubiquitous computing environment where patients can be monitored anywhere in the world through wearable sensors and network infrastructures. people have envisioned a wearable sensor system. flexible in its customized configuration to suit unique attributes of each patient. Such a system is able to monitor regular vital signals and generate reports periodically to a server in a medical centre. Physicians in turn are able to query these real-time reports or historical data through medical service networks to provide adequate and correct treatment accordingly. It is also made possible to identify abnormal signals and send out emergency alerts directly. Some emergency situations require instantaneous treatments. Such situations arc identified by devices carried by (or implanted in) patients. and treatments are triggered automatically. The modelling of telemedicine is shown in Figure 2-1.
Panent at home
=
=
= =
-
.___
A
~
-...._______ ~1011itom1g sy>tem
[image:9.556.74.440.465.694.2]linl..
Figure 2-1: The modelling ofTelemedicine 121
3
Literature review
2.2. Wireless medical sensor system
2.2.1. Pacemaker
A pacemaker system consists of three components: a pulse generator and either one or
two electrode leads. Pacemakers with one lead are called 'single chamber pacemakers". Pacemakers with two leads are ·dual chamber pacemakers'. The pacemaker has two paits: the power supply. or batteries. and the electronic circuitry. It is completely covered in metal and sealed to prevent body fluids leaking into the unit. The whole pacemaker weighs only about 20-50g ( 1-2 ounces) and is smaller than a matchbox. Most pacemakers are powered by lithium batteries. Pacemakers last on average between six and ten years before they need to be replaced [2].
Patient's heart along some small wire leads to a box inserted in the front of a shoulder. From there the box will transmit data to a GSM cellphone. Data from the phone will
be beamed via satellite to the database centre before arnv111g on his/her doctor·s cellphone or computer.
2.2.2. Electrocardiogram (ECG)
Traditionally. electrodes with gel have been used. There are problems associated with contact electrodes for long-term ECG monitoring include the necessity to remove hair. the potential loss of contact to the test subject due to drying of application gel or to environmental factors (e.g., sweat) as well as test subject resistance to wearing the electrodes due to discomfort (e.g., skin irritation) [3].
Contemporary ECG system uses standard ECG electrodes which are attached to the LeadWear® System worn by the patient. There are two electronic components: the Patient Transceiver and the Monitor Transceiver. Their functions work as two-way radios that collect and transmit ECG and respiration data to existing bedside or transport ECG monitors. The Patient Transceiver, worn on the patient, communicates
with the Monitor Transceiver, placed on or near the ECG monitor. The transceivers are synchronized with a pairing token to establish a secure and robust radio link between the Patient Transceiver and the ECG monitor. The System has also received
-Literature review
approval from the Federal Communications Commission (FCC) to operate usmg public radio frequencies required for signal transmission [4].
There are 3 components to the system:
• A receiver unit that attaches to a regular monitor via the ECG leads • A patient unit that is placed on the arm typically.
• A disposable cable (to reduce risk of infection from bacteria that stay on the lead wires) with electrodes.
2.2.3. Pulse oxymeter
A pulse oxymeter combines spectrophotometry to measure hemoglobin concentration (light absorption is a function of the degree of oxygenation) and optical plethysmography to measure pulsatile changes in arterial blood volume and hence heart rate (pulsatile changes in light transmission through living tissue are due to alteration of the arterial blood volume in the tissue) f
3
l
The measurement is purely based on optical measurements. The sensor placed on a finger. an car lobe or the forehead has 2 LEDs emitting at 660 nm (red) and 950 nm (near infrared) and a photodetector: in the infrared. the absorption coefficient of oxyhemoglobin is greater than that of reduced hemoglobin. The electronics measure the ratio of pulsatilc to non pulsatilc light at red and infrared wavelength and translates this ratio to oxygen saturation [3].
The Bluetooth oxymeter can be used with either a finger or an ear probe. This will be evaluated whether it is necessary to incorporate an accelerometer in order to reduce motion artefacts as much as possible. If so, signal processing will need to be developed [3].
2.2.4. Blood glucose monitor
The blood glucose monitor provides wireless transmission of blood glucose readings to a central web-based database, allowing an accurate diary to be kept. This can be easily reviewed by the patient and his physician, with two way wireless messaging
-Literature review
providing insulin schedules, advice and reminders. Expert systems on the server
analyze the data and provide immediate feedback to the patient and his doctor. The
system facilitates better diabetes management, reducing the long term complications
of diabetes [5].
2.3. Power sources for wireless sensor networks
2.3.1. Introduction
Currently there are a lot of CMOS circuitries m small size and low power
consumption in the world. This leads to heaps of wireless sensors and communication nodes come up. Due to the decrease in size and cost of the wireless sensor, they
become widespread in automobiles, buildings, traffic infrastructure, etc. However, because of the prevalence of the wireless, effective power supplies become a larger
problem.
The issue is that the decrease in size and cost of CMOS electronics has far exceeded
the scaling of energy density in batteries, which are by far the most prevalent power
supply currently used. Therefore, the power supply is usually the largest and most
expensive component of the emerging wireless sensor nodes being proposed and
designed [6]. Moreover, another issue is that the battery power supply limits the
lifetime of sensor node. If wireless sensor networks are used widely, the work of
replacing batteries for each sensor node for one or two years is very huge and the cost
is much expensive.
2.3.2. Power consumption
There are a few low power consumption wireless products that are used commercially
and are being developed in the research community. The most common devices
currently in the market are based on the Bluetooth standard. A new, lower power, lower data rate standard IEEE 802.15.4 or Zigbee is currently under development.
The power needed to operate these specifications depends on how and where they are
used. Blue Tooth radios use around 40 - 60 mW. The Zigbee standard aims to cut this
-Literature review
power consumption by a factor of 3. The power consumption of other commercial and
academic platforms varies depending on their usage scenarios. Based on the
experiment, they generally operate at about I order of magnitude lower than BlueTooth which is in the range of 5 - 10 mW depending on the usage environment.
Entire power consumption in the specifications is approaching in the hundreds of
microwatts [7][8].
2.3.3. Comparison of energy scavenging technologies
There are a lot of infinite energy sources that can be scavenged from the variety of
energy sources in the node's environment, i.e.: motion and vibration, air flow, temperature differences, ambient electromagnetic fields, and light and infra-red radiation. Table 2-1 gives the results of a broad survey of potential power sources for wireless sensor nodes, both fixed energy sources such as power scavenging sources. The data are recorded from a combination of published studies, theory, and
[image:13.554.55.481.428.710.2]experiments carried out by the authors [8].
Table 2-1: Power scavenging sources
181
Secondary Storage
Power Source µW/cm3 Needed Voltage Regulation
Radioactive 0.52 Yes Yes
Solar( outside) 15000* Usually Maybe
Solar(inside) 10* Usually Maybe
Temperature 40*# Usually Maybe
Human
Power 330 Yes Yes
Air flow 380## Yes Yes
Vibrations 375 Yes Yes
*Denotes sources whose fundamental metric is power per square centimetre rather than power per cubic centimetre.
# Demonstrated from at a 5°C temperature differential.
##Assumes air velocity of 5m/s and 5% conversion efficiency.
###Based on a 1 cm3 closed volume of helium undergoing a I 0°C temperature change once per day.
-Literature review
The power sources in above table have a particular level of power generation.
Therefore, the lifetime is potentially infinite. All power values are generated by a normalized device size of 1 cm3.
A. Radioactive power sources
Radioactive materials generate radioactive waste, but contain extremely high energy densities. This energy has been used with hydrocarbon fuels on a much larger scale
for decades. However, it is not available to power wireless sensor networks because it
has not been exploited on a small scale. The radioactive waste can induce a serious
health hazard, and is a serious political and controversial issue. Therefore, it is not improved or forbidden the investigation into radioactive power sources. Here it is briefly presented their potential and the research being done in the area.
The total energy emitted by radioactive decay of a material can be expressed as [6].
(2.1)
where E1 is the total emitted energy, Ac is the activity. Ee is the average energy of
emitted particles. and T is the time period over which power is collected. Table 4 lists
several potential radioisotopes. their half-lives, activity volume density. and energy
densities based on radioactive decay. It should be noted that materials with lower
activities and higher half-lives will produce lower power levels for more time than
materials with comparatively short half-lives and high specific activities. The half-life
of the material has been used as the time over which power would be collected. Only
alpha and beta emitters have been included because of the heavy shielding needed for
gamma emitters. Finally, uranium 238 is included for purposes of comparison only
[6].
-Literature review
Table 2-2 Comparison of radio-isotopes f
6
1
Material Half-life Activity volume density Energy density
(years) (Ci/cm3) (J/cm3)
2Jsu 4.5 x 10⁹ 6.34 x 10"6 2.23 x 10¹⁰ 63
Ni 100.2 506 1.6 x 10⁸
32
Si 172.1 151 3.3 x I08
90Sr 28.8 350 3.7 x 10⁸
J2p 0.04 5.2 x 10s 2.7 x 10⁹
B. Solar Energy
Based on the research. at midday on a sunny day. the incident light on the earth·s surface has a power density of around I 00 m WI cm2. Single crystal silicon solar cells exhibit efficiencies of 15% - 20% under high light conditions. as one would find
outdoors. Common indoor lighting conditions have far lower power density than
outdoor light. Common office lighting provides about I 00 µ W/ cm2 at the surface of
a desk. Single crystal silicon solar cells are better suited to high light conditions and the spectrum of light available outdoors. Thin film amorphous silicon or cadmium telluride cells offer better efficiency indoors because their spectral response more closely matches that of artificial indoor light. Still, these thin film cells only offer about 10% efficiency. Therefore, the power is available from photovoltaic ranges from about 15m WI cm2 outdoors to 10 µ WI cm2 indoors. A single solar cell has an open circuit voltage of about 0.6 volts. Individual cells are easily placed in series,
especially in the case of thin film cells, to get almost any desired voltage needed. A current vs. voltage (I-V) curve for a typical five cell array (wired in series) is shown below in Figure 2-2. Unlike the voltage, current densities are directly dependent on the light intensity [6].
Literature review
1.6
1.4
1.2
1
<( 0.8
E
0.6
0.4
0 .2 0
0 0.5 1.5 2 2.5 3 3.5 volts
Figure 2-2: Typical 1-V curve from a five cell cadmium telluride solar array (61
C. Temperature gradients
Naturally energy can be scavenged from the environment which occurnng
temperature variations. Stordeur and Stark [9] have demonstrated a thermoelectric
micro-device capable of converting 15 µ W/ cm3 from a 10 ° C temperature gradient.
With the development of thermoelectrics, this could be improved to more than 15 µ
WI cm3. This device has a static 10 ° C temperature difference within I cm3 is very rare. Alternatively, the natural temperature variation over a 24 hour period might be
used to generate electricity. It can be assuming an average variation of 7 ° C, that an
enclosed volume containing an ideal gas could generate an average of I 0 µ WI cm3.
This, however, assumes no losses in the conversion of the power to electricity. In fact
some commercially available clocks, such as the Atmos clock, operate on a similar
principle. The Atmos clock includes a sealed volume of fluid that undergoes a phase
change right around 21 ° C. As the liquid turns to gas during a normal day's
temperature variation, the pressure increases the actuating spring that winds the clock.
While this is very interesting, the level of power output is still substantially lower than
other possible methods [9].
-Literature review
D. Passive Human power
A significant amount of work has been done on the possibility of scavenging power
off the human body for use by wearable electronic devices. The conclusion of studies
undertaken at MIT suggests that the most energy rich and most easily exploitable
source occurs at the foot during heel strike and in the bending of the ball of the foot
[1 OJ. This research reported that there will be an average of 330 µW/cm2 generated by
the piezoelectric shoe inserts while a person is walking. The available power density
from the piezoelectric shoe inserts seems suitable for the requirement of the case
study in Chapter 4. However. wearable computing and communication devices are not
the focus of this project. Moreover. this situation of how to get the energy from a
person· s foot to other places on the body has not been satisfactorily solved unti I now.
For an RflD tag or other wireless device worn on the shoe. the piezoelectric shoe
inserts offer a good solution. However. the application space for such devices is
extremely limited. and as mentioned that it is not very applicable to wireless sensor networks.
E. Active Human Power
The type of human powered systems investigated at MIT could be referred to as
passive human powered systems where the power is scavenged during common
activities rather than requiring the user to perform a specific activity to generate power [1]. Human powered systems of this second type. which require the user to
perform a specific power generating motion, are common and may be referred to
separately as active human powered systems. Examples include standard flashlights
that are powered by squeezing a lever. However active human powered devices arc
not very applicable for wireless sensor applications at the moment.
F. Wind I air flow
Wind power is quite common to be used as a power source today. The large windmills
can be found in many countries. However, there are only few applications
-Literature review
implemented on a small scale which is in a cubic centimetre, generated power from
air flow. The available power from wind flow can be easily calculated by [6].
1
-P =-pAu0 2
(2.2)
where P is the power, p is the density of air, A is the cross sectional area, and u is
the air velocity. Under standard atmospheric conditions, the atmospheric air density is
around 1.22 kg/m3. Figure 2-3 shows the power per square centimetre versus air
velocity.
100000
10000
1000
--u 100~
10 - - -I·. ax Power
--+---20 % E cieny - 5 % E' 1ciency
0.1
Q 2 4 6 8 10 12
[image:18.553.99.426.318.545.2]111/s
Figure 2-3 The power per square centimetre versus air velocity [6]
The large windmills have high efficiencies of about 40%. The efficiencies are
dependent on wind velocity, and average operating efficiencies are usually about
20%. Windmills are generally designed when maximum efficiency occurs at wind
velocities around 8 mis or about 18 mph. At low air velocity, efficiency can be
significantly lower than 20%. Figure 2-3 also shows power output assuming 20% and
5% efficiency in conversion. As can be seen from the graph, power densities from air
velocity are quite useful. As there are many possible applications in which a fairly
-literature review
constant air flow of a few meters per second exists, it seems that research leading to the development of devices to convert air flow to electrical power at small scales is warranted [6].
G. Vibrations
There are many current applications using low level mechanical vibrations as power
sources. Examples include HV AC vents. machine tool. note book computer. exterior windows. wood frame building. washing machine, small household appliances manufacturing and assembly equipment and automobiles. Table 2-3 shows results of measurements on several different vibrations sources. From the table. it can be found that the most peak frequencies of all sources are between 60 and 200 Hz. Acceleration
[image:19.554.56.481.388.673.2]amplitudes range from about 0.1 to 10 m/s2.
Table 2-3 Vibration sources
Vibartion Source Peak Acc. (m/s2) Freq. of Peak (Hz)
HVAC vents in office building 0.2-1.5 60 base of a HP 3-axis machine tool 10 70
Notebook computer while CD is being read 0.6 75 exterior windows in busy street 0.7 100 Second story floor of a wood frame office building 0.2 100
Washing machine 0.5 109
Kitchen blender casing 6.4 120
Clothes dryer 3.5 120
Small microwave oven 2.25 120
Bread maker 1.03 120
Door frame just after door closes 3 125
Refrigerator 0.1 240
Wooden deck with people walking 1.3 385
Literature review
2.4. Conclusion
Based on this survey, temperature variations could only offer the energy scavenging solutions for body wireless sensor networks. A product of Thermo Life Company can interchange heat energy to electrical energy through its thermopile couples using the thermopile principle. If two heat couple plates are connected with a heat source and a heat sink thermally, heat will be conve11ed into electrical energy directly when flowing through therrnopiles. Therefore, ifs necessary to seek wider solutions for
wireless sensor networks. In a word, solar energy and vibrations power were the best ways of supplying for wireless sensor nodes. Both solutions meet the power density
requirement in environments that are of interest for wireless sensor networks. The
target application of solar power (indoors and outdoors) has to scavenge the power
density of solar radiation from the sunshine or lighting. It is not applicable for sensor
nodes embedded under ground or hidden place. Therefore. the later chapters focus on
the research and development effort on vibration based power generators.
-Modelling and analysis of piezoelectric generator
3. Modeling and analysis of piezoelectric generator
3.1. Introduction
Piezoelectric materials can act as transducers that are able to convert electrical energy
to mechanical motion or force, vice versa. Therefore, these materials can be employed
to supply power for other devices by changing environmental motion into electrical energy that can be saved and used. Once the power generator absorbing energy is
working, the portable devices will not rely on the traditional power supplies, such as the batteries which have limited operational lifespan. "Analytical modeling is an
inevitable element in the design process to understand various interrelated parameters
and to optimize the key design parameters while studying and implementing such
power harvesting devices" [I 2].
A lot of studies, experiments and patents have been done and report that it is possible to use piezoelectric material devices as power sources. Umeda et al [13] were one of
the pioneers to transform mechanical impact energy to electrical power by using a free-falling ball to impact a plate with piezoceramic wafer attached to its underside
and developed an electrical equivalent model of the PZT. They also researched the power storage circuit and pointed out its characteristics of composition of the PZT, a
bridge rectifier and a capacitor. Starner [14] investigated that the energy can be
scavenged from leg motion of a human being and explores mechanical energy from human motion sources, such as blood pressure. The author indicates it is possible to generate around 8.4 watts from a shoe with a mounted PZT. Kymissis et al [ 15]
studied powering up a bulb mounted in a shoe by harvesting energy from walking
motion. Kimura's US Patent [16] places a PZT material on the vibration of a small
plate and generated a rectified voltage signal. This experiment shows that migratory birds embedded with PZT can provide enough power for a small mounted transmitter to send their code and location. The author also provides a comparison of the result of
the experiment and current existing battery technology. Goldfarb et al [17] introduced a linearized model of a PZT stack and analyzed the efficiency of it as a power
generation device. The authors claimed that the maximum efficiency is that the devices work in a low frequency source and exciting in fundamental resonance of the
stack. The efficiency has a strong relation with the amplitude of the input force due to
-Modelling and analysis of piezoelectric genera/or
hysteresis of the PZT. Clark and Ramsay [ 18] have found the transverse force (d31
mode) in addition to the force applied in the poling direction (d33 mode) and
compared them. The experiment presented that the d3 l mode has a better energy
conversion when applying pressure of working stress for power generation. They
concluded that the MEMS device can be powered up by a 1 cm3 piezoceramic wafer in
the microwatt range. Elvin et al [19] have done experiments and theoretically studied
on using polyvinylidene fluoride (PVDF) to provide power for the wireless sensors. In
order to monitor human bone strain, they applied half-rectified circuit combined with
wireless communication device. Kasyap et al [20] provided an equivalent circuit of
the system as a model to describe the power harvested from the input vibration of a
PZT patch attached. They have experimented and obtained a result of the peak power
efficiencies of about 20% when using a beam structure. Gonzalez et al [21] studied
the future of energy conversion using piezoelectric and provided several suggestions
to improve output power of the existing prototypes to the level that can be
theoretically obtained. Smits and Chio [22] utilized internal energy conservation
theory to describe the electromechanical characteristics of a heterogeneous
piezoelectric hender under various electrical and mechanical boundary conditions.
However. they did not provide any formulation for the power generation. Roundy et al
[I] described the PZT cantilever beam in a different way based on the electrical
equivalent circuit. which leads to fair matches with the experimental results.
Some of the above studies have had success in modeling the PZT cantilever beam for
voltage and power generation. A bimorph bender has the advantage that it can easily
be designed with lower stiffness so that higher strains can be generated with a given
force input. In this paper, special emphasis has been given to the optimization of
modeling of a bi morph PZT bender with a proof mass in the generator mode. Thus, a
new case study is assumed and has been optimized based on the equations Roundy et
al provided.
In the following sections of the chapter the various works on power harvesting are
broken into the following groups: fundamentals of piezoelectric converter, material
selection, mathematical modeling, analysis of model for piezoelectric generator and
conclusion. In section 3.2, the mechanical and electrical behavior of a piezoelectric is
modeled. In section 3.3, comparison of different material properties is discussed. In
-Modelling and analysis of piezoelectric generator
section 3.4, a mathematical modeling will be given based on Roundy et al research.
Section 3.5 will give the analysis of model for piezoelectric power generation and
discussed the relationships of output power and mechanical damping ratio, electrical
damping ratio, input frequency and load resistance. In section 3.6 will give the
summaries of the material selection and certain functional relationships.
3.2. Fundamentals of piezoelectric converter
Piezoelectric materials are materials that physically deform in the presence of an
electric field, or conversely, produce an electrical charge when mechanically
defonned. The constitutive equations for a piezoelectric material are given in Eq. (3.1)
and (3.2).
o
= a I Y + dE (3.1)D =EE + da (3.2)
Where D is mechanical strain, a is mechanical stress, Y is the modulus of elasticity
(Young's Modulus), dis the piezoelectric strain coefficient, Eis the electric field, Dis
the electrical displacement, E is the dielectric constant of the piezoelectric material.
Fin
t
~
T+P
J
v
w
[image:23.552.174.366.490.614.2]L
Figure 3-1 Illustration of 33 mode operation of piezoelectric material [23]
-Modelling and analysis of piezoelectric generator
Lilin
Vou1+L
Figure 3-2 Illustration of 31 mode operation of piezoelectric material 1231
Figure 3-1 and 3-2 illustrate the two different modes in which piezoelectric material is
generally used. Typically, piezoelectric material is used in the d33 mode, meaning
that longitudinal generator is compressed from the top and bottom. However, the
material can also be operated in the d3 I mode, meaning that transverse generator is
compressed from the sides. Piezoelectric d3 I mode sensors and actuators have a
cantilever beam structure that consists of a membrane film, bottom electrode,
piezoelectric film, and top electrode. The d3 I mode devices require many mask steps
(3- 5 masks) for patterning of each layer while have very low induced voltage. A
generated open circuit voltage (V) can be induced between the electrodes through an
applied, external stress (F) and is expressed by [23).
(3.3)
where g31 (unit is V·rn/ ) is the transverse piezoelectric coefficient and JV is the width
of the PZT thin film.
In the d33 mode a generated open circuit voltage (V) can be induced by external stress
(F) due to the longitudinal, piezoelectric coefficient a demonstrated in Eq. (3.4).
(3.4)
where Tis the thickness of the PZT film and L is the length of the cantilever beam.
The magnitude of the g33 is 2 to 2.5 times larger than its g3 J counterpart.
-Modelling and analysis of piezoelectric generator
Although the electrical/mechanical coupling for the d31 mode is lower than for the
d33 mode, there is a key advantage to operating in the d3 l mode. The system is much
more compliant, therefore larger strains can be produced with smaller input forces.
Also, the resonant frequency is much lower. An immense mass would be required in
order to design a piezoelectric converter operating in the d33 mode with a resonant
frequency somewhere around 25 Hz. Therefore. the use of bending elements operating
in d31 mode is essential in this case.
3.3. Material selection
Piezoelectric materials create electrical charge when mechanically stressed. Among
the natural materials with this property are quartz. human skin, and human bone,
though the latter two have very low coupling efficiencies. Table 3-1 shows properties
of common industrial piezoelectric materials: lead zirconate titanate (PZT), PVDF and
lead zinc niobate-lead titanate (PZN-PT).
Table 3-1 Comparison of piezoelectric materials
161
Property Units PZT PVDF
PZN-PT
Strain coefficient (d31) 10·12m/v 320 20 950
Strain coefficient (d33) I 0·12m/v 650 30 2000
Coupling coefficient (k31) CV/Nm 0.44 0.11 0.5
Coupling coefficient (k33) CV/Nm 0.75 0.16 0.91
Dielectric constant £1£o 3800 12 4500
Elastic modulus 1010N/m2 5 0.3 0.83
Tensile strength I 07/m2 2 5.2 8.3
The piezoelectric strain coefficient (d) relates strain to electric field. The coupling
coefficient (k) is an indication of the material's ability to convert mechanical energy
to electrical energy or vice versa. It is functionally related to the strain coefficient by
(3.5)
-Modelling and analysis of piezoelectric generator
It is clearly seen that materials with larger strain and coupling coefficients have a
higher potential for energy conversion. The most efficient energy conversion, as
indicated by the coupling constants in Table 3-1, comes from compressing d33 mode.
Two other material properties in equation 3.5 are also important. They are the
dielectric constant ( £ ) and the elastic, or Young's, modulus (Y). A higher dielectric
constant is generally preferable because it lowers the source impedance of the
generator, and piezoelectric materials often have high impedance resulting in higher
voltage and lower current output. The elastic modulus primarily affects the stiffness of
the bender. Generally, the other material properties are more important for power
conversion, and the system can be designed around the stiffness. Finally, the tensile
strength of the material is very important. In certain cases. the design will be limited
by the maximum strain that a bender can withstand. In these cases, a material with a
higher tensile strength would be preferable.
PZT (Lead Zirconate Titanate) is probably the most commonly used piezoelectric
material at current time because of its good piezoelectric properties. PVDF
(Polyvinylidene Difluoride) is a piezoelectric polymer that is attractive for some
applications because of its higher tensile strength and lower stiffness. Commercial
applications of piezoelectric devices abound. for instance in speakers, spark
generators inside electronic igniters. strain sensors pressure gages and as presice
time-keepers in electronic clocks. A few types of basic piezoelectric devices include
crystals, tubes, unimorphs, bimorphs and stacks.
Piezoelectric crystals involve a non-uniform charge distribution within the unit cell of
the crystal. When exposed to an electric field, this charge distribution shifts and the
crystal will change its shape. The same polarization mechanism can cause a voltage to
develop across the crystal in response to mechanical force.
Piezoelectric tubes benefit to control an object in space [24]. By sectioning the surface
of a tube into four regions and connecting them, as well as one end of the tube to
electrodes, it becomes possible to apply voltages to the tube in various directions. By
applying voltages perpendicular to the tubes cross-section, it becomes possible to
control the position of one end of the tube in two dimensions (x and y), while
-Modelling and analysis of piezoelectric generator
applying a voltage along the length of the tube, it becomes possible to control the
position in the third dimension (z).
It is very small that the force and displacement created by a pure piezoelectric
material so that methods have been developed to allow amplification of the
piezoelectric effect. A uni morph is to apply a thin layer of a piezoelectric material to
a layer of inactive material. When the piezo expands or contracts. the device will then
bend in response.
By combining more than one p1ezo, it becomes possible to further increase the
amount of transduction. For instance, an elongating, bending or twisting device can be
created by placing two layers of piezoelectric material on top of one-another. and by
controlling the polarization direction and the voltages such that when one layer
contracts, the other will expand. Such a device is known as a bimorph.
By stacking of piezo materials into layers, it becomes possible to combine their
displacement to create what is known as a piezo stack. Such devices are capable of
higher displacements and larger forces [23].
PZN-PT (Lead Zinc Niobate - Lead Titanate) is a single crystal piezoelectric material
much likes PZT. It has excellent properties, however, it has just become available
commercially. It is very expensive and only very small crystals that can currently be
produced. Based on this comparison of piezoelectric materials. PZT has been chosen
as the primary material for further development and bimorph structure is used for
simulation, prototyping and testing. In this case, the metal centre shim adds strength
to the bender and makes it much easier to cut and solder because of the brittleness of
the piezoelectric ceramic. Table 3-2 shows the properties of PZT purchased from
Piezo Systems Company.
-Modelling and analysis of piezoelectric generator
Table 3-2 Properties of PZT purchased
PZT PROPERTY
VALUE
Size 72.4mm x72.4mm
Thickness 0.267mm
Capacitance 610 nF
Dielectric Constant (£1£0) 3800
Strain coefficient (d33) 650x 10-12 meters/volt
Strain coefficient (d31) 320x 10-12 meters/volt
Piezoelectric Strain density Coefficient
J 9x 10⁻³ volts/Newton meter (g33)
Piezoelectric Strain density Coefficient
9.5x 10⁻³ volts/Newton meter (g31)
Coupling coefficient(k33) 0.75
Coup I ing coefficient(k31) 0.44
Elastic or Young's modulus (Y3) 5x10¹⁰ Newtons/meter2
Elastic or Young's modulus (Y 1) 6.2x10¹⁰ Newtons/meter2
3.4. Mathematical modelling
3.4.1. Vibratio11-to-e/ectricity con version model
A general model for the conversion of the kinetic energy of a vibration with mass to
electricity based on the schematic in Figure 3-3 has been proposed by Williams and
Yates [11]. This model is described by equation 3.6.
-Modelling and analysis of piezoelectric generator
;;>
k~
/.( l)--
-
"
.
hl'
hm
..£...
' t)Figure 3-3 Schematic of generic vibration converter [1]
p
=
nu;,,A14w(c;,, + c;11,)1
(3.6)
Where P is the power output. m is the vibration proof mass. A is the acceleration
magnitude of the input vibrations, w is the frequency of the driving vibrations, c;,,, is
the mechanical damping ratio, and .;,, is an electrically induced damping ratio. In Eq.
(3.6). the maximum power output occurs when the frequency of the driving vibrations
matches the fundamental frequency of the vibrating device. ormally the equation is
the simple way to roughly estimate the available power output from a vibration
source. It is obvious that there are three interesting relationships that are shown
below.
• The output power is directly proportional to the vibration proof mass.
• The output power is directly proportional to the square of the acceleration
amplitude of the driving vibrations.
• The power output is inversely proportional to input frequency.
The three relationships demonstrate that the device should be designed with heavy
mass and placed into a place with low frequency from a vibration source which has a
higher acceleration magnitude. Roundy et al have done many measurements on
spectra and indicated that in general the lowest frequency peak has the highest
acceleration magnitude [1].
[image:29.553.189.331.60.213.2]-Modelling and analysis of piezoelectric generator
3.4.2. Modeling piezoelectric elements
Before modelling piezoelectric elements the geometric terms for bimorph mounted as
a cantilever shown in Figure 3-3, it is necessary to provide the details of the derivation
of the analytical model for a piezoelectric vibration-to-electricity converter. The
piezoelectric bender is a composite beam so that effective moments of ine11ial and
elastic modulus are used. The effective moment of inertia is given by [ 1].
(3.7)
(3.8)
where w is the width of the beam, tc is the thickness of an individual piezoelectric
ceramic layer, b is the distance from the centre shim to the centre of the piezo layers,
t511 is the thickness of the centre shim, and Y is Young's modulus for the piezoelectric
ceramic and Y511 is Young·s modulus for the centre shim.
t
+
...
...
~~
... 1-==
--I+
...
-
-
-
..... \
Figure 3.4 Schematic of piezoelectric bender
The moment in the beam as a function of the distance x from its base, M, is given by
equation 3.9.
M
=
m
(y
+
z
XL
h
+
0.51,,,-
x
)
(3.9)where Im is the length of the mass, Y is the input vibration in terms of acceleration, lb
is the length of the cantilever beam and
z
is the vertical acceleration of the beam atthe point where the mass attaches with respect to the base of the beam.
-Modelling and analysis of pie:;;;oelectric generator
The stress and strain values of interest, and those used as state variables are the
average of the stress and strain in the piezoelectric material that is covered by an
electrode. An expression for the average of the stress in the piezoelectric material
covered by the electrode is given by.
( .... )· b(2!h +!111 - ( )
my+z
-21
( 3 .10)
Therefore. b · is defined below.
(3 .11)
In addition. applying Euler beam yields.
c/2 z
Af(x)
(3.12)dx' YI
At the point v,here the beam meets the mass integrating to obtain an expression for the
deflection term (z) yields:
_ =
m(y+::)/
1
~
·(3-i
+ l 1 ) 2YI 3 h 2 111(3.13)
Finally. realizing that strain is equal to stress over the elastic constant. c'i a I Y. and that stress can be expressed as in equation 3 .10. strain can be written as shown below:
6
=
m(y
+
i )b · (21 + l - l ) 2YI h ti/ "(3.14)
Substituting Eq. (3.13) into equation 3.12 yields:
6 3h(2lh +!111
-!J
(3 .15)
z
1; (21+1.51)
Defining h * = JI
z ,
so the equation was written as below:-b'
=
3b(2lh +/Ill-!J
1
}
(
2
1
+
1.
51
)
Modelling and analysis of piezoelectric generator
(3 .16)
A convenient method of modelling piezoelectric elements is to model both the
mechanical and electrical portions of the piezoelectric system as circuit elements. The
equivalent circuit of piezoelectric material is modelled by the equivalent circuit
parameters derived from the complex materials coefficients which are connected to
real and imaginary parts of the complex materials coefficients of the piezoelectric
device. The equivalent circuit parameters are measured in temperature and stress
experiments. J\s a result. the piezoelectric coupling is then modelled as a transformer
and the mass attached to the end of the cantilever beam is shown as an inductor l24].
Figure 3-5 shows the circuit model of the piezoelectric element
l )
mechanical electrical
Figure 3-5 Circuit model of the piezoelectric element
The across variable on the electrical side is voltage (V) and the through variables
current (I). The across variable on the mechanical side is stress (G) and the through
variable is strain (o). The system equations can then be obtained by simply applying
Kirchoff's Voltage Law and Kirchoffs Current Law. However, first the stress I strain
relationships for circuit elements on the mechanical side need to be defined.
Gin is an equivalent input stress. In other words, it is the stress developed as a result of
the input vibrations. m, shown as an inductor, represents the effect of the mass, or
inertial term. The stress "across'· this element is the stress developed as a result of the
mass flexing the beam. Thus, the relationships for the input element, Gin, and the
inertial element, m, are given as follows,
-m ..
(]" - y
111 b'
(]" Ill
m .. - S
b*b'
Modelling and analysis of piezoelectric generator
(3.17)
(3 .18)
where Y is the input vibration in terms of acceleration.
The resistive element in Figure 3-5 represents damping, or mechanical loss. The
damping coefficient, b111, relates stress to tip displacement, z. The stress relationship
for the damping element, b111, becomes:
blll S:
a hm
=
-
•
.
ub
(3.19)
Ce is the capacitance of the bimorph. The vibration input is shown as a stress
generator (0"111 ) , which comes from the input acceleration A111• The relationship between
the input vibrations and an equivalent stress input is:
111
<J",,,
=
b.
A,,, (3.20)The transformer relates stress ( cr) to electric field (E) at zero strain, or electrical
displacement (0) to strain (8) at zero electric field. So the equations for the
transformer are:
CT = -YdE
(3.21)
D
=
-dY8 (3.22)The equivalent ratio (n*) for the transformer is dY. Note that voltage V = 2Etc,
Q
=lewD. Then the equations for the transformer can be rewritten as:
-dY <J" = -- ·V
I 2f C
(3.23)
Q
=
-dYlewS(3.24)
-Modelling and analysis of piezoelectric generator
Applying Kirchoffs Voltage Law to the circuit in Figure 3-5 yields the following
equation:
er,"
=
erlll+
er h111+ er
, (3.25)Substituting Eq. (3.17), (3 .18), (3.19), and (3 .23) and rearranging terms yields the
third order equation shown as 3.26, which describes the mechanical dynamics of the
system with an electrical coupling term.
£ _ Yb* b' ~ b111b' S: dY b 'b' V b' ..
u - - - - u - - - u + - - - + y
m m 2/c m
The capacitance of the piezoelectric bender can be computed in Eq. (3.27).
r:Lw
C=
-T
(3.26)
(3.27)
where L is the length of the bender, w is the width of the bender, Tis the thickness of
the bender, r is the static permittivity of PZT. Note that C = Q, substituting the Eq.
v
(3.24) and rearranging terms yields Eq. (3.28).
. -2dYt .
v
=
c.
5
f; (3.28)
Figure 3-5 is an open circuit, so there is no power is transferred. It is necessary to
consider there is a resistor is used as the load. This results in the circuit model shown
in Figure 3-6.
Figure 3-6 Circuit model of the piezoelectric element
-Modelling and analysis of pie:oelectric generator
Therefore, according to Kirchoffs Voltage Law and Kirchoff's Current Law, the
equivalent electrically induced damping ratio is given by the expression,
(3.29)
where k is the piezoelectric coupling coefficient, R 1s the load resistor. C 1s the
capacitance of the piezoelectric bender.
Applying Kirchoff s Current Law to the electrical side of the circuit now yields the
following equation, which replaces Eq. (3.28) in the system model.
. 2Ydt I
JI =- - -' o - - V (3.30)
c:
RCTaking the Laplace transform of equation 3.30 and rearrang111g terms yields the
following expression:
6.
=
_ _
c:
_
(
s
+ - '- ) · V2Ydts RC
(3.31)
where 6. is Laplace transform of strain ( o) ands is the Laplace variable.
Taking the Laplace transform of Eq. (3.26) and rearranging terms yields:
A(
.
2 h111b' . Yb'b'J=Yb'b'd.a 11 b'AL.l
s
+
.s+
+
Illm m 2mt, (3.32)
Substituting Eq. (3.31) into (3.32) then the output voltage can be solved in following
expression:
V{
3 (
I
b111b') 2[Yb
'
b'(l
d2
YJ b111b'] Yb'b'}- 2Ydtb'
s
+
- + - -
s+
- -
+ - -
+
- -
s + - -
-
-
A111RC
m
m
c:
mRC
mRC
ac:
(3.33)Note that d2 YI c: is the square of a te1m commonly referred to as the piezoelectric
coupling coefficient denoted by the symbol k, the Laplace variable may be substituted
Modelling and analysis of piezoelectric generator
with jw where j is the imaginary number, Yb' b' Im is the natural frequency of the
system represented by the symbol w11, and the damping term b,,,b' Im can be rewritten
in terms of the damping ratio
s
as 2t;w11
• The new expression is given in Eq. (3.34) .. 2Ydt,b'
- . 1 w
-V = I 1 ( I ) 1
.at:[
2 2 2(w11 2J
A 111- w
11 --+2t;cv
11w
+
;w w
11 (I+k ) +
-
-
-w
RC RC . RC
(3.34)
By proper selection of the load resistance (R).
s
,,
will be equal to the mechanicaldamping ratio
c:;
,,,
.
In addition. if it is assumed that the frequency of the inputvibrations (co) is equal to the undamped natural of the device (co11 ) . the analytical
expression for power transferred to the load is given in Eq. (3.35) [I].
I' =V1 = - - · RC2(Y,d1,h')2 A2 2R
(wt:)
1(4;
1+e)(
RC
cv)1 +4t;k2(
RCr
v
)
+2L;
1 111 (3.35)\.vhere tc is thickness of one piezoelectric layer. b* is the geometric constant relating
average strain to displacement at the beam·s end. A111 is the acceleration magnitude of
input vibrations.
3.5. Analysis of model for piezoelectric power generator
Once the expression for output power of the piezoelectric generator is speci tied. the
relationship between the output power and variables are analytical. The variables of
the initial prototype and model are shown in Table 3-3.
Table 3-3 Variables of initial model
Variables Description
I
m
Length of the masshm Height of the mass
Wm Width of the mass
-Modelling and analysis of piezoelectric generator
lb Length of the cantilever beam
Wb Width of the cantilever haem
le Length of the electrode on the beam surface
tp Thickness of one piezoelectric layer
tsh Thickness of the center shim
RL Load resistance
This cantilever mechanically resonates at a natural frequency, just like anything that
vibrates has a natural frequency. The piezoelectric bender mounted as a cantilever
beam as shown in Figure 3-7.
Figure 3-7 Cantilever beam with piezoelectric material
le is not shown in the figure and is always equal to or less than the length of the beam.
The beam consists of a centre shim and two layers of piezoelectric material. Each
layer is assumed to be homogeneous. The metal centre shim makes the bender more
reliable due to the brittleness of the piezoelectric ceramic. The natural frequency of
the cantilever beam can be computed using the formulas developed for homogeneous
beams given below,
F = -1
·J
3YJ natural27[ ML3
(3.35)
-Modelling and analysis of pie::.oelectric generator
where I is the area moment of inertia of beam. L is the span of beam. M is mass and Y
is Young ·s modulus. It is assumed that the frequency of the driving vibration is
exactly equal to the natural frequency of the cantilever. Then. Eq. (3.35) can give the
output power for the power conversion.
It is not obvious to find the relationship between the proof mass and the output power
Eq. (3.35). However. geometric strain constant b* is the middle character interacting
the result from the expression. The geometric strain constant is given by Eq. (3.16).
Actually the output power is proportional to the proof mass. Jn order to maintain the
same resonant frequency. if the mass increases. either the thickness or the width of the
beam must increase as \:veil. If the thickness increases. le. b and b* will increase.
resulting in a higher output power. If the width increases. the capacitance of the
piezoelectric bender C will go up. getting a higher output power as well.
It is assumed that the total volume of the bi morph and mass is approximately I cm3.
According to the Table 2-2. in order to simulate a vibration source related to
street/road environment for further study. a windO\\ close to busy street was assumed
as the vibration sources. so the peak frequency of I 00 I lz and peak acceleration of 0.7
m/s2 \\·ere applied for all the simulations.
3.6. Simulation of initial model
It is obvious that the power output is inversely proportional to the mechanical
damping ratio. This follows from Eq. (3.35). It should be noted that if the equivalent
electrically induced damping ratio ( , is equal to the mechanical damping
c;
,,,
in thesystem. maximum output power will occur. Figure 3-8 shows the simulated power
output vs. the mechanical damping ratio .
-Modelling and analysis of pie=oe/ectric generator
Output Power Vs Mechanical Damping Ratio
0.18
-0.16 - -- - -
-§'
0.14 - -----E
';:' 0.12
~
0.1-·--
---"'
~---0 Q..
0.08 - · - - - ----
-0.02 -·---=~~,,..__.._..~:::+::~
-0 - - -
-0 0.01 0.02 0.03 0.04 0.05
Mechanical Damping Ratio
Figure 3-8 Output power versus mechanical damping ratio
The term ; ,. represents an electrically induced damping coefficient. It is generally a
function of circuit parameters. The output power is maximized when (,. and (111 are
equal, and they are as low as possible. Figure 3-9 shows that ( . is equal to (111
around 0.02 and the output power is 40.8µW.
[image:39.549.55.473.62.375.2]

![Figure 2-3 The power per square centimetre versus air velocity [6]](https://thumb-us.123doks.com/thumbv2/123dok_us/8399471.325318/18.553.99.426.318.545/figure-power-square-centimetre-versus-air-velocity.webp)

![Figure 3-1 Illustration of 33 mode operation of piezoelectric material [23]](https://thumb-us.123doks.com/thumbv2/123dok_us/8399471.325318/23.552.174.366.490.614/figure-illustration-mode-operation-piezoelectric-material.webp)

![Figure 3-3 Schematic of generic vibration converter [1]](https://thumb-us.123doks.com/thumbv2/123dok_us/8399471.325318/29.553.189.331.60.213/figure-schematic-of-generic-vibration-converter.webp)