The effects of defoliation on tissue turnover and pasture production in perennial ryegrass, prairie grass and smooth bromegrass pasture : a thesis presented in partial fulfilment of the requriements [i e requirements] for the degree of Doctor of Philosop
194
0
0
Full text
(2) THE EFFECTS OF DEFOLIATION ON TISSUE TURNOVER AND PASTURE PRODUCTION IN PERENNIAL RYEGRASS, PRAIRIE GRASS AND SMOOTH BROMEGRASS PASTURE.. A THESIS PR ES ENTED I N PAR TI AL F ULFI LMENT OF THE R EQ URI EMENTS F OR THE DEGREE OF DOCTOR OF PHI LOS OPHY AT MASS EY UNIVERS ITY.. JingXin Xia. 1991.
(3) ABSTRACT. This thesis reports the results of three experiments, one with perennial ryegrass (Lolium perenne L.) cv. Ellett under rotational sheep grazing, one with prairie grass (Bromus willdenowii Kunth.) cv. Grasslands Matua under rotional dairy cow grazing, and one with smooth bromegrass (Bromus inermis Leyss) under cutting management. The first two experiments were carried out at Massey University, New Zealand, the third at Beijing Agicultural University, China. Each experiment involved management variations set within a range considered to be appropriate to the species under examination, and was complete in itself. The objective of the study reported here was to examine the sensitivity to defoliation of the three grass species, sensitivity being defined principally in terms of adjustment in tiller population density and tissue turnover to variations in defoliation treatment. The results are reported separately, but are drawn together for comparative purposes in an integrating discussion.. Flexibility in response to defoliation, measured in terms of the number of live leaves per tiller, the rate of leaf appearance, dry weight per tiller, and tiller population density, differed substantially in perennial ryegrass, prairie grass, and smooth bromegrass, and had a major influence on the sensitivity of the species to contrasting managements.. Net herbage production was relatively insensitive to hard (2.5cm, post grazing lOOOkgDM/ha) and lax grazing (15cm, post grazing 2000kgDM/ha) in perennial ryegrass pasture because of rapid adaptive change in tiller population density, which was usually greater under hard grazing than under lax grazing, and compensating changes in rates of herbage growth and senescence.. Net herbage production of prairie grass was greater under lax (12cm, post grazing.
(4) ii. 2500-3500kgDM/ha) than under hard (6cm, post grazing 1500-2000kgDM/ha) grazing, associated with reduction in tiller population density under the latter treatment, and a greater reduction in herbage growth than in senescence per tiller.. In. smooth bromegrass, tiller populations were greater under lax (30 cm) than under. hard (10 cm) cutting, though the closer cutting treatment resulted in greater green herbage accumulation, because of a greater reduction in the rate of herbage senescence than in the rate of herbage production.. In general terms, perennial ryegrass demonstrated substantial genotypic plasticity in the adaptive changes in the balance between tiller population density and tiller size, reflecting the high tillering potential in this species. Rates of leaf production on main and daughter tillers consistently made the major contribution to tissue turnover in this. In contrast, prairie grass showed little adaptive response in tiller population density when tiller size was reduced, and the main component of tissue turnover was generaley stem material. Though tiller size was similar in smooth brome and prairie grass, adaptive changes in the balance between tiller size and population were more complete in the former species and leaf tissue made a greater contribution than stem to tissue turnover.. The effect of seasonal change in the enviroment on the growth of grass swards is complicated by progression from vegetative to reproductive development. In ryegrass pasture, there were advantages to spring and summer pasture production from a management which allowed seed head development to anthesis in spring, followed by hard grazing to enhance the subsequent development of new vegetative tillers. For smooth brome grass initial cutting at anthesis resulted in a greater rate of green herbage accumulation subsequently than did cutting one month later. In prairie grass the limited development of replacement daughter tillers contributed to the relatively.
(5) iii. poor perfonnance of this species under hard grazing. The relationship between the timing and severity of defoliation and the physiological status of the plant was therefore critical in determining subsequent herbage growth in all three species, though there were clearly specific differences in effects on the balance between stem and new tiller production and the expansion of daughter tillers.. This study suggested that a better understanding of the limits of adaptitive response in the different species, particularly in tiller population structure and tissue turnover, will provide an objective basis for planning pasture management. Studies of this kind, preferably made under strictly controlled comparative conditions, would be a particularly important component of evaluation programs for new plant genotypes..
(6) iv. ACKNOWLEDGEMENT. I would like to express my deep gratitude to my chief supervisor, Prof.J.Hodgson for his patient guidance, and close supervision through the course of this study.. I also feel deeply grateful to Dr.A.C.P. Chu my co-supervisor for his patient supervision; and to Prof.P.Wang, Beijing Agricultural University, for arranging and guiding my experiment in China. I would like to express my sadness at the death of prof. S.S. Chia, and my gratitude for his patient guidance during my tenure of a teaching position at Beijing Agricultural Universityand and in the early phases of this study.. I am personally indebted to Mr.C.Matthew for his advice during this study and his cooperation in the ryegrass experiment. Special thanks are due to Dr.I.Gordon for his tuition on computer statistics programs, Dr. A. Younger for his advice on thesis writing; Mr.F. Y.Liu for his help in the experiment in China, and V.K.Rugambwa, for his frindly cooperation in the prairie grass experiment.. My study at Massey University was made all the more pleasant by staff of the Agronomy Department.. I would like to express my sincere thanks to Massey University for financial support during the course of this project, and Beijing Agricultural University for granting me study leave.. Finally, I thank my wife Mrs.C.L.Zhao, for her tolerance of long absence from our home in Beijing and her gentle support and encouragement..
(7) v. LIST OF CONTENTES ABSTRACT. i. ACKNOWLEDGEMENT. iv. LIST OF CONTENTES. v. LIST OF FIGURES. xi. LIST OF TABLES. xiii. LIST OF APPENDICS. xvii. CHAPTER 1.. INTRODUCTION. 1. CHAPTER 2.. LITERATURE REVIEW.. 1. 2.1. Introduction. 2. 2.2. The effects of defoliation on herbage production. 2 2. 2.2.1 . Effects of defoliation on plant regrowth 2.2.1.1. The effect of removal of leaf. 3. 2.2.1.2. The effect of removing the stem apex. 4. 2.2.1.3. Carbon reserves. 5. 2.2.1.4. Roots. 6. 2.2.2. Effect of defoliation on sward characterstics. -_. 6. 2.2.2.1. Plant size. 6. 2.2.2.2. Seed head production. 7. 2.2.2.3. Tiller population density. 7. 2.2.3. The effects of defoliation on pasture production. 10. 2.2.3.1 . The principal effects' of management on tissue turnover in the grass crop. 10. 2.2.3.2. Continuously stocked swards. 12. 2.2.3.3. The effect of changing sward conditions. 13. 2.2.3.4. Intermittent defoliation. 14. 2.2.3.5. The duration of regrowth in an intermittently grazed sward. 17.
(8) vi. 2.2.3. 6.. Regrowth in relation to time of defoliation. 17 18. 2.2.4. Summary 2.3. Characteristics of selected species and comparison between. 19. them. 2.3.1. Perennal ryegrass (Lolium perenne.. 19. L). 2.3.2. Matua prairie grass(Bromus willdenowii Kunth.). 20. 2.3.3. Smooth bromegrass (Bromus inermis Leyss.). 21. CHAPTER. 3. GRAZING MANAGEMENT,. TILLER POPULATION AND TISSUE. TURNOVER IN PERENNIAL RYEGRASS. (Lolium perenne. L). PASTURE.. 24. 3.1. Introduction. 24. 3.2. Materials and methods. 24. 3.2.1. Site. 24. 3.2.2. Design. 25. 3.2.3. Pasture measurements. 27. 3.2.3.1. Sward measurements. 27. 3.2.3.2. Individual plant unit measurements. 27. 3.2.4. Tissue turnover 3.2.4.1. Linear change per tiller. 27 28. 3.2.4.2. The dry weight per individual tiller and the rate of change 3.2.4.3. Weight change per unit area. 28 29. 3.2.5. Tiller appearance rate. 29. 3.2. 6 . Leaf Growth Efficiency Index. 30. 3.2.7. Statistical analysis. 30. 3.3. Results. 30. 3.3.1. Tiller population density. 30. 3.3.2. Tiller size. 33. 3.3.2.1. Leaf number. 33.
(9) vii. 3.3.2.2. Individual tiller dry· weight. 33. 3.3.3. The standing herbage mass and the rate of herbage accumulation 3.3.4. Tissue turnover. 38 40. 3.3.4.1. Individual tiller. 40. 3.3.4.2. Herbage production per unit area. 43. 3.3.4.3. Components and seasonal pasture production. 46. 3.3.4.4. Leaf Growth Efficiency Index (LGEI). 46. 3.3.5. Tiller Appearance Rate (TAR) 3.4. Discussion. 50 52. 3.4.1. Techniques. 52. 3.4.2. Pasture management. 54. 3.4.2.1. Effects of sustained hard and lax grazings. 54. 3.4.2.2. The effects of switch grazing in late spring. 55. 3.4.2.3. Management implications. 55. 3.5. Conclusions CHAPTER 4.. 57. THE EFFECTS OF SEVERITY OF GRAZING ON TISSUE TURNOVER. IN MATUA PRAIRIE GRASS DAIRY PASTURE. 58. 4.1. Introduction. 58. 4.2. Materials and methods. 58. 4.2.1. Experimental design and field management. 58. 4.2.2. Measurements. 60. 4.2.2.1. Sward. 60. 4.2.2.2. Individual tillers. 60. 4.2.2.3. Tissue turnover. 61. 4.2.3. Statistical analysis 4.3. Results 4.3.1. Herbage mass and morphologi'cal composition. 61 62 62.
(10) viii. 4.3.2. Tiller size. 62. 4.3.2.1. Number of live leaves. 62. 4.3.2.2. The individual tiller dry weight. 64. 4.3.3. Population density. 67. 4.3.3.1. Tiller population density. 67. 4.3.3.2. The distribution of plant size. 68. 4.3.4. The herbage accumulation. 74. 4.3.5. The tissue turnover. 76. 4.3.5.1. Turnover of tissue on individual tillers A. The effect of tiller position. 77. B. Growth. 79. C. Senescence. 80. D. Net herbage production. 81. 4.3.5.2 Herbage production per' unit area. 4.4.. 76. 83. A. Growth. 83. B. Senescence. 84. C. Net herbage production. 85. Discussion. 87. 4.4.1. Sward measurement technique. 87. 4.4.2. The distribution of plant size. 89. 4.4.3. Seasonal effects. 91. 4.4.4. The effect of treatment. 92. 4.5. Conclusion. 93. CHAPTER 5 THE INFLUENCE OF CUTTING MANAGEMENT ON HERBAGE PRODUCTION IN SMOOTH BROMEGRASS '(Bromus inermis Leyss).. 94. 5.1. Introduction. 94. 5.2. Materials and methods. 94. 5.2.1. Experimental field and general management. 94.
(11) ix. 5.2.2. Experimental design. 95. 5.2.3. Measurements. 97. 5.2.3.1. Herbage harvested. 97. 5.2.3.2. Standing mass and herbage accumulation. 97. 5.2.3.3. Tiller population density and tiller weight. 97. 5.2.3.4. Leaves per tiller. 98. 5.2.3.5. Underground biomass. 98. 5.2.3. 6. Subsequent spring regrowth. 98. 5.2.3.7 . Statistical analysis. 98 98. 5.3. Results 5.3.1. Tiller size. 98. 5.3.1.1. Leaf number. 98. 5.3.1.2. The dry weight of individual tillers. 10 1. 5.3.2. Tiller population density. 103. 5.3.3. Herbage mass and herbage accumulation. 10 8. 5.3.3.1. Effect of timing of first cut. 10 8. 5.3.3.2. Effect of cutting height and frequency. 110. 5.3.3.3. Effect of number of cuts. 114. 5.3.4. Underground biomass. 115. 5.3.5. New season regrowth. 117. 5.4. Discussion. 118. 5.4.1. The technique. 118. 5.4.2. Tiller characteristics. 118. 5.4.3.. The effects of cutting treatment on pasture production. 5.4.3.1.. Timing of first cut. 119 119. 5.4.3.2. The cutting height and cutting intervals. 120. 5.4.3.3. The number of cuts. 121. 5.4.4. The effect of treatment on regrowth in following spring. 122.
(12) :x:. 5.5. Conclusion CHAPTER. 123. 6 GENERAL DISCUSSION. 124. 6.1. Introduction 6.2.. 124. Sward structure changes in response to defoliation in ryegrass, prairie grass,. and smooth bromegrass pasture. 124. 6 .2.1. Leaves per tiller. 128. 6.2.2. The rate of leaf appearance. 129. 6.2.3. Dry weight per tiller. 130. 6.2.4. Tiller population density.. 130. 6.3. The relationship between individual tiller weight and tiller population density. 131. 6 .4. The effects of defoliation treatment on pasture productiion in swards of different species. 140. 6.5 The relationship between season and pasture management. 142. 6.6.. 144. Conclusions. 6 . 6 .1.. 144. 6.6.2.. 145. 6 . 6 .3.. 145. 6 . 6 .4.. 145. 6 . 6 .5.. 14 6. REFERENCES. 147. APPENDICES. 1 61.
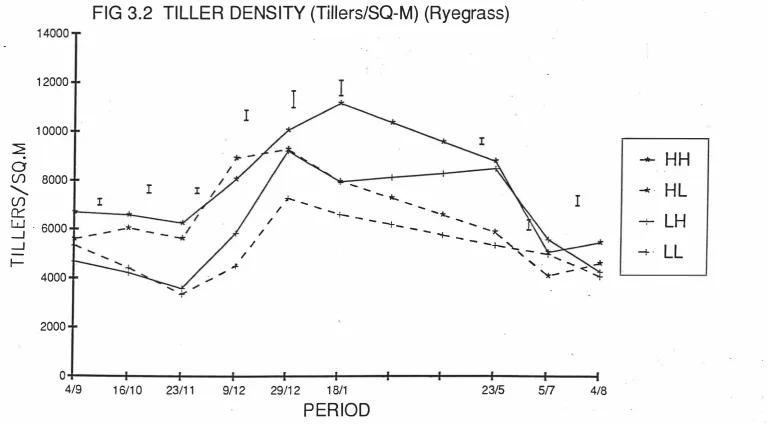
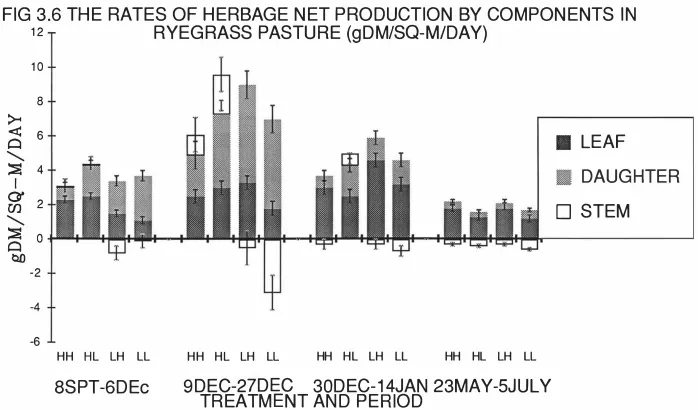
(13) xi. LIST OF FIGURES. Fig 2.1 Relationship between In(tiller weight) density). and 1n(tiller. in perennial ryegrass dominant swards.. 9. Fig 2.2 Relationship between biomass sward height and LAI and rates of growth,. senescence and net herbage accumulation. 9. in swards continuously stocked by sheep. Fig 2.3a The effects of three severities of intermittent defoliation on the rate of gross tissue production.. 16. Fig 2.3b The effects of three severities of intermittent defoliation on the rate of loss of tissue to death, as illustrated using a mechanistic model of grass. 16. production and senescence. Fig 3.1 The grazing management schedule for ryegrass experiment. ( 19 87 - 19 88) Fig 3.2 Tiller population density (Tillers/m2). 26 (Ryegrass). Fig 3.3 Individual tiller dry weight (mgDM/Tiller). (Ryegrass). 32 37. Fig 3.4 The rates of herbage growth senescence and net production per individual ryegrass tiller (mgDM/Tiller/Day). 42. Fig 3.5 The rates of herbage growth senescence and net production per unit area ryegrass pasture (gDM/m2/Day). 45. Fig 3.6 The rates of herbage net production by components in ryegrass pasture (gDM/m2/Day). 48. Fig 4.1 The individual tiller dry weight of prairie grass (mgDM/Tiller) . Fig 4. 2a The distribution of plant size under hard(H). 66 and lax(L). grazing treatments on prairie grass pasture.. 71. Fig 4.2b The distribution of plant size in different periods on prairie grass pasture.. 72.
(14) xii. Fig 4.2c The distribution of plant size before and after grazing on prairie grass pasture.. 73. Fig 4.3 The rate of net herbage production and senescence per tiller by components on prairie grass (mgDM/Tiller/day) .. 82. Fig 4.4 The rate of net herbage production and senescence 2 components on prairie grass pasture (gDM/m /day) .. 86. Fig 4.5 The regression between estimates of herbage accumulation from cut quadrats and tissue turnover procedures on prairie grass pasture.. 88. Fig 5.1 The tiller population density on uncut smooth bromegrass swards (Tillers/m) 2. 10 5. Fig 5.2 The harvested herbage mass and herbage accumulation in 2 smooth bromegrass swards (gDM/m ) Fig. 113. 6.1a The relationship between tiller density and weight in ryegrass swards in different growth seasons.. 132. Fig 6.1b The relationship between tiller density and weight in ryegrass swards under different treatments. Fig. 6.2a The relationship between tiller density and weight in prairie grass swards in different growth seasons.. Fig. 133. 135. 6.2b The relationship between tiller density and weight in prairie grass swards in different growth seasons (Corrected data) .. 13 6. Fig 6 .3a The relationship between tiller density and weight in smooth bromegrass swards under different treatments. Fig. 1 37. 6.3b The relationship between tiller density and weight in smooth bromegrass swards in different growth seasons.. 138. Fig 6 . 4 The relationship between tiller density and weight in ryegrass,. prairie grass and smooth bromegrass swards.. 139.
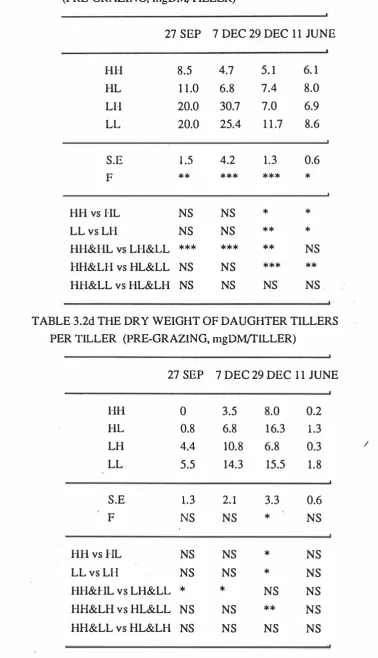
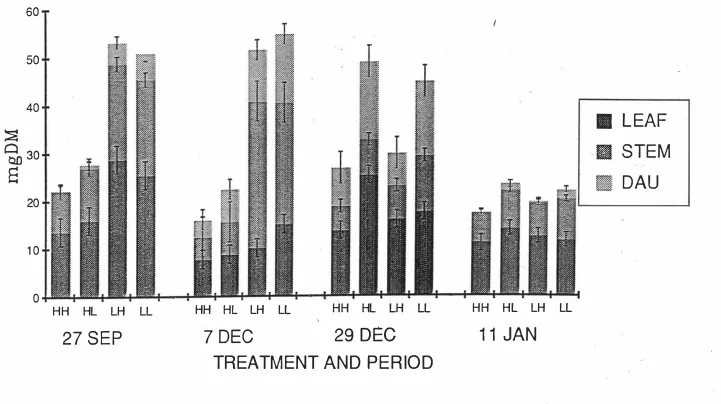
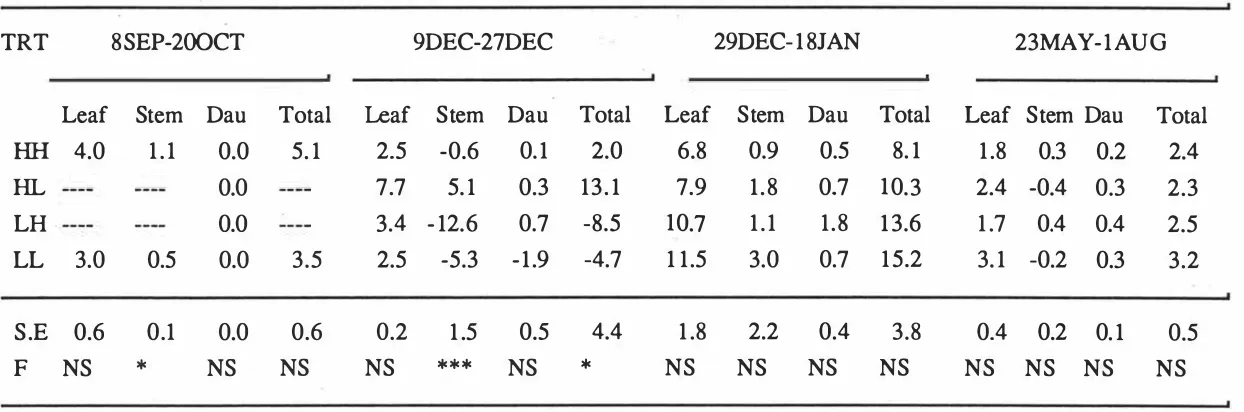
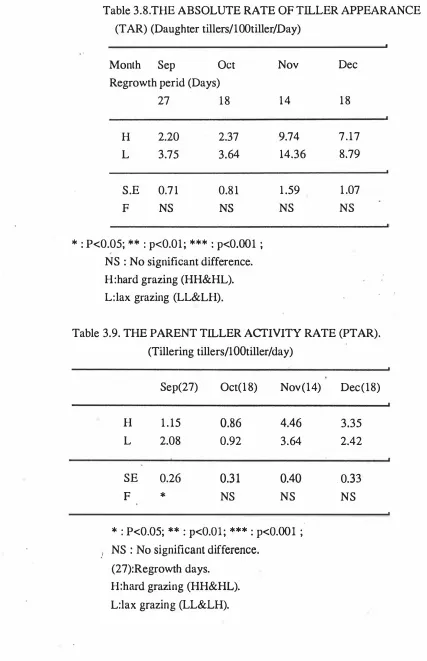
(15) xiii. LIST OF TABLES. Table 3.1 Effect of grazing management on perennial ryegrass tiller population. density (Tillers/m2).. 31. Table 3.2a The number of green leaves per perennial ryegrass tiller (Pre-grazing,. 34. Leaves/Tiller).. Table 3.2b The dry weight of leaf per perennial ryegrass tiller (Pre-grazing,. 34. mgDM/Tiller).. Table 3.2c The dry weight of stem per perennial ryegrass tiller (pre-grazing,. 35. mgDM/Tiller).. Table 3.2d The dry weight of daughter tillers per perennial ryegrass tiller (pre-grazing,. mgDM/Tiller).. 35. Table 3.2e The total dry weight per perennial ryegrass tiller (pre-grazing,. mgDM/Tiller).. 36. Table 3.3 The rate of herbage accumulation estimated b y cut quadrats in perennial ryegrass pasture (gDM/m2/day). Table 3.4 Rates of herbage growth(RG), production(RNP),. senescence(RS),. 39. and net. and of net leaf production(RNPL) in. perennial ryegrass pasture (mgDM/Tiller/day). Table 3.5 Rates of herbage growth (RG),. senescence (RS),. 41 and of. net leaf production (RNPL) in perennial ryegrass pasture (gDM/m2/day).. 44. Table 3. 6 The rate of net production per unit area by components 2 in perennial ryegrass pasture (gDM/m /Day).. 47. Table 3.7 The Leaf crop growth efficiency index (LeGEI) in perennial ryegrass pasture.. 49. Table 3.8 The absolute rate of tiller appearance (TAR) in perennial.
(16) xiv. 51. ryegrass pasture (Daughter tillers/lOOtiller/Day) . Table 3.9 The parent tiller activity rate (PTAR). in perennial. ryegrass pasture (Tillering tillers/100 tiller/day) .. 51. Table 3.10 The coefficient of variation for the rate of herbage. Table 4.1. production per tiller in perennial ryegrass pasture.. 53. Periods of pasture regrowth and measurement.. 59. Table 4.2a The number of live leaves per tiller before grazing in hard(H). and lax(L). 63. grazed prairie grass pasture.. Table 4.2b The total number of leaves and the rate of leaf appearance in hard(H) to Nov 19 8 8 ,. and lax(L). grazed pasture (Sep 63. prairie grass) .. Table 4.3a The individual tiller dry weight in hard(H) grazed prairie pasture (pre-grazing,. and lax(L) 65. mgDM/Tiller). Table 4.3b The ratio o f stem t o total tiller dry weight i n hard(H) and lax(L). grazed prairie grass pasture.. 65. Table 4.4 The tiller population density on permanently marked plants in hard(H). and lax(L). 67. grazed prairie grass pasture. Table 4.5a The effects of treatment and period on distribution of plant size and plant population density in hard(H) lax(L). and 69. grazed prairie grass pasture.. Table 4.Sb The distribution of size and plant population density during regrowth under hard(H). and lax(L). grazed prairie. grass pasture.. 70. Table 4. 6 The pre and post-grazing standing herbage mass(gDM/m2) and the rate of green(G). and total(T). herbage. accumulation(gDM/m2/day). estimated b y cut quadrats.. 75. Table 4.7 The coefficient of variation o f estimates of herbage growth on sample tillers in period 2.. 76.
(17) xv. Table 4.8a The effect of tiller position in the plant on rate of 77. herbage growth per tiller (mgDM/Tiller/day) . Table 4.8 b The effect of tiller position in the plant on rate of herbage senescence per tiller (mgDM/Tiller/day) .. 78. Table 4.8c The effect o f tiller position in the plant o n rate of herbage net production per tiller (mgDM/Tiller/day) .. 78. Table 4.9a The rate of herbage growth per tiller over different treatment periods as estimated by individual tiller tissue turnover (mgDM/Tiller/Day). 79. Table 4.9b The rate o f herbage senescence per tiller over different treatment periods as estimated by individual tiller tissue turnover (mgDM/Tiller/Day). 80. Table 4.9c The rate of herbage net production per tiller over different treatment periods as estimated by individual tiller tissue turnover. 81. (mgDM/Tiller/Day). Table 4.10 a The rate of herbage growth per unit area as estimated from individual tiller tissue turnover and tiller 2 population density (gDM/m /Day). 83. Table 4.10 b The rate of herbage senescence per unit area as estimated from individual tiller tissue turnover and 2 tiller population density (gDM/m /Day). 84. Table 4.10 c The rate of herbage net production per unit area as estimated from individual tiller tissue turnover and 2 tiller population density (gDM/m /Day). 85. Table 4.11 The Plant size distribution on prairie grass pasture. Table 5.1. (Current study and Dodd). 90. The experimental design i n smooth bromegrass pasture.. 96. Table 5.2a Number of green(G) ,. senescent(S) ,. and total(T). leaves.
(18) per vegetative tiller (Leaves/tiller). in smooth 99. bromegrass (Measured at 5 July) . Table 5.2b Number of green(G) ,. senescent(S) ,. and total(T). leaves. per vegetative tiller (Leaves/tiller) in smooth 100. bromegrass (Measured at 22 September) . Table 5.3a Influence of treatment on the dry weight of individual. 102. smooth bromegrass tillers (mg/Tiller) . Table 5.3b Influence of season on the dry weight of individual. 102. smooth bromegrass tillers (mg/Tiller) . Table 5.4a Smooth bromegrass (Bromus inerrnis Leyss) reproductative (R). and total (T). vegetative. (V) ,. tiller population. density (Tillers/m2) .. 104. Table 5.4b Density of various size class smooth bromegrass tillers (Cl, >9 leaves/Tiller; leaves/Tiller),. C2, 4-9 leaves/Tiller;. C3, <3. and the numbers of tillers and buds. 2 per plant in October (Tillers/m ) '. 107. Table 5.5a The effect of initial cutting time on green(G) , and total(T). herbage harvested in summer,. dead(D). autumn and. 2 overall in smooth bromegrass pasture (gDM/m ) . Table 5.5b The effect of initial cutting time on green(G) , and total(T). herbage accumulation in summer,. 109 dead(D). autumn and. 2 overall in smooth bromegrass pasture (gDM/m ) .. 109. Table 5.6a The effect of cutting height (Treatments 3&4 vs 5& 6 ) , cutting frequency (Treatments 3&5 vs 4&6) ,. and cutting. height*frequency interaction (Treatments 3&6 vs 4&5) on green(G) , in summer,. dead(D). and total (T). herbage harvested. autumn and overall in smooth bromegrass. pasture (gDM/m 2) .. 111.
(19) xvii. Table 5 . 6b The e f fect of cutt i ng height cutt i ng f requency. ( Treatme nt s 3 & 4 vs 5 & 6 ) ,. ( Treatme nt s 3 & 5 vs 4 & 6 ) ,. a nd cutt i ng. height * f requency i nt e ra c t i on ( T reatme nt s 3 & 6 vs 4 & 5 ) gree n ( G ) , s umme r ,. dead ( D ). a nd t ot a l ( T ). on. herbage a ccumulat i on i n. autumn a nd ove r a l l i n smooth b r omegra s s pasture 112. Table 5 . 7 The e f fect of numbe r of harve s t s on yield a nd a ccumulat i on of gree n ( G ) ,. dead ( D ) ,. a nd t ot a l ( T ). herbage ove r t he f u l l ( gDM/m 2 ). growth pe r i od i n smooth bromegra s s pasture. 114. Table 5 .8 The e f fect of cut t i ng t reatment on u nde rgrou nd b i oma s s i n smooth bromegra s s pasture. ( Samp l i ng o n 2 2 Oct obe r ). ( gDM/m 2 , t o 4 0 cm depth ) .. 116. Table 5 . 9 The e f fect of previous cut t i ng t reatme nt on smooth bromegra s s t i l l e r p opu lat i on de ns it y ,. s t a ndi ng he rbage 117. ma s s per u nit a rea a nd weight per t i l l e r . Table 6 . 1a The re sponses of t i l l e r characte r s t i c s t o de f oliat i on i n ryegra s s , prairie gra s s a nd smooth b r omegra s s pasture. 12 5. ( at rep r oductive pha s e ) . Table 6 . 1b The rate of leaf appe a r a nce a nd the numbe r of leave s at the begi nni ng. ( p os t g r a �i ng ). a nd the e nd. of regrowt h i n pere nnia l ryegra s s ,. ( pre-gra zi ng ). prai rie g r a s s a nd 12 6. smooth b r omegra s s . Table 6 . 1c The prop ort i on of repr oductive t i llers i n ryegra s s ,. 12 7. p r a i rie grass a nd smooth bromegr a s s s wa rds Table 6 . 2 The rates of herbage growth , p r oduct i on per t i l l e r a re a. ( gDM/m 2 / day). b r omegra s s swa rds .. s e ne s c e nce ,. (mgDM/ T i l le r / da y ). in ryegra s s ,. a nd net a nd pe r u nit. prairie gras s ,. a nd smooth 14 1.
(20) xviii. LIST OF APPENDICES. Appe ndi x 3 . 1 a. 161. ( F ig). The r a i nf a l l per month f r om August 198 7 to Ma rch 198 9. ( P a lme r s t on. North ) . Appe ndi x 3 . 1b. (Fig). 162. T h e ave rage a i r tempe rature f r om August 19 8 7 t o Ma rch 19 8 9. ( P a lme rst on. Nort h ) . Appendix 3 . 2. 163. Xia , J.X.; H odgs on, J . ; Matthew , C.; a nd Chu , A.C.P .(19 8 9). E f fect o f spring. a nd s u mme r grazi ng ma nageme nt on t il le r p opul a t i on a nd t i s sue t u r nve r i n a pe re nni a l ryegra s s pasture .. P r oc . N . Z . Gr a s s ld As s . 5 1:119-12 2 .. Appe ndix 3 .3. 16 6. The ANOVA a na ly s i s of net leaf product i on ( g / s q-m/ day ). i n December 19 8 7. Appe ndix 3 . 4 T i s sue dry weight per u nit l e ngth Appe ndix 3 .5 a. (mg / mm). ( Table ). 167 167. The s t a nding herbage ma s s e s t imated by cut quadrat s in spring ( gDM/m2) . Appe ndix 3 . Sb. ( Table ). 168. The s t a nd i ng herbage ma s s e s t imated by cut quadrat s i n s u mme r ( gDM/m2) . App e ndix 3 . Sc. ( Table ). 168. The s t a nd i ng herbage ma s s e s t imated by cut quadrat s i n w i nt e r ( gDM/m2) . Appe ndix 4.1 The ANOVA a na lys i s of leaf growth rate per unit a re a .. 169.
(21) xix. Appendix 4 . 2 a. 1 70. ( Table ). Mean values o f post and pre -gra z ing herbage ma s s Rugambwa ,. ( kgDM/h a ) ( From. et al 1 9 90). Appendix 4.2b. 1 70. ( Table ). Mean va lues f o r morphologica l comp os it ion. (% dry weight ). ratio in the post -gra z ing herbage f rom lax grazed ( L ) grazed ( H ). p r a i rie gra s s swa rds ,. Rugambwa ,. et a l 1 9 90) .. Appendix 4 . 3. and lea f : stem. and h a rd. average a cross a ll s e a s on. ( F rom. ( Table ). 171. Mean chemica l compos it ion o f herbage on o f f e r and anima l p roduct ion in h a rd grazed. (H). and lax grazed. (L). prairie gra s s pasture. ( Rugambwa , et. a l 1 9 90) Appendix 4 . 4 ( Table ). 171. Mean bot a n i ca l comp o s it ion and morphologi ca l components o f past ure on offer. (% of DM). p a s t u re. in hard grazed. ( Rugambwa ,. Appendix 4 . 5. (H). and lax grazed. (L). p r a i rie gra s s. e t a l 1 9 90) .. ( Table ). 172. Plant popu lation o f Matua prairie gra s s under lax and h a rd graed ( P lant s /m 2 ). ( Ch u ,. Unpu l .. dat a ) .. Appendi x 5 . 1 . The green herbage a ccumu lation in summe r ( June -Augu s t ) o f ANOVA and cont rast stat i s t i ca l ana lys i s .. 1 73 --- an example.
(22) 1. CHAPTER 1. I NTR ODUCTI ON. Much research work based on the dynamics of plant tissue turnover in grazed swards has been carried out under continuous stocking managements in which swards have been maintained in approximately steady state with reference to herbage mass, canopy height or leaf area index. There is a marked degree of insensitivity in net herbage production over a range of steady-state conditions (Hodgson, 1985). This is a consequence of compensating changes in tiller populations and production per tiller, of associated changes in sward structure and in the photosynthetic efficiency of leaf populations, and of the close links between rates of herbage growth and senescence (Hodgson et al., 1981). All of these effects reflect the influence of patterns of defoliation by grazing animals (Watkin and Clements, 1978; Bircham and Hodgson ,1983) on tiller morphology and on tiller and leaf turnover. The accumulated evidence from field studies (Arosteguy et al., 1983; Bircham and Hodgson. 1983; Grant et al., 1983; Parsons et al., 1983a) displays a very encouraging degree of agreement across locations, years, seasons and measurement techniques, but the information comes mainly from relatively short duration grazing experiments on perennial ryegrass or ryegrass/white clover swards in the UK. In order to understand the compensating responses to defoliation in sward structure and function and so provide greater objectivity in advice on pasture mangement, there is a need for more information on seasonal variations in sward dynamics of rye grass pasture, and on sward dynamics of other grass species which differ from ryegrass in plant morphology. The objective of the study reported here was to examine the sensitivity to defoliation of three forage grass species, sensitivity being defined principally in terms of adjustment in tiller population density and tissue turnover following variations in defoliation treatment. Three experiments are reported, one with perennial ryegrass (Lolium perenne L.) cv. Ellectt under sheep grazing, one with prairie grass (Bromus willdenowii Kunth) cv. Grasslands Matua under dairy cow grazing, and one with smooth bromegrass (Bromus inermis leyss) under cutting management. The first two experiments were carried out at Massey University, New Zealand, the third at Beijing Agricultural University, China. Each experiment involved management variations set within a range considered to be appropriate to the species under examination, and was complete in itself. The results of the three experiments are reported separately, but are drawn together for comparative purposes in an integrating discussion in chapter six..
(23) 2 CHAPTER 2 LITERATURE REVI EW.. 2.1. Introduction. One of the essential features of a pasture plant is that it should be capable of regrowth if successive defoliations are imposed. Both initial growth following dormancy and regrowth following winter show the sigmoid growth pattern common to many biological organisms. A period of very slow initial growth is fo�lowed by a period of rapid increase, eventually reaching a plateau. The beginning of the plateau is the time when growth becomes limited by the light falling on the pasture. At that time, the pasture canopy will intercept 95% of the incident light. The leaf area which will prevent all but 5% of the light from reaching the soil surface is called the critical leaf area and is usually defined by a critical leaf area index. The leaf area index (LAI) is the number of units of leaf per unit area of soil surface and the critical leaf area is different for different species (Walton, 1983). As grasses age and mature, the critical leaf area index will increase. The leaves of a young grass plant are held in a compact rosette. As the plant matures, the internodes elongate, the leaf arrangement becomes more open, and an increased leaf area is required to intercept 95% of the light falling on the canopy. The light reaching the soil surface decreases as the LAI is increased (Walton, 1983). The exceedingly important feature of the regrowth pattern of plants is the inverse relationship between their mass following defoliation and the length of time which passes before growth becomes exponential (Walton, 1983). Severe defoliation of the grasses will remove not only a substantial amount of dry matter, but also much of the carbohydrate reserve material stored in the stem base. Where carbohydrate reserves are low, initial growth will be slow, and the total productivity of the stand will very likely be reduced. The species respond differently to defoliation also (Walton, 1983). Many studies have focussed on the effect of defoliation on pasture production. In this chapter the effect of defoliation on plants, the influence of defoliation on sward characteristics, the effects of defoliation on pasture production, and the characteristics of selected species, will be reviewed. Attention will be concentrated mainly on perennial ryegrass (Lolium perenne. L), the most widely sown forage grass species in temperate countries. In a final section comparative assessments are made of perennial ryegrass and two other widely grown forage grasses, prairie grass (Bromus willdenowii Kunth.) and smooth bromegrass (Bromus inermis Leyss.), which were investigated on this project. 2.2 The effects of defoliation on herbage produc tion ... 2.2.1. Effects of defoliation on plant regrowth.
(24) 3 2.2.1.1. The effect of removal of leaf. The effect of leaf removal on the growth of a plant is dependent on whether the whole or only part of the leaf is removed, the stage of development of the leaf which is removed and the extent to which the leaf area of the plant as a whole is reduced (Tainton, 1981). In the sward the importance of maintaining leaf area sufficient to intercept most of the incident light for photosynthesis and the rapid recovery of this leaf area after defoliation was illustrated by the classic studies of Brougham (1956), in which regrowth increased as the residual LAI increased. The increase in Crop Growth Rate (CGR) was observed to continue up to the point at which virtually all of the incoming light was being intercepted and the sward formed a closed canopy (Brougham, 1956). The penetration of light into the sward is determined by the size, shape, and angle of the leaves. The effect of defoliation height will depend on growth conditions immediately prior to defoliation (Walton, 1983). Generally the effects of removing older leaves are less than the effects of removing younger leaves in perennial ryegrass, but this may depend on nutrient status (Davies, 1988). Removal of the emerging leaf reduced extension more than the removal of the fully emerged leaves at high nutrient level, but the reverse was the case at low nutrient level with cockfoot grass (Davidson and Milthorpe, 1966). In swards maintained at low LAI, young leaves are expanded in high light, free from shade by old leaves, and so develop a high capacity for photosynthesis (Woledge, 1973, 1977, 1978). However, at the high stocking rates required to maintain a low LAI many leaves are defoliated while they are young (Morris, 1969, McIvor and Watkin, 1973). Thus, it is a proportion of the most photosynthetically efficient tissue that is removed. Nevertheless, the growing leaf (L1) and the remainder of the youngest fully expanded leaves (L2) contribute substantially to the total photosynthesis of the canopy. In a study in a sward maintained at LAI 1.0 by continuous grazing , the growing leaves and the youngest fully expended leaves together contributed some 75% to the total photosynthesis of the canopy (Parsons et al., 1983a). A general description of the effect of defoliation on plant regrowth was given by Walton (1983). The reduction in photosynthetic capacity of the plant will invariably affect plant vigour and in particular the growth rates of the roots and lateral daughter shoots, both of which are much more sensitive to a deficiency of energy than is the main stem. Frequent leaf removal will therefore reduce the capacity of plants to produce tillers and will redu���e an9 <!�th QLRenetr�tiQ.n2f the root�xstem� However, the iI�creased ligla penetration to e base of t�e �wa�d resulting from leaf _ removal may stimulate the development of daughter tillers from the basal nodes in. �. many species, or alternatively stimulate the growth of young tillers which have already.
(25) 4. begun development and which may not have survived in the dense canopy (Tainton, 1981). 2.2.1.2. The effect of removing the stem apex. Since the inflorescence of the grass plant develops directly from the apex of the stem, the most obvious effect of removing the apex is that of terminating stem growth and preventing flowering and seed production (Tainton, 1981). An important secondary effect of the removal of the stem apex results from the associated removal of the inhibiting effect of this apex on the development of lateral tillers lower down on the stem, an inhibition which results from the secretion of growth regulators by the apex (Tainton, 1981). The removal of the apex leads to growth in previously dormant tiller initials at the basal nodes of the stem, and this results in an increased tiller density (Tainton, 1981). In addition to the above effects, the removal of the stem apex in certain species in which it is elevated above grazing or cutting height while it is still in the vegetative growth stage and therefore still producing leaves reduces the eventual number of leaves which will be formed (Tainton, 1981). The importance of the location of the apex in relation to defoliation has been recognized. During the annual cycle of development some tillers become reproductive and basal internodes begin to elongate, carrying the developing inflorescence upwards and exposing it to decapitation. Once the apex has been removed the tiller dies, so regrowth in reproductive swards depends partly on the number and developmental status of any accompanying undecapitated tillers. The timing of cuts during the reproductive phase is thus critical in relation to the quantity and character of the regrowth (Davies, 1988). Matthew (1990) suggested that reproductive tillers supply substrate to daughter tillers and assist the initial establishment of the daughter tillers, and he (Matthew, 1990) found that the translocation to daughter tillers was greater where the parent tiller seed head had been removed than where the parent tiller seed head remained intact. As decapitated tillers cannot continue growth, immediate regrowth depends on the tillers which have escaped decapitation and can continue to form new l�aves and/or stem material. New tillers are, however, developed on the cut stubs of the decapitated tillers, which may accumulate large amounts of reserve carbohydrate. Ample evidence exists to show that when these stubs are cut short fewer new tillers are formed and regrowth is reduced (Davies, et aI.,1981). Each reproductive tiller stub in perennial ryegrass seems to be capable of producing two to three new tillers (Davies et aI., 1981) and under favorable conditions the number of living tillers may double in 2 weeks (Davies, 1988). On the other hand observations have shown that in dry conditions.
(26) 5. many vegetative tillers in a reproductive sward of perennial ryegrass die before or as a consequence of defoliation (Davies, 1988). 2.2.1.3. The carbon reserves. A plant which has insufficient assimilatory surface to supply its current respiratory needs for maintenance and growth must make use of available carbon resources, the most important of which are the non-structural water-soluble carbohydrates (Davies, 1988). Fructosan levels in stubble and roots of perennial ryegrass and cocksfoot plants fall rapidly after defoliation (Sullivan, et aI, 1943; Sprague, et aI.1950). This fall is presumably arrested when sufficient current photosynthate is produced to meet demands. The return to the original level is normally complete within 4-5 weeks, though it may be slower at low temperature (Davies, 1965). Frequent defoliation can lead to low stubble carbohydrates, poor regrowth and even tiller death (McIlvanie, 1942). Evidence that carbohydrate levels may directly influence regrowth was provided by Alberda (1966a,b), who held perennial ryegrass plants in the dark for 3.5 days to reduce the level of carbohydrate in the stubble before defoliation. Regrowth in these plants was substantially less than in control plants receiving continuous light. In the high-carbohydrate plants the new leaf appeared to be formed almost entirely at the expense of stubble carbohydrates. The contribution of exposed green leaf sheaths to the net carbon balance after cutting is not well documented (Davies, 1988). Regrowth of perennial ryegrass plants with most of the leaf laminae removed was reduced by 20-30% when the sheath and pseudostem was shaded (Davies et aI, 1983). In a continuously grazed sward the contribution of sheath to canopy photosynthesis was found to be less than 5% (Parsons et al, 1983a). The regrowth ability of ryegrass is predominatly dependent on the size of mobile reserves, both nitrogen and carbon (Gonzalez, et al., 1989). Gonzalez, et aI., (1989) studied the changes in stubble carbohydrate content during the regrowth of ryegrass grown under hydroponic conditions at two nitrogen levels. The result showed that regrowth at a non-limiting nitrogen level (1.0 mol m-3. NHfNO�,. ) involved two. different physiological periods. The first occurred during the first 6 days and was characterized by the mobilization of 60% to 90% of the soluble carbohydrates. During the second period (6-28 days of regrowth) carbohydrate contents rose to the values observed prior to cutting (20% of dry matter at the 28th day of regrowth). The effect of -3. low nitrogen conditions (0.2 mol M. NI\ N �.-). was observed only during the second. phase. Plants regrown in a nitrogen-starved medium accumulated 2.3-fold more poly fructans than plants regrown in a non-limiting nitrogen medium..
(27) 6. 2.2.1.4. Roots. The effect of defoliation is to reduce root growth (Crider, 1955), and depress mineral uptake (Oswalt et al, 1959), effects associated with a decline in root respiration. Tracer studies using. .1�C. (Clifford and Langer, 1975; Ryle and Powell, 1975) show a. reduction in photosynthetic carbon transported to roots of defoliated plants of Italian reygrass and uniculm barley immediately after defoliation. Evans (1971) found that defoliation of ryegrass plants to 75 mm reduced root growth in the following week by approximately 40% while defoliation to 25 mm reduced root growth by almost 90%. Troughton (1957) reviewed a number of experiments reporting similar reduction of root growth after defoliation. Matthew, et al. (1988) reported root mass and new root production to be relatively insensitive to grazing management; seasonal fluctuations in new root production were large in comparison to those produced by contrasting hard and lax grazing regimes. 2.2.2. Effect of defoliation on sward characterstics 2.2.2.1. Plant size. As herbage accumulates during regrowth the number of intact new leaves on each tiller increases. In vegetative swards of perennial ryegrass the mean number of living leaves per tiller rarely exceeds three (Hunt, 1965; Alberda and Sibma, 1968), and the production of a fourth leaf tends to be counterbalanced by the loss of the fIrst one (Davies and Calder, 1969; Davies, 1971). Unless the most recently-formed leaf is appreciably larger and heavier than the one that it replaces (or stem development occurs) the net gain in weight of living leaf will !Je small. In many instances, and especially in the second half of the year or in the winter, any net gain of this kind is counterbalanced by the loss of whole tillers, so net herbage growth rate becomes zero and a ceiling yield is reached. Assuming that no intact leaves remain after defoliation, the ceiling yield can be expected to be attained after three leaf-appearance intervals (Davies,1977). Ceiling yields in a vegetative sward thus depend on seasonal variations in leaf lengh (Davis, 1977) and tiller numbers. The length of new leaves (and their rate of appearance) is influenced to a large extent by the length of the sheath tube though which the leaves emerge (Grant, et aI, 1981a). If the sheath tube is left intact (Younger, 1972; Davies,1974) the emerging leaves will be relatively long and may appear more slowly than in comparable undefoliated material. If on the other hand the cut removes the upper part of the sheath the new leaves will be shorter and may appear as quickly as in undefoliated plants. Jackson (1976) found that the heights of insertion of the lowest green leaf blades on tillers of S.23 perennial ryegrass at constant cutting heights of 3,6,9, and 12 em, were 2.6, 4.3, 6.6 and 9.2 cm respectively. Weights of green leaf blades were very similar for all cutting heights..
(28) 7. The tillers produced from reproductive stubs frequently emerge from old buds exposed by the decay of their subtending sheaths, or break through the old sheaths (extra vaginal tillers). They are considerably smaller than the old vegetative tillers (Davies et aI., 1981). Regrowth may then consist of a dense mat of small tillers with exposed green sheaths which can, in turn, provide a highly efficient basis for the next regrowth cycle (Davies and Evans, 1982). 2.2.2.2. Seed head production. Responses to defoliation in the reproductive phase are related both to the duration of the phase and to the percentage of tillers which become reproductive. In swards well supplied with water and nitrogen the loss of old tillers by decapitation is quickly made up for by development of new tillers, though heavy fertilization of a reproductive crop can both increase deaths of non-flowering tillers after defoliation and reduce formation of new tillers (Dawson, et aI., 1983). Each reproductive stub in perennial ryegrass seems to be capable of producing two to three new tillers (Davies et al., 1982) and under favorable conditions the number of living tillers may double in 2 weeks. In this way the sward rapidly increases its tiller population towards the maximum characteristic for the time of year. Autumn and early spring defoliations appear to have little influence on the number of seed heads formed (Roberts, 1965), though they may influence the number of vegetative tillers and therefore the percentage of tillers which flower (Davies and Simons, 1979). Comparisons of data from different experiments, harvest years and cutting treatments for S.24 perennial ryegrass confirm that the total number of tillers which become reproductive remains similar over a wide range of circumstances (Davies, 1988). Very frequent close defoliation, however, substantially reduces the total number of reproductive tillers in a way that cannot be accounted for by tiller deaths. Box-grown swards of S.23 perennial ryegrass cut every 10 days at average heights of 3 cm and 2 cm contained only 13% and 8% of the total number of decapitated tillers observed when the swards were cut at mean ear emergence. Similarly low totals have been recorded in continuously grazed swards (Davies, 1988). 2.2.2.3. Tiller population density. Tiller development is stimulated by defoliation, though the number of new tillers initiated, and the rate at which they develop, is likely to be strongly affected by sward conditions both before and after defoliation (Jewiss, 1972). The main factor influcencing the initiation of tillering seems to be the attenuation of the incident light through the canopy, via changes in the proportions of red/far-red light and involving the phytochrome system (Deregibus et al., 1983)..
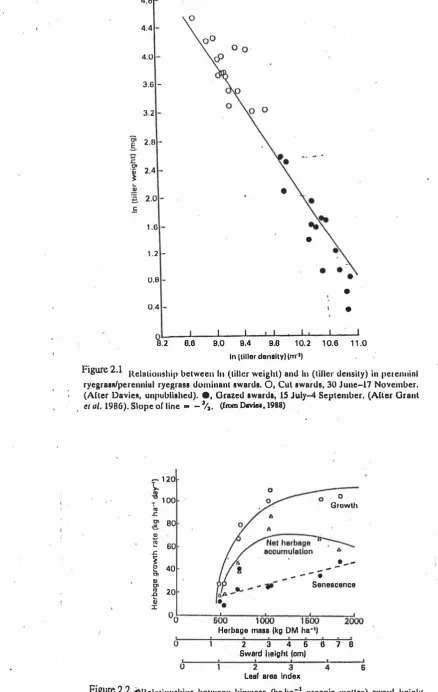
(29) 8. The loss of tillers is increased by both severe shading (Kays and Harper, 1974) and by severe defoliation (Brougham, 1959; Smith, et al, 1971). Changes in tiller density can be extremely rapid over short periods of time (Brougham, 1960; Garwood, 1969), though it may be easier to depress than to increase populations in the short term. Tiller populations tend to increase as the frequency of defoliation increases, and. are. maintained at a higher level under continuous stocking management than under rotational grazing at comparable stocking rates (Hodgson and Wade, 1978). The influence of severity of defoliation is more complex, populations tending to be greatest at intermediate levels of defoliation, but the pattern of response is sensitive to both sward and climatic conditions at time of defoliation (Brougham, 1960; Jewiss, 1972; Grant et al., 1981a.b). Hodgson et al (1981) have shown that tiller numbers and tiller weights in swards maintained at different herbage mass by continuous grazing are related to each other through the minus 3/2 law (Fig 2.1) established by Yoda et al (1963). This law, initially applied to plant numbers and plant weights during a period of self-thinning, has been shown by Kays and Harper (1974) to apply equally well to tiller numbers and tiller weights in perennial ryegrass. The self-thinning law does not cover circumstances in which tiller numbers are increasing or where (as in very short, hard-grazed swards) there is a loss of plant cover (Davies, 1988). Swards may respond to defoliation by net gains, net losses or no overall changes in tiller populations, depending on initial tiller numbers at the time of cutting and the time of year. During the spring the tendency will be to net gains, but during autumn the opposite will be the case. In the later part of the summer a sward defoliated intermittently (say every 4 weeks ) may develop a stand of tillers sufficiently dense to permit rapid canopy development and suppress further tillering (Davies, 1977). Tillers may be suppressed to the point at which they will die when the sward is cut (Alberda, 1966a). Wade (1979) observed that tiller losses in swards were high in the first week after defoliation and that subsequent tiller production was inversely proportional to LA!. When tillers cease to develop leaf sheaths accumulate, and these may die and persist after the sward has been defoliated. With continued lax defoliation tubes of dead sheaths may accumulate (Jackson, 1974) and suppress further tiller development (Davies et aI., 1983)..
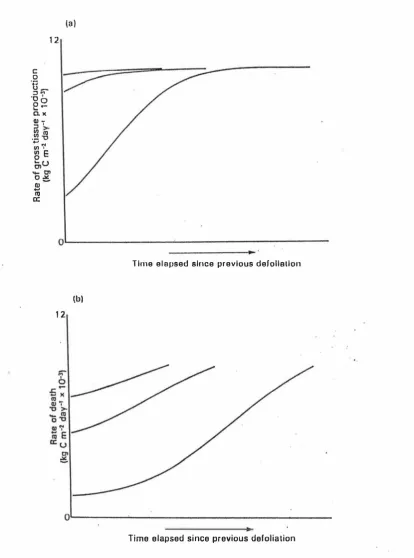
(30) 9 4.B. 4.4. 4.0. 3.6 -. 3.2 0;. .s .c. 01. 'Qj �. -. 2.B. 2.4. ... � �. 2.0 -. .E 1 .6 • 1 .2. -. 0.8. -. 0.4. -. • •. o L---�--J--�--��-� B.2 8.6 9.0 9.4 9.8 1 0. 2 1 0.6 1 1 .0. Figure 2.1. In Itlller denaltyl lnr21. Relationship betweell. III. (tiller weight) and. ryegrass/pe rennlill ryegrass dominant swards.. 0,. III ( t il le r. density) in perenninl. Cul swards, 30 J une-17 November.. (Alter Davies, unpublished). e, O razed award.; 15 J uly-4 September. (ACler Orant el al. 1986). Slope of line. -. - %. (from DavieI, 1988). .. - 1 20. \.. � I. o. 1 00. G rowth. ." .r: C>. � � 111 .... .r:. j0. ... '". Q) C> 111 .0 ... Q) J:. 80 60 ._ - - - - - .. 40. Senescence. 20. °0�----�6±OO�--�I�OOO�----'�6�O-�2�OOO He rbag e meaa 'kg. OM ha-I) t. I. I. I. 2 3 4 6 Sward he ig ht (om). 6. 7. 8. ,. ,. 2. ,. 3. Leaf area Index. 4. 6. Figure 2.2 �Rc l n t ionships between biomass (kg ha-1 organic mailer) sward height (crn) and LA I nnd I'IIIC5 of hcrbage growlh, scnescence and lIel hcrbngc accumulalion ' (all kgha- DM) in . swards continuously stocked by sheep. (After Bircham Bud HodgllOlI. 1 983. ).
(31) 10. 2.2.3. The effects of defoliation on pasture production 2.2.3.1. The principal effects of management on tissue turnover in the grass crop. There are two characteristics of the grass crop which are central to understanding the effects of management on production. First, because the grass sward displays a rapid turnover of tissues, any material that remains unharvested is soon lost to death. This turnover is clearly the origin of a considerable potential loss to production. With a mean leaf appearance interval of 11 days, an amount equivalent to the entire standing live weight of the crop may die each month. So, in contrast with cereals, and the many crops which are harvested once at the end of a single period of growth, the grass crop must be harvested repeatedly (Parsons, 1988). Second, it is the photosynthetic tissue, the leaves, that are predominantly harvested. Over the season the repeated defoliation that is essential to harvest a proportion of the grass crop, inevitably reduces the leaf area and light interception of the canopy, interrupts canopy photosynthesis and so reduces the capacity for the production of new leaves. Clearly, then, the way the sward is harvested on any one occasion has a profound effect on the amount grown, as well as on the degree to which the tissue produced is harvested. The objective of grassland management must be to strike a compromise between the conflicting demands of the grass plant, which needs to retain leaf area for photosynthesis, and the essential need to remove leaf tissue for harvest. This conflict leads to a dilemma that is central to grassland management (Parsons, 1988). There has long been interest in the degree to which control of sward conditions can be used to influence herbage production and utilization. Hodgson and Wade (1978), however, concluded that Net Herbage Accumulation (NHA) was relatively insensitive to variations in grazing management or to variations in stocking rate over the range of practical interest. The absence of substantial differences in animal production between intermittent and continuous grazing managements (Arnold, 1969, Marsh, 1976) supports this view. The development of concepts of tissue turnover or tissue flows in grazed swards provided a basis for explanation of this relative insensitivity to variations in grazing management. Hodgson et al (1981), and Bircham and Hodgson (1983) described the tissue turnover relationship. The use of Net Herbage Accumulation (NHA) as the index of comparison in both cutting and grazing experiments introduces a major difficulty in the interpretation of treatment differences. In the absence of grazing · animals, NHA is the resultant of the processes of growth (G) and decay (D) but, when the grazing animal is present, NHA represents the balance between G, D, and herbage consumption (C), all expressed as rates per unit of ground area thus:.
(32) 11 NHA = G - ( D + C ). (1). In these circumstances differences in NHA between experimental treatments could be due to differences in G, D or C or to combinations of changes in two or more variables. Herbage tissue which is not harvested must eventually senescence and die (Vickery, 1981); therefore the efficiency of harvesting of the tissue grown is a detenninant of NHA. When NHA is zero, as it may be under continuous stocking management, equation (1) can be transfonned to equation (2): NP = G - S. =. C green. (2). here NP is the net production of green herbage and senescence (S), the rate at which live tissue becomes dead tissue, is substituted as an alternative to the parameter D which is difficult to measure. Maintenance of a sward in a steady state (i.e.NHA. =. 0). makes it possible to relate the many factors of the sward/animal interface to common parameters like herbage mass, sward surface height or leaf area index (LAI) (Bircham and Hodgson, 1983). The balance between photosynthesis, gross tissue production, herbage intake and death that may be achieved in swards maintained at a range of sward states has been derived from studies of both the carbon balance of the grazed crop (Parsons et al, 1983) and from studies of the rates of tissue growth and senescence on individual tillers (Bircham and Hodgson, 1983; Grant et al., 1983). Despite the use of contrasting techniques, there is close agreement between these observations when the swards are compared on the basis of Leaf Area Index (LAI) i.e. the area of leaves per unit area of ground, or sward surface height (Hodgson, et al. 1978). These studies have shown how rates of photosynthesis and gross tissue production. are. close to a maximum in swards maintained at a high LAI, but in order to sustain this level of green production, a large proportion of the leaves produced must remain in the sward to contribute to photosynthesis. As a result, this same tissue inevitably gives rise to a high rate of loss of matter to death and decomposition, and the amount harvested is small. In swards maintained at a lower LAI, a greater proportion of leaf tissue is removed and photosynthesis and gross tissue production are substantially reduced. However, the increase in the efficiency of utilization of plant tissue offsets the decrease in the amount grown, and the amount harvested is actually increased (Parsons, et al. 1983a). Clearly then, maximum harvested herbage yield per hectare is not achieved in swards maintained at a high LAI so as to intercept a large proportion of the incident light, as was originally suggested (Donald and Black, 1958), but at a lower, intermediate LAI, as this provides the best compromise between gross tissue production on the one hand and losses to decomposition and death on the other. Bircham and Hodgson (1983).
(33) 12. demonstrated the existence of a ' homeostatic' mechanism in continuously grazed swards, whereby compensatory changes in species population density and tissue turnover on individual plant units combine to maintain relatively constant net production of green herbage over a range of herbage mass and LA!. Leaf area index cannot readily be measured on a farm, but studies have shown that, in practice, maximum y ield per hectare under continuous stocking is achieved in a sward maintained at a sward surface height of 4 to 6 cm (Bircham and Hodgson, 1983). 2.2.3.2. Continuously stocked swards. In its simplest form continuous grazing describes a situation where animals maintain access to a single, often extensive area for a large proportion of the grazing season. Although the defoliation of the sward is not uniform (Harris, 1978), animals are continuously present and so have a continuous effect on the uptake and loss of matter. Changes in leaf area index and in the rates of photosynthesis, tissue production, herbage intake and death are characteristically gradual (Parsons, 1988). The structure of the grass sward varies considerably in response to management. Swards maintained by continuous stocking at low LAI, or low sward height, are characterized by a large number (40-60,OOO/sq-m) of small tillers. By contrast, swards maintained by continuous defoliation at a greater LAI, or greater sward height, are characterized by smaller numbers ( l O-15,OOO/sq-m) of large tillers (Parsons, 1988). These morphological adaptations have important consequences to the pattern and severity of defoliation experienced by individual plants in the sward. When a sward of a high LAI, and a small number of large tillers, is defoliated to a height of 3 em, this results in the loss of a substantial proportion of the leaf tissue and the expansion and restoration of leaf area depends on reserves (Davies, 1965; Davidson and Milthorpe, 1966). The effects of defoliation height on regrowth are particularly well illustrated by grazing studies (Bircham and Hodgson, 1983; Grant. et al., 1983), in which stocking rates were varied to maintain different fixed sward heights. Results from these studies showed that shorter swards have more smaller tillers and a slower rate of growth per tiller than longer swards but that, provided the chosen sward height allows the maintenance of a fairly complete canopy, the rate of growth per unit area remains much the same. These relationships are well illustrated in Fig 2. 2 (Bircham and Hodgson, 1983). Increasingly inefficient harvesting of this growth by the animals at greater sward height leads, however, to the loss of a greater percentage of the herbage grown to senescenC e. This results in a reduction in the rate of net herbage accumulation, which in this instance equals herbage consumption by the animal since there is no change in the height or weight of standing green herbage. Between the.
(34) 13. limits set, on the one hand, by lack of sufficient ground cover to intercept light and, on the other hand, by inefficient harvesting, differences in maintained sward height or weight do not greatly influence herbage consumption per unit area. The range of sward conditions over which this holds true appears to include levels of standing green herbage from 700 to 1400 kg/ha (Bircham and Hodgson, 1983), and sward heights from 2 to 6 cm (Grant,et al., 1983). Further adaptation to very close grazing may be possible where tiller populations are built up gradually over a period of some years (Parsons, et al., 1983). Efficiency of harvesting by animals seems to vary also from experiment to experiment. The proportion of herbage grown which is lost to senescence has varied from 20% to 25% (Grant, et al., 1983a; grazing by mature wethers), to 50% (Bircham and Hodgson, 1983; grazing by lambs), and 50%. to. 60% (Parsons, et al.,1983; grazing. by yearling wethers). The subject is one which needs further investigation. Additionally, a number of factors modify the general pattern of response to the intensity of defoliation. First, the pattern of uptake and loss of tissue in relation to LAI is greatly influenced by season (Brougham, 1958). Second, production per hectare also decreases in swards maintained by lenient grazing, as the distribution of LAI in the swards becomes less uniform as the season progresses (France et al., 1981). Third, the amount harvested by animals from a continuously grazed sward depends heavily on the behavioral response of animals to the morphological characteristics of the crop (Arnold, 1964; Williams et al., 1976), a response which varies with the physiological status of the animals involved (Arnold and Dudzinski, 1967; Arnold, 1975). 2.2.3.3. The effect of changing sward conditions. The effect of changes in herbage mass on subsequent rates of net herbage accumulation is of particular interest. Bircham and Hodgson (1984) investigated rates of growth and senescence in high and low mass swards which were respectively either grazed down to low mass (HL) or allowed to grow until a high mass had accumulated (LH). The period of adjustment allowed before measurements commenced was 3.5 weeks. Net herbage accumulation was similar from both steady-state treatments and the LH treatment, but was greatly reduced in treatment HL in which there were fewer tillers and growth per tiller was at the reduced level characteristic of a low-mass sward. Other evidence (Grant at al., 1983b) showed that the short, densely tillered LH swards may, in the short term, combine high rates of growth per tiller with high tiller populations before tillers die in response to increasing herbage mass. Successful exploitation of this temporary advantage may underlie reports of increased production from variable cutting height systems (Smith, 1968; Ollerenshaw and Hodgson, 1977). Pasture density can be modified in spring by grazing management. For example, the results of L'Huillier (1987c), working with dairy cows on perennial ryegrass and white.
(35) 14. clover pasture, showed that frequently grazed swards (12-day rotation and set stocked treatments) had higher sward density and proportion of white clover and lower proportion of dead herbage at the end of the treatment period than swards grazed at a 30 day interval. Net herbage accumulation of set stocked and 12-day rotation swards was lower than 30-day rotation swards (L'Hullier, 1987c). This reflected a greater degree of "control" of reproductive tiller development and thus lower net herbage , accumulation of this component and pseudostem (L Hullier, 1987c). 2.2.3.4. Intermittent defoliation. In contrast with continuous grazing, in which LAI and the components of the uptake and loss of matter change only gradually with time, intermittent defoliation is characterized by marked fluctuations in LAI and in the rate processes involved in the uptake and loss of matter during each cycle of regrowth and defoliation. Moreover, not only does the rate of uptake and loss change during each cycle, but there are also marked changes in the relationship between these processes as the cycle proceeds (Parsons, 1988). The principal effect of variations in the severity of defoliation is on the degree to which successive harvests interrupt light interception and photosynthesis, and so limit the supply of assimilates for growth. Brougham' s experiments (1956, 1957) described the principal effect of variations in the severity of defoliation on the restoration of leaf area and light interception. In Brougham's experiments a sward grown to a height of 22 cm was subdivided and defoliated to three different heights: 12.5, 7.5, and 2.5 cm. The results showed that an increase in the severity of defoliation not only leads to a greater reduction in light interception immediately following defoliation, but also extends the time taken by the sward to regain full light interception. The swards defoliated to 12.5 cm took only 4 days to regain full light interception, whereas those defoliated to 7.5 and 2.5 cm took 16 and 24 days, respectively. This phenomenon is illustrated in Fig 2.3a (Johnson, et al. 1983; Johnson and Parsons, 1985), using a mechanistic model of grass production and senescence. It is clear that the effects of the severity of defoliation on photosynthesis and gross tissue production follow broadly the same patterns as those observed by Brougham for light interception (Parsons, 1988). The rate of loss of tissue by death depends on the size and the rate of turnover of the oldest category of tissue in the sward (Morris, 1970). An increase in the rate of loss by death has been observed during periods of regrowth in the field (Hunt, 1970; Grant et al., 1981a) and under controlled environment conditions where earthworms and fauna are absent (Robson, 1973 a,b). This increase in the rate of death is predominantly the result of an increase in the size of leaves involved in the turnover of tissue (Hunt,.
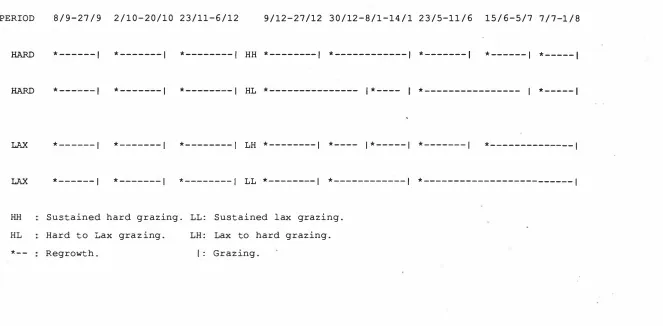
(36) 15. 1965; Robson, 1973b). However, prolonged periods at a high LAI towards the end of a period of regrowth may lead to losses of tissue over and above those which result from the inevitable turnover of leaves and tillers. In dense swards the mutual shading of tillers may lead to an accelerated senescence of small tillers, or whole plants, as natural thinning occurs (Kays and Harper, 1974; Ong, 1978). The principal effects of the severity of intermittent defoliation on the rate of loss of tissue by death is also illustrated in Fig 2.3b (Johnson and Thomley, 1983; Johnson and Parsons, 1985 a), using the same mechanistic model of grass production and senescence. The model demonstrates how an increase in the severity of defoliation leads to a decrease in the rate of death immediately following defoliation and also extends the time taken for the sward to regain maximum death rates (that is, the time when death rate equals the gross rate of production of tissue and a ceiling yield is achieved). The broad similarity between the pattern of loss of tissue to death and the pattern of gross tissue production is more than coincidental. Regardless of the severity of defoliation, the rates of photosynthesis and death immediately following defoliation are both a reflection of the size of leaves remaining in the stubble, albeit in the case of photosynthesis and shoot growth it is the size of the youngest category of leaves that is most significant, whereas in the case of death it is the size of the oldest category of leaves that is important. Also, regardless of the severity of defoliation, a sward which takes a long time to regain full light interception and maximum rate of gross tissue production will take a long time to regain maximum death rates. This is because changes in the rate of death must lag behind changes in the rate of gross tissue production (Parsons, 1988).
(37) 16 la) 12. .�. :J M '0 '. � �. e2 0. )( �i. .� � 11». .... ... 11) '. �E a,u. -.- 01. o�. Q) .... ItI a:. O L-------�� .. T ime e l a psed since previous defoliation. Ib ) 12. O�------�Time e l apsed si nce previous defol ia tion. Figure 2.3 The effects of three severi ties of i n termi ttent defoliation on (a) the rate of gross tissue production and. (b). the ral� of loss of tissue to death , as illustrated using. a mechanistic Illodel of grass production and senescence . The illustrations cover the period ulltil tl�e sward has reached 95% of i ts ceiling weight..
(38) 17. 2.2.3.5. The duration of regrowth in an intermittently grazed sward. Parsons,et al. (1988) studied the effect of the duration of regrowth on photosynthesis, leaf death and the average rate of growth in rotationally grazed swards. They reported that the average growth rate (based on change in the weight of lamina alone) increased as the duration of regrowth was extended from 12-13 to 19-23 days, but changed little as the duration of regrowth was extended from 19-22 days to 30-34 days. In spring and summer, elongation of reproductive stems increased the average growth rate (of lamina plus stem) up to 30-40 days but the accumulated stem material could not reliably be harvested by sheep. L'Huillier (1987c) reported that net herbage accumulation of set stocked and 12-day rotation swards was lower than 30-day rotation swards. Parsons, et al (1988) suggested regrowth of at least 14 days but less than 28 days will be effective in achieving not only close to the maximum average growth rate of highly digestible material, but also in sustaining a densely tillered, leafy sward which regrows rapidly from severe defoliation and is more reliably harvested by sheep. In practice, conscious rationing of pasture to animals (restricting their intake) means pasture can be accumulated, transferred and used at a later date. This management strategy is most often used in New Zealand during winter when long rotations (60-100 days) are adopted to 'spin-out' autumn pasture and build up pasture mass for lambing and calving. Rationing also helps to buffer summer feed deficits, and enables transfer of pasture to nutritionally important periods such as early lactation and pre-mating (Sheath, et al., 1987). In New Zealand cold winter environments such as in Otago and Southland where winter pasture growth rates are very low, rotation lengths of 80-100 days. are. required.. In warmer winter enviroments where pasture growth rates are relatively high (10-15 kg DM/ha/d), current growth can be sufficient to allow for a 50-80 day rotation (Sheath, et al., 1987). Successful transfer and allocation of pasture is more difficut during late spring, summer and autumn, particularly in dry conditions. Long rotations leading into and during dry summer periods can help reduce the impact of summer deficits by transferring surplus, late spring pasture. However, prior to dry conditions there is a danger of accumulating excess pasture to the subsequent detriment of pasture density and species composition. Furthermore, decline in pasture quality will occur under dry conditions, so there is the dilemma of whether to feed stock well while high pasture quality exists or to save pasture for subsequent maintenance feeding (Sheath, et al., 1987). 2.2.3.6. Regrowth in relation to time of defoliation. The importance of the timing of spring cuts in relation to stage of development was clearly shown by Davies (1965) in his comparison of regrowth in an early- and a later-.
(39) 18. flowering timothy. Only the actual reproductive tiller elevate theirs apices in perennial ryegrass, and the situation is very similar in timothy. Regrowth after a cut on 1 9 May which removed 4% of the tiller apices was 4240 kg DM/ha, whereas a cut on 8 June, which removed 32% of the tiller apies (and probably destroyed virtually all of the seasons reproductive tillers) produced only 1 930kg DM/ha of regrowth (Davies, 1 973). Behaeghe ( 1 974) showed clear evidence of a lag phase after mature reproductive swards were cut in early June. Comparable swards subjected to several earlier cuts were almost completely vegetative in character and regrew immediately. There was little difference in regrowth between these swards at a later cut, and it seems possible that once swards have recovered from a cut during the main reproductive phase, then further total growth m ay be relatively independent of the earlier cutting regime (Davies, 1 969; Binnie, et aI., 1980).. 2.2.4. Summary In this section the influence of changes in plant morphology, sward structure, and pasture production after cutting or grazing have been considered. Some indication has been given of how regrowth depends on the initial resources of leaf area and, when demands cannot be met by rates of current photosynthesis, on carbon compounds present in the stubble. An account has been given of how and when the accumulation of dry matter in new leaves is offset by losses of older leaves present in the stubble or accumulating during regrowth. Evidence has been presented showing how tiller populations are related to the level of herbage mass which is allowed to accumulate. However, the changing morphology of the plant strongly influences its response to defoliation in both the shorter and longer term. The structure of the grass sward varies considerably in response to defoliation; and the sward is capable of a high degree of adaptation to management (Davies, 1 988). In view of the complexity and plasticity of the response of the grass crop to defoliation, no single recipe for production can hold true under any but the most limited circumstance. In practice the need to sustain fluctuating livestock numbers against a background of seasonal variation in production requires a more flexible approach. An understanding of the physiological principles of the effects of defoliation on the uptake and loss of matter in the grass crop, supported by an appreciation of the importance of avoiding a marked deterioration in sward structure, will enable farmers to make their own management decisions as best suit their objectives and the changing conditions they experience. Such an understanding should increase the reliability and efficiency of production of the grass crop, and so increase confidence in the use of grass as an inexpensive feed stuff for ruminant production (Parsons, 1988)..
(40) 19. 2.3. Characteristics of selected species and comparison between them.. Much of the evidence which has been presented was derived from perennial ryegrass, information on other temperate grasses being much less complete. Less still is known about tropical grasses, though it i s clearly e vident that their response in the reproductive phase of development can vary widely (Davies, 1988). In the following sections a more detailed appraisal is given of the m orphology and growth characteristics of perennial ryegrass, prairie grass and smooth bromegrass, the three grass species used in field studies in this thesis, tog ather with a comparison of their response to defoliation. 2.3.1. Perennial ryegrass (Lolium perenne. L). Perennial ryegrass (Lolium perenne. L) is a long-lived perennial capable of producing very many tillers. The plant is nutritious and palatable and stands up to hard grazing. It will not do well under poor conditions, where fertility or rainfall is low. It requires an annual rainfall of between 850 and 1030 mm (34 and 4 1 in) and a mild climate during the growing season. Ryegrass/white clover pastures grow extensively throughout New Zealand (Korte, et al., 1 987). In vegetative swards, the mean number of living leaves per tiller rarely exceeds three (Hunt, 1 965 ; Alberda and Sibma, 1 968) and the production of a fourth leaf tends to be counterbalanced by the loss of the first one (Davies and Calder, 1969; Davies, 197 1 ). Vegetative stems. are. almost erect at first but. become decumbent as the primary axes grow. EacQ stem has an apical region about 1 cm long producing leaves at succes sive nodes and tiller buds in each leaf axis. Internodes just below this apical region elongate, separating the bases of individual tillers by up to 2 cm (Spedding, et al. 1 972). Ryle ( 1 964) recorded that perennial ryegrass leaves were relatively narrow (4mm) and up to about 1 80 mm long, increasing steadily in size from the first to the 7th leaf of a tiller; each tiller, however, had no more then three leaves at any one time. Anslow (quoted in Spedding, et al. 1972) showed tiller weights of 2.0 - 2.9 g/1000 tillers for S24 and 1 .0 - 3.0g/1000 tillers for S23 at population densities of 77- 103 and 77-223 tillers/sq-dm, respectively, under conditions of irrigation and high N input over the whole year. The cultivar Ellett was used in this experiment. Ellett was developed from a naturally ocurring selection (ecotype) at Mangere, South Auckland New Zealand. It was first evaluted as a regional ecotype by the Ministry of Agriculture. Yates Research Division extended the Trial network to include the main climatic regions of New Zealand. Ellet was placed on the Acceptable Herbage Cultivar list in 1980 (Duder, 1986). Ellect is a semi-erect, multi-tillered, broad leaved, perennial plant with dark green glossy leaves. It is early flowering, with a high seed yield potential (Duder, 1986). The literature review of effects of defoliation on pasture production in this chapter refers mainly to ryegrass pastures (section 2.2). In summary, a ' homeostatic'.
Figure
+7
Related documents
The paper assessed the challenges facing the successful operations of Public Procurement Act 2007 and the result showed that the size and complexity of public procurement,
Heterologous bone graft material (Osteoplant-Flex) is thought to be a good alternative to autologous grafts in de- creasing relapse rates and reducing the morbidi- ty of the
21 Department of Neurosurgery, Tangdu Hospital, The Second Affiliated hospital of the Fourth Military Medical University, 1 Xinsi Road, Xian, Shanxi Province 710038, People ’ s
The purpose of the study was to compare student outcomes (final grades and course evaluation ratings) for equivalent courses in semester long (15-week) versus intensive (7-week)
Centers for Disease Control and Prevention; EHR: Electronic health record; EMR: Electronic medical record; GHC: Group health centre; ITS: [Niagara Region] information
It was decided that with the presence of such significant red flag signs that she should undergo advanced imaging, in this case an MRI, that revealed an underlying malignancy, which
Therefore the aim of this observational study was to assess the utility of the MYMOP2 and W-BQ12 health outcomes measures for measuring clinical change asso- ciated with a course
Also, both diabetic groups there were a positive immunoreactivity of the photoreceptor inner segment, and this was also seen among control ani- mals treated with a
