Adipose tissue FABP deficiency
promotes metabolic reprogramming
and positively impacts healthspan
The Harvard community has made this
article openly available.
Please share
how
this access benefits you. Your story matters
Citation Charles, Khanichi Nona. 2014. Adipose tissue FABP deficiency promotes metabolic reprogramming and positively impacts healthspan. Doctoral dissertation, Harvard University.
Citable link http://nrs.harvard.edu/urn-3:HUL.InstRepos:11744425
Terms of Use This article was downloaded from Harvard University’s DASH repository, and is made available under the terms and conditions applicable to Other Posted Material, as set forth at http://
Adipose tissue FABP deficiency promotes metabolic reprogramming and
positively impacts healthspan
A dissertation presented
by
Khanichi Nona Charles
to
The Committee on Biological Sciences in Public Health
in partial fulfillment of the requirements
for the degree of
Doctor of Philosophy
in the subject of
Biological Sciences in Public Health
Harvard University
Cambridge, Massachusetts
©
2013 Khanichi Nona CharlesDissertation Advisor: Professor Gökhan Hotamişligil MD, Ph.D. Khanichi Nona Charles
ADIPOSE TISSUE FABP DEFICIENCY PROMOTES METABOLIC
REPROGRAMMING AND POSITIVELY IMPACTS HEALTHSPAN
ABSTRACT
The adipose tissue lipid chaperones aP2 and mal1, also known as fatty acid
binding proteins (FABPs), are significant molecules contributing to metabolic
homeostasis, whereby their absence promotes physiological changes that improve
systemic metabolism. Identification of palmitoleate as a lipokine generated in
aP2-mal1 deficiency—originating from adipose and directing the lipogenic program in
liver, established a role for these chaperones in linking adipocyte and hepatic
function. We have recently demonstrated a functional role for secreted aP2 in the
activation of gluconeogenesis and hepatic glucose output, further designating this
molecule as an adipocyte-derived regulatory factor that influences liver
metabolism. Key molecules linking the metabolism of nutrients in energy
generating pathways are the nucleotide cofactors NAD and NADH. Together, these
molecules function to coordinate the maintenance of redox reactions during
normal cellular metabolism and act as required substrates for enzymes such as
sirtuins and poly ADP-ribose polymerases. Using global metabolite profiling, we
reprogramming in liver. We demonstrate that this reprogramming of metabolite
flux is accompanied by significant alterations in liver NAD metabolism and
establish a role for aP2 in directing substrate utilization through inhibition of the
rate-limiting enzyme for NAD synthesis, nicotinamide phosphoribosyltransferase.
Several models for the proposed regulatory pathways that link nutrient
metabolism to aging include mechanisms that are NAD dependent. Accordingly,
we found that long-term FABP deficiency confers a strong resistance to aging
related metabolic deterioration. Together, the findings presented in this thesis
support a considerable role for FABPs in the regulation of NAD metabolism and
TABLE OF CONTENTS
CHAPTER 1: INTRODUCTION
Metabolism and aging 2
Growing old: healthspan vs. lifespan 2
Metabolic and molecular links to aging 3
Genetic models of extended lifespan 5
Adipose tissue in healthspan and lifespan 7
Physiological roles of the adipocyte in metabolic stability and plasticity 8
Conventional functions 8
Adaptive responses 10
Maladaptive responses 11
Adipose tissue fatty acid binding protein 4 12
Expression and tissue distribution 12
Lipid chaperoning activity 13
Impact on systemic metabolism 14
Preview of thesis 15
References 16
CHAPTER 2: ADIPOSE TISSUE FABP DEFICIENCY PROFOUNDLY IMPACTS LIVER NAD METABOLISM Background 23
Liver nicotinamide metabolism and NAD/NADH ratio is altered in FABP
deficiency 32
Citric acid cycle activation contributes to altered NAD/NADH ratio 35
Metabolic reprogramming in FABP deficiency 40
aP2 influences substrate preference in hepatocytes 48
aP2 regulates hepatic Nampt in vitro and in vivo 52
Discussion 58
Materials and Methods 63
aP2-mal1-/- mouse model 63
Targeted Liquid-Chromatography Mass Spectrometry (LC/MS) 63
Quantitative PCR and Western blotting 64
NAD/NADH nucleotide levels 65
Glycolysis and Fatty Acid Oxidation measurements 65
Cell culture studies 65
Sirtuin deacetylase activity 66
Primary hepatocyte isolation 66
Intra venous aP2 infusion 67
Statistical analysis 67
References 67
CHAPTER 3: ROLE FOR FABPs IN HEALTHSPAN AND LONGEVITY Background 73
Results 74
Long-term survival 79
Metabolic fitness in aged mice 81
White adipose tissue 83
Liver 83
Glucose homeostasis 83
Physical appearance in aged mice 90
Metabolic challenge in aged mice 90
Discussion 94
Materials and Methods 97
Comparison of adipose tissue transcriptome and lipidome in dietary-restriction and FABP deficiency 97
Longevity Experiments 99
Glucose and insulin tolerance tests 99
References 100
CHAPTER 4: NEW PERSPECTIVES AND CONCLUSION POINTS Effects of aP2 inhibition on NAD metabolism may confer stress resistance 106
aP2 as a potential therapeutic target and biomarker for metabolic aging 112
Materials and Methods 115
Reactive oxygen species and DNA damage detection 115
DEDICATION
For my family: a curious bunch.
ACKNOWLEDGEMENTS
Many thanks, to Dr. Charlie Dong and members of his laboratory for
providing the Nampt Luciferase promoter construct, and also to Dr. Atsuo Sasaki
for facilitating metabolite measurements. I am equally appreciative to Dr. James
Nelson and his colleagues at the Barshop Institute for Longevity and Aging Studies,
for their completion of healthspan studies.
I would also like to express my gratitude towards members of the
Department of Genetics and Complex Diseases, the Biological Sciences in Public
Health program, and members of the greater Harvard community, for their keen
intellect and scientific expertise, especially Drs. Jay Mitchell, Curtis Huttenhower,
and Pere Puigserver. I am grateful to all of you.
Much of my appreciation is reserved for Gökhan S. Hotamişligil and
members of the GSH lab, past and present. It was a pleasure to work amongst this
most wonderful group of mentors that harbored such boundless curiosity, desire,
and imagination. This work is, in part, a reflection of their inquisitive minds,
sensible skepticism, and support over the past 5 years. Thank you for your
friendship.
Most of all…cheers to all of my best friends; To my husband Charlie, my
model of strength and hard work; to my baby girl, her smile fixes everything; K.
LoLo, Sister Sarah and Micheley and James, our bond endured distance and time.
Thanks for the foolishness. And lastly, to my lovely Golden State… thank you for
CHAPTER 1
Chapter 1 Introduction
METABOLISM AND AGING
Growing old: healthspan vs. lifespan
From the moment of creation and until death, all forms of life begin to
experience the processes of aging. For some species, like the Californian
Bristlecone Pine, these processes can occur over thousands of years. For humans
and other higher order organisms, the chronology of aging is much shorter,
marked by periods of physical and cognitive growth, occurring at time-points that
follow the species norm. In advanced adulthood, we begin to experience a decline
in these physical and cognitive abilities, as our adaptive responses begin to loose
efficacy and we become more susceptible to disease. For these reasons, our
perception of age has progressed beyond one that is defined solely by time of
existence, towards one that includes the condition of health. Undoubtedly, illness
prevention has dramatically increased the average healthspan, however, our
maximum lifespan remains limited to roughly 120 years (Ruiz-Torres and Beier,
2005). Though there are many examples of maximal lifespan extension in yeast,
Drosophila and mice, whether significant human lifespan extension can be
achieved beyond the current limit remains to be answered. In fact, dietary
restriction, an intervention shown to have lifespan extending effects in yeast,
Drosophila, and mice, was demonstrated to have limited effects on lifespan in
primates (Mattison et al., 2012). Nevertheless, we endeavor to understand what
Chapter 1 Introduction
death. In doing so, we may be able to design interventions that add meaningful
years to human healthspan.
Metabolic and molecular links to aging
The impact of reliable food sources, protection from environmental insults,
medical advancement, and disease prevention has manifested as a three-fold
increase in average human lifespan (National Center for Health Statistics, 2010).
However, in today’s world, everyday life often includes daily routines marked by
inactivity and nutritionally poor meals that are high in calories. Together, these
lifestyle adjustments have led to a rise in obesity, negatively impacting healthspan
and introducing metabolic syndrome (i.e., insulin resistance, type-2 diabetes, and
atherosclerosis) as a new cause of disease related premature death (Katzmarzyk et
al., 2005). Though it has been possible to identify behaviors and exposures that
lead to metabolic disease, it is difficult to elucidate the underlying mechanisms.
This is due to the immense heterogeneity in genetic composition and
environmental exposures that contribute to the development of metabolic
derangements. Despite this complexity, determining mechanism becomes a more
tractable concept when assayed using genetically identical laboratory species.
Thus far, such studies have revealed insulin and insulin like growth factor 1
Chapter 1 Introduction
activation as putative interventions that oppose the decline in metabolic function
and increase longevity (Cantó and Auwerx, 2011).
The yeast sirtuin, Sir2p was first identified as a mediator of lifespan whereby
mutations that inactivate Sir2p decreased survival, and introduction of a second
copy of Sir2p conferred a 30% increase in replicative life span (Kaeberlein et al.,
1999). It was later determined that expression of Sir2p could be induced by shifting
glucose availability from 2% to 0.5%, a method of dietary restriction in yeast. It is
hypothesized that this form of DR increases Sir2p by initiating a metabolic switch
from fermentation to respiration, creating more NAD from NADH which activates
Sir2p, an NAD-dependent deacetylase (Imai et al., 2000; Lin et al., 2000).
Though mammals possess a Sir2p orthologue (Sirtuin 1), the mechanism(s)
of increased lifespan in mammals is complicated by the nature of an animal’s
ability to respond to changes in energy availability through adaptive changes in
glucose and fat utilization by metabolic tissues. This adaptive response involves
suppression of glycolysis, enhanced liver gluconeogenesis and
glucagon-stimulated degradation of glycogen stores in order to maintain glucose levels
during short-term caloric restriction. Insufficient availability of carbohydrates for
prolonged periods of dietary restriction will stimulate lipolysis and mobilization of
lipids from adipose tissue (Dhahbi et al., 2001). Thus, long-term dietary restriction
results in lower steady state levels of glucose and insulin as well as an overall
Chapter 1 Introduction
Dietary restriction in mammals is typically defined as a 25-60% reduction in
total calories derived from carbohydrates, lipids, and proteins without invoking a
state of malnutrition (Ricketts et al., 1985; Weindruch et al., 1986). Under this
intervention, studies have shown life span extension to increase by as much as
50% in dietary restricted rodents (Sohal and Weindruch, 1996) and to date, this
phenomenon has held true across numerous species including yeast, spiders, flies,
worms, and fish (Ingram et al., 1990). The emerging facts indicate that the benefits
of longevity result from a delayed development of age related diseases, many of
which have known causal links to metabolism such as type 2 diabetes, cancer and
cardiovascular disease (Hursting et al., 2001; Lane et al., 1999; Manco and
Mingrone, 2005). However, two dietary restriction studies spanning several
decades revealed that rhesus monkeys subjected to this intervention displayed
great extension of healthspan, but no increase in survival (Colman et. al. 2009 and
Mattison et al., 2012). Despite much attention surrounding the life extending
effects of DR, the regulatory factors mediating the relationship between a
restrictive diet and postponement of mortality is currently unknown.
Genetic models of extended lifespan
Several genetic models for significantly increased lifespan have been reported over
Chapter 1 Introduction
receptor (Ghrhrlit/lit) or growth hormone receptor binding protein (GHR/BP-/-),
p66shc null mice, and IGF-I receptor heterozygous mice, all of which exhibit altered
hormone secretion in the hypothalamic-pituitary axis (Bartke et al., 1998), and have
been shown to affect many of the same physiological changes that occur during
aging (reviewed in Liang et al., 2003). Dwarf mice, perhaps the most extensively
characterized genetic models of longevity, consist of a collection of mutants that
include both Snell and Ames mice, harboring point mutations in the pituitary
specific transcription factor 1 gene (Pit1) and the Prop-1 gene upstream of Pit1,
respectively. Each of these mutations result in poor secretion of growth hormone,
thyroid-stimulating hormone, and prolactin, an outcome related to defective
differentiation of their respective hormone secreting cells in the anterior pituitary.
In addition to the expected growth phenotype as a consequence of lacking growth
hormone, these mice also have a reduced metabolic rate and core body
temperature, lower circulating levels of insulin, IGF-1 and glucose, and an overall
increase in resistance to oxidative stress (Dominici et al., 2002). Expression profiling
of liver tissue in Ames mice, which live up to 40-70% longer than their wild type
counterparts (Brown-Borg et al., 1996) and dietary-restricted mice, revealed both
separate and overlapping gene clusters that may represent clues towards the
Chapter 1 Introduction
Adipose tissue in healthspan and lifespan
Given the central role of adipose tissue in communicating the nutritional
environment to peripheral tissues and in directing systemic energy flow, it is
unsurprising that major energy shifts, such as one induced by dietary restriction,
highly impact adipose tissue function. The opposite is also true, as dramatic
alterations in adipose tissue function greatly influence systemic metabolic
responses to nutritional inputs. Decreased adiposity is associated with the
activation of genes involved in carbohydrate, amino acid, lipid, and mitochondrial
energy metabolism; each serving to expend energy. Adiponectin expression,
which is reduced in obese humans and insulin resistant rodents (Hu et al., 1996),
increases upon loss of fat mass (Yang et al., 2001). Furthermore, surgical excision
of white adipose tissue reverses hepatic insulin resistance that is induced by
obesity and aging (Barzalai 1999 and Gabriely 2002).
Taken together, a reduction in adiposity is followed by increased expression
of genes involved in peripheral tissue insulin sensitization and systemic energy
expenditure. Yet, many ambiguities remain in determining the relationship
between adipose tissue and the aging process. In fat-specific insulin receptor
deficient mice, which have ~50% reduction white adipose tissue, similar caloric
intake, and significantly longer lifespans than their wild type counterparts (Bluher
et al., 2003), lifespan extension mediated by dietary restriction was shown to be
Chapter 1 Introduction
PHYSIOLOGICAL ROLES OF THE ADIPOCYTE IN METABOLIC STABILITY AND
PLASTICITY
Conventional Functions
Adipose tissue stores energy in the form of triglyceride (TG) filled lipid droplets,
adjusting release of its contents based on the substrate requirements of peripheral
tissues. Triglycerides are presented to the adipocyte in the form of dietary
chylomicrons or liver derived lipoprotein particles and hydrolyzed through the
action of lipoprotein lipase at the cell surface. When peripheral tissue substrate
demands trigger hormonal signals that lead to adrenergic pathway activation, free
fatty acids are liberated from lipid droplets via hydrolysis of TGs. In addition to the
adipocyte, matrix fibroblasts, vascular endothelium, and a variety of immune cells
all comprise the adipose tissue organ. Together, these cell types actively secrete an
array lipids and proteins, termed adipokines, that function as key effectors of
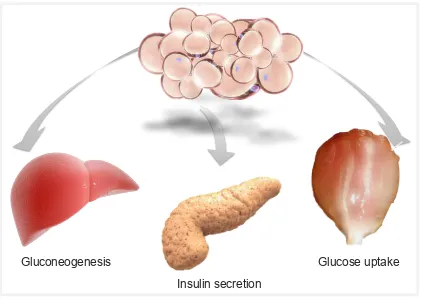
adaptive responses to metabolic alterations in peripheral tissues (Figure 1-1). For
example, the earliest identified adipokines, leptin and adiponectin, influence
energy homeostasis at multiple sites in the periphery. Leptin does so by binding to
receptors in the hypothalamus to signal satiety and reduce food intake.
Adiponectin receptors are more ubiquitously expressed, and their activation is
associated with improved insulin sensitivity and increased fatty acid oxidation. In
Chapter 1 Introduction
Figure 1-1. Adipose tissue influence on systemic metabolism. Insulin secretion
Gluconeogenesis Glucose uptake
-/-Chapter 1 Introduction
adiposity and insulin resistance. This natural ebb and flow of adipokine secretion
and systemic lipid flux occurs most prominently during feeding, fasting and
exercise, necessitating a range of adipose tissue adaptive responses to maintain
functional integrity of the adipocyte and proper communication with peripheral
tissues.
Adaptive responses
The regulation of adipose tissue lipid content during fasting and increased
energy expenditure is crucial for supporting the heightened demand for fuel
substrates. For example, decreased insulin and increased glucagon stimulates
adipose tissue lipolysis and subsequent release of free fatty acids to supply
peripheral tissues, as an adaptive response to insufficient food intake. During
exercise, the brain signals release of catecholamines, which stimulates lipolytic
activity in the adipocyte and supplies working muscle with sufficient substrate
levels needed to sustain the high levels of oxidation required for ATP generation.
Interestingly, in lactating mice, strong evidence exists that the unfolded protein
response transcription factor XBP-1 is required to maintain lipogenic gene
expression and milk production by adipose derived mammary tissue, in response
Chapter 1 Introduction
The ability to properly access these adaptive responses is affected by a
variety of factors; among them are body fat percentage and composition of fatty
acids in triglyceride reserves. (Sial et al., 1996, Fabbrini et al., 2012).
Maladaptive responses
Though adipose tissue is capable of expanding to accommodate excess energy,
like all tissues, there is a limit to the functional capacity of this organ. Nutritional
overload directly impacts adiposity, and induces both qualitative and quantitative
changes in the adipocyte lipid droplet. Together these effects trigger anomalous
metabolic behaviors, with major consequences on glucose and lipid homeostasis.
First, the constant burden of overnutrition overwhelms the capabilities of the
adipocyte and leads to ectopic lipid accumulation in circulation and the
surrounding periphery. The presence of lipids in tissues that are not functionally
equipped to deal with them can trigger dysfunction by exhausting the oxidative
capacity of the organ, activating inflammatory mediators, altering organelle
membrane composition and depositing toxic lipid species within cellular matrices
(Navina et al, 2011). Secondly, endocrine function of many classical secretory
organs is compromised in obesity (i.e. pancreatic insulin secretion), including
adipose tissue adipokine release (Guilherme et al., 2004). These factors designate
Chapter 1 Introduction
suitable site for identification of molecules that support the maintenance of
systemic metabolism.
ADIPOSE TISSUE FATTY ACID BINDING PROTEIN 4
Expression and tissue distribution
The fatty acid binding proteins (FABPs) are a small 14-15kDa family, comprised of
10 members, with ubiquitous tissue distribution. While the degree of functional
redundancy for all isoforms remains to be determined, it is known that some
tissues strongly express one or multiple isoforms. For example, a single isoform,
FABP5 can be found in the eye, whereas the ileum expresses high levels of FABPs
1,2 and 6. In other tissues like testis and adipose, expression is dominated by a
single isoform, but also exhibits minor expression of one or more additional FABP
family members (Yamamoto et al., 2009). The predominant adipose tissue isoform
is FABP4 or adipocyte protein 2 (aP2). Expression of aP2 correlates with fat
accretion, as levels rise during adipocyte differentiation as well as in the
inflammatory and obese states (Hotamisligil, 2006). Also expressed in adipose
tissue is FABP5, or epidermal fatty acid binding protein (mal1). Each of these
isoforms are co-expressed in adipocytes and macrophages, however adipocyte aP2
expression is roughly 10, 000-fold higher than macrophage aP2 expression (Shum
Chapter 1 Introduction
Lipid chaperoning activity
Adipocyte fatty acid binding protein, aP2, preferentially binds long chain fatty
acids, and has a weaker affinity towards shorter chain fatty acids and some
carboxylate derivatives (Furuhashi and Hotamisligil, 2008). The putative role of
cytosolic fatty acid binding proteins, based on their ability to bind fatty acids and
other lipids species, is to facilitate the intracellular trafficking of lipids to various
organelles and cellular structures for their use as fuel substrates, membrane
components, precursors for more complex lipids, or for storage in the lipid droplet.
They may also function to present lipid ligands to proteins in the nuclear receptor
family for downstream transcriptional activation. Adipocyte fatty acid binding
protein aP2 has been linked to a variety of biological mechanisms, as mediators of
both lipid trafficking and lipid-derived inflammatory signaling. For example,
re-localization of aP2 from the cytosol to nucleus has been observed upon exposure
to fatty acid ligands known to function as peroxisome proliferator-activator
receptor gamma (PPARγ) targets. indicating a potential role for aP2 in
transcriptional activation by nuclear receptors (Nguan-Soon Tan et al., 2002).
Furthermore, Erbay et al. (2009) demonstrated that macrophage aP2 was an
important mediator of lipid-induced ER stress, and that macrophage aP2 deficiency
was sufficient to protect against apoptosis and atherosclerosis caused by
Chapter 1 Introduction
Impact on systemic metabolism
Mice deficient in adipose tissue fatty acid binding proteins aP2 and mal1
demonstrate a surprising level of protection against obesity, and the development
of atherosclerosis, insulin resistance, and type 2 diabetes when given a high-fat
diet (Hotamisligil et al., 1996; Maeda et al., 2005). This is not surprising, given that
adipose tissue is a crucial metabolic site, essential to the integration of signal
inputs generated in the context of multiple dietary paradigms such as high-fat diet,
short-term fasting, and long-term caloric restriction. Furthermore, adipose tissue
fatty acid binding proteins facilitate the intracellular movement of lipids for their
use in membrane formation, metabolic signaling and storage, all of which have the
potential to impact the endocrine and systemic lipid trafficking functions of the
adipocyte (Furuhashi and Hotamisligil, 2008).
Work from our lab and others has demonstrated a profound impact of FABP
deficiency on adipose tissue and plasma lipid composition (Baar, et al., 2004;
Maeda et al., 2005; Cao et al., 2008), and a unique ability for FABP deficiency to
promote secretion of a specific lipid species, palmitoleate (Cao et al, 2008). The
absence of aP2 and mal1 stimulates adipose tissue de novo lipogenesisand
synthesis of palmitoleate, a monounsaturated fatty acid with minor dietary orgins
(Cao et al., 2008). This lipid was demonstrated as a novel adipokine having
hormone like effects, as evidenced by its ability to suppress hepatic lipogenesis
Chapter 1 Introduction
While these proteins have been thought to be mainly cytosolic, given that
many of the striking phenotypes in adipose tissue FABP deficiency were observed
in the periphery, it seemed reasonable that these proteins could also be secreted
to function in an endocrine manner. As such, secreted aP2 was recently
demonstrated to regulate hepatic gluconeogenesis through upregulation of
gluconeogenic gene expression (Cao et al., 2013).
Together, these data exposed two important features of the adipocyte. First,
it revealed the capability of adipocytes to emit specific lipid signals that directly
impact systemic metabolism. Secondly, it designated FABPs as molecules that link
adipose tissue metabolism to peripheral tissue function.
PREVIEW OF THESIS
By developing the adipose tissue organ, we have evolved distinct mechanisms to
both amass and re-distribute energy surplus. However, the efficient regulation of
adipose tissue lipid content still requires the complex integration of
environmental, hormonal, and nutritional inputs from the entire organ system.
In the next 10 years, over half of the human population is expected to be obese.
Thus, a fundamental understanding of the adipose tissue contribution to systemic
metabolism is crucial to our ability to understand the functional limitations of this
Chapter 1 Introduction
Our approach is to examine the role of adipose tissue FABPs in the
regulation of systemic metabolic circuitry through global metabolic profiling by
using a mouse model deficient in the FABPs aP2 and mal1. Furthermore, given that
these animals exhibit a remarkable protection against obesity and the associated
co-morbidities, we aimed to use this genetic model to aid in our efforts in
determining how protection from a decline in metabolic tissue function impacts
survival and healthspan.
REFERENCES
Baar RA, Dingfelder CS, Smith LA, Bernlohr DA, Wu C, Lange AJ, Parks EJ. (2004) Investigation of in vivo fatty acid metabolism in AFABP/aP2(-/-) mice. Am J Physiol Endocrinol Metab. 2005. 288, 1,187-193.
Bartke, A., Brown-Borg, H. M., Bode, A. M., Carlson, J., Hunter, W. S., and Bronson, R. T. (1998) Does growth hormone prevent or accelerate aging? Exp Gerontol 33, 675-687.
Barzalai N, Gupta G. (1999) Revisiting the Role of Fat Mass in the Life Extension
Induced by Caloric Restriction. J Gerontol A Biol Sci Med Sci. 54 (3): B89-B96.
Bertrand, H. A., Lynd, F. T., Masoro, E. J., and Yu, B. P. (1980) Changes in adipose mass and cellularity through the adult life of rats fed ad libitum or a life-prolonging restricted diet. J Gerontol 35, 827-835.
Bluher M, Kahn BB, Kahn CR. (2003) Extended longevity in mice lacking the insulin receptor in adipose tissue. Science 299:572–74.
Chapter 1 Introduction
Cao, H., Gerhold, K., Mayers, J. R., Wiest, M. M., Watkins, S. M., and Hotamisligil, G. S. (2008). Identification of a lipokine, a lipid hormone linking adipose tissue to
systemic metabolism. Cell 134, 933-944.
Cao, H., Sekiya M., Ertunc, M. E., Burak F., Mayers J.R., White A., Inouye K., Rickey L.M., Ercal B.C., Furuhashi M., Tuncman G., Hotamisligil G.S. (2013) Adipocyte lipid chaperone aP2 is a secreted adipokine regulating hepatic glucose production. Cell Metab 17, 768-778.
Colman, R.J., Anderson, R.M., Johnson, S.C., Kastman, E.K., Kosmatka, K.J., Beasley, T.M., Allison, D.B., Cruzen, C., Simmons, H.A., Kemnitz, J.W., et al. (2009) Caloric restriction delays disease onset and mortality in rhesus monkeys. Science 325, 201-204.
Dhahbi, J.M., Mote, P.L., Wingo, J., Rowley, B.C., Cao, S.X., Walford, R.L., and Spindler, S.R. (2001) Caloric restriction alters the feeding response of key metabolic enzyme genes. Mech. Ageing Dev., 122, 35-50.
Dominici, F. P., Hauck, S., Argentino, D. P., Bartke, A., and Turyn, D. (2002) Increased insulin sensitivity and upregulation of insulin receptor, insulin receptor substrate (IRS)-1 and IRS-2 in liver of Ames dwarf mice. J Endocrinol 173, 81-94.
Erbay E, Babaev VR, Mayers JR, Makowski L, Charles KN, Snitow ME, Fazio S, Wiest MM, Watkins SM, Linton MF, Hotamisligil GS. (2009) Reducing endoplasmic
reticulum stress through a macrophage lipid chaperone alleviates atherosclerosis. Nat Med. 15,12: 1383-1392.
Furuhashi, M., and Hotamisligil, G. S. (2008) Fatty acid-binding proteins: role in metabolic diseases and potential as drug targets. Nat Rev Drug Discov 7, 489-503.
Chapter 1 Introduction
Gabriely, I., and Barzilai, N. (2001) The role of fat cell derived peptides in age-related metabolic alterations. Mech Ageing Dev 122, 1565-1576.
Guilherme A, Virbasius JV, Puri V, Czech MP. (2008) Adipocyte dysfunctions linking obesity to insulin resistance and type 2 diabetes. Nat. Rev. Mol. Cell Biol. 9, 367– 377.
Hotamisligil, G. S., Johnson, R. S., Distel, R. J., Ellis, R., Papaioannou, V. E., and Spiegelman, B. M. (1996) Uncoupling of obesity from insulin resistance through a targeted mutation in aP2, the adipocyte fatty acid binding protein. Science 274, 1377-1379.
Hotamisligil, G.S. (2006) Inflammation and metabolic disorders. Nature, 444, 860– 867.
Hu E, Liang P, Spiegelman BM. (1996) AdipoQ is a novel adipose-specific gene dysregulated in obesity. J Biol Chem. 271(18): 10697-703.
Hursting, S. D., Perkins, S. N., Phang, J. M., and Barrett, J. C. (2001) Diet and cancer prevention studies in p53-deficient mice. J Nutr 131, 3092S-3094S.
Imai, S., Armstrong, C. M., Kaeberlein, M., and Guarente, L. (2000) Transcriptional silencing and longevity protein Sir2 is an NAD-dependent histone deacetylase. Nature 403, 795-800.
Ingram, D. K., Cutler, R. G., Weindruch, R., Renquist, D. M., Knapka, J. J., April, M., Belcher, C. T., Clark, M. A., Hatcherson, C. D., Marriott, B. M., and et al. (1990) Dietary restriction and aging: the initiation of a primate study. J Gerontol 45, B148-163.
Kaeberlein, M., McVey, M., and Guarente, L. (1999) The SIR2/3/4 complex and SIR2 alone promote longevity in Saccharomyces cerevisiae by two different
Chapter 1 Introduction
Katzmarzyk PT, Church TS, Janssen I, Ross R, et al. (2005) Metabolic syndrome, obesity, and mortality: Impact of cardiorespiratory fitness. Diabetes Care 28(2):391-397.
Lane, M. A., Ingram, D. K., and Roth, G. S. (1999) Calorie restriction in nonhuman primates: effects on diabetes and cardiovascular disease risk. Toxicol Sci 52, 41-48.
Liang, H., Masoro, E. J., Nelson, J. F., Strong, R., McMahan, C. A., and Richardson, A. (2003) Genetic mouse models of extended lifespan. Exp Gerontol 38, 1353-1364.
Lin, S. J., Defossez, P. A., and Guarente, L. (2000) Requirement of NAD and SIR2 for life-span extension by calorie restriction in Saccharomyces cerevisiae. Science 289, 2126-2128.
Maeda, K., Cao, H., Kono, K., Gorgun, C. Z., Furuhashi, M., Uysal, K. T., Cao, Q., Atsumi, G., Malone, H., Krishnan, B., et al. (2005) Adipocyte/macrophage fatty acid binding proteins control integrated metabolic responses in obesity and diabetes. Cell Metab 1, 107-119.
Manco, M., and Mingrone, G. (2005) Effects of weight loss and calorie restriction on carbohydrate metabolism. Curr Opin Clin Nutr Metab Care 8, 431-439.
Mattevi, A. (2006) A close look at NAD biosynthesis. Nat Struct Mol Biol 13, 563-564.
Mattison JA, Roth GS, Beasley TM, Tilmont EM, Handy AM, Herbert RL, Longo DL, Allison DB, Young JE, Bryant M, Barnard D, Ward WF, Qi W, Ingram DK, de Cabo R. (2012) Impact of caloric restriction on health and survival in rhesus monkeys from the NIA study. Nature. 489, 7415.
McCay CM, Crowell MF, Maynard LA. The effect of retarded growth upon the length of life span and upon the ultimate body size. (1935) Nutrition. 5,3 155-71.
Chapter 1 Introduction
Navina S, Acharya C, DeLany JP, Orlichenko LS, Baty CJ, Shiva SS, Durgampudi C, Karlsson JM, Lee K, Bae KT et al. (2011) Lipotoxicity causes multisystem organ failure and exacerbates acute pancreatitis in obesity
Sci. Transl. Med. 3,107.
Ricketts, W. G., Birchenall-Sparks, M. C., Hardwick, J. P., and Richardson, A. (1985) Effect of age and dietary restriction on protein synthesis by isolated kidney cells. J Cell Physiol 125, 492-498.
Shum BO, Mackay CR, Gorgun CZ, Frost MJ, Kumar RK, Hotamisligil GS, Rolph MS. (2006) The adipocyte fatty acid-binding protein aP2 is required in allergic airway inflammation. J Clin Invest. 116, 8: 2183-2192.
Sial S, Coggan AR, Carroll R, Goodwin J, Klein S. (1996). Fat and carbohydrate metabolism during exercise in elderly and young subjects Amer J of Phys vol. 271 (6) 983-989.
Sohal, R.S., & Weindruch, R. (1996) Oxidative stress, caloric restriction, and aging. Science, 273, 59-63.
Tan NS, Shaw NS, Vinckenbosch N, Liu P, Yasmin R, Desvergne B, Wahli W, Noy N. (2002) Selective cooperation between fatty acid binding proteins and peroxisome proliferator-activated receptors in regulating transcription. 22,14: 5114-27.
Tsuchiya, T., Dhahbi, J. M., Cui, X., Mote, P. L., Bartke, A., and Spindler, S. R. (2004) Additive regulation of hepatic gene expression by dwarfism and caloric restriction. Physiol Genomics 17, 307-315.
Weindruch, R., Walford, R. L., Fligiel, S., and Guthrie, D. (1986) The retardation of aging in mice by dietary restriction: longevity, cancer, immunity and lifetime energy intake. J Nutr 116, 641-654.
Chapter 1 Introduction
quantitative evaluation of transcript levels of these isoforms in various rat tissues. Biotechnol Lett. 31,11: 1695-1701.
Yang R, Castriota G, Chen Y, Cleary MA, Ellsworth K, Shin MK, Tran J, Vogt TF, Wu M, Xu S, Yang X, Zhang BB, Berger JP, Qureshi SA. (2011) RNAi-mediated germline knockdown of FABP4 increases body weight but does not improve the deranged nutrient metabolism of diet-induced obese mice. Int Jour Obes. 35(2):217-25.
CHAPTER 2
Chapter 2 Adipose tissue FABP deficiency profoundly impacts liver NAD metabolism
BACKGROUND
Adipose tissue fulfills multiple roles in the orchestration of systemic
substrate flux. Foremost, it acts as a rheostat for the circulating free fatty acid
environment, balancing storage with lipolytic activity according to the needs of
the organism. The endocrine function of adipocytes is becoming more widely
appreciated, with the finding that they have the ability to secrete an
ever-expanding array of factors that influence metabolic programs in peripheral tissues
(i.e. adiponectin, leptin, TNFα, Nampt /Visfatin, and palmitoleate) (MacDougald and
Burant, 2007; Hotamisligil et al., 1993; Revollo et al., 2007; Cao et al., 2008). Thus,
adipocyte function and peripheral tissue regulation are tightly linked. Since these
links are deeply rooted in the functioning of biochemical pathways, and in the flux
of nutrients on which these pathways rely, excess nutritional substrates present a
challenge to the integrity of these metabolic networks.
Unresolvable metabolic stress is a well-described feature of obesity, marked
by dysregulation of major pathways used for routine management of nutritional
energy. In liver, aberrant glucose and lipid metabolism present in obesity causes
hepatic steatosis, increased glucose output, and increased lipoprotein particle
formation. Together these contribute to the emergence of several obesity related
co-morbidities, namely type-2 diabetes and cardiovascular disease (Malnick and
Knobler, 2006), both contributing to and resulting from dysregulated glucose
Chapter 2 Adipose tissue FABP deficiency profoundly impacts liver NAD metabolism
Much work has been done to identify mechanisms that support the
maintenance of metabolic networks disrupted in obesity (Khan et al., 2006; Van
Gaal et al., 2006). We have chosen to approach this question by examining the role
of adipose tissue fatty acid binding proteins (FABPs) in the regulation of metabolic
circuitry. The FABPs aP2 and mal1 have the potential to regulate the localization
and availability of fatty acids (Furuhashi et al., 2008), and are perhaps required, at
least in part, for the incorporation of lipids into the metabolic network. As such,
mice with combined genetic ablation of aP2 and mal1 are resistant to the
deleterious effects of high fat diet and obesity (Maeda et al., 2005). A collection of
studies has elucidated many of the phenotypic alterations that arise under adipose
tissue FABP deficiency. Specifically, mice lacking aP2 and mal1 show a marked
protection against hepatic lipid accumulation, the development of type-2 diabetes
and insulin resistance when placed on a high-fat diet (Maeda et al., 2005) and also
exhibit a remarkable resistance to cardiovascular disease (Makowski et al., 2001).
This link between FABP deficiency and improved disease outcomes has also been
established in humans, where subjects displaying an aP2 promoter region
polymorphism resulting in lower adipose tissue aP2 levels present with a
decreased risk for hypertriglyceridemia, type 2 diabetes and cardiovascular disease
(Tuncman & Erbay et al., 2006). Despite this body of work, it is likely that additional
mechanisms related to FABP action remain undetermined, given that these
chaperones influence the availability of such a crucial substrate. Indeed, more
Chapter 2 Adipose tissue FABP deficiency profoundly impacts liver NAD metabolism
hepatic glucose output by increasing gluconeogenic gene activity, a phenotype
that is consistent with diminished hepatic glucose output in aP2-mal1 deficiency
(Cao et al, 2008; Cao et al., 2013). Also prominent in aP2-mal1-/- animals are
decreased liver lipogenesis and increased energy expenditure (Maeda et al., 2005).
Key molecules linking the metabolism of nutrients in energy generating
pathways are the nucleotide cofactors NAD and NADH. Together, these molecules
function to coordinate the maintenance of redox reactions during normal cellular
metabolism, and act as required substrates for enzymes such as sirtuins (Sirts) and
poly ADP-ribose polymerases (PARPs). Dietary regimens known to have positive
effects on age-related health outcomes have been demonstrated to function in
part through the modulation of NAD/NADH. Most importantly, these nucleotide
cofactors are required for the maintenance of redox reactions in energy generating
and energy consuming pathways throughout normal cellular metabolism (i.e.,
glycolysis, TCA-cycle, fatty acid oxidation, electron transport).
In mammals, the primary site for NAD synthesis is liver; it is produced either
de novo from tryptophan or through salvage pathways involving the recycling of
nicotinamide, or nicotinic acid. Nicotinamide phosphoribosyltransferase (Nampt)
catalyzes the formation of nicotinamide mononucleotide, an immediate precursor
to NAD and the rate-limiting step in the synthesis of NAD from nicotinamide (Imai,
2009). Nampt transcription has been shown to follow a circadian rhythm, protein
Chapter 2 Adipose tissue FABP deficiency profoundly impacts liver NAD metabolism
contributing to Nampt regulation. In liver, glucose and peroxisome
proliferator-activated receptor alpha activation both have been demonstrated to suppress
Nampt expression through undetermined mechanisms. At the mechanistic level,
Nampt was identified as an important mediator of lipid metabolism in liver, and a
direct transcriptional target of hepatic FoxOs.
In this study, we explored the metabolic landscape of FABP deficiency and
determined the existence of altered substrate utilization in hepatocytes. We
provide evidence of metabolic reprogramming in FABP deficiency, marked by
decreased glucose utilization and enhanced fatty acid oxidation; the latter
supported by an increase in NAD synthesis via upregulation of rate limiting
enzyme, nicotinamide phosphoribosyltransferase (Nampt). Furthermore, we
demonstrate that aP2 inhibits Nampt expression, and exerts additional influence
on NAD/NADH nucleotide balance by increasing glycolytic rate and suppressing
fatty acid oxidation.
RESULTS
Robust impact of FABP deficiency on liver metabolome
Given the complexity of potential outcomes resulting from the perturbation of a
single node in a metabolic network, we sought to provide a comprehensive profile
of metabolites altered in FABP deficiency using metabolomics. For this, we
employed targeted liquid-chromatography/mass spectrometry (LC/MS) of nearly
Chapter 2 Adipose tissue FABP deficiency profoundly impacts liver NAD metabolism
liver from wild type and FABP-deficient mice using the web-based metabolomic
platform, MetaboAnalyst (Xia and Wishart 2011). Comparison of normalized peak
signals by volcano plot revealed that adipose tissue FABP deficiency evoked only
minor changes in adipose, plasma, and skeletal muscle, but in liver more than 40%
of metabolites were altered (Figures 2-1A,B,C,D left panel).
In order to ascribe discernable physiological roles to each of the liver
derived factors identified by significance testing and illustrated by heatmapping
(Figures 2-1A,B,C,D right panel), we utilized the well-annotated metabolite set
enrichment capabilities of MetaboAnalyst. We found that the metabolite sets
displaying significant enrichment (red bars) were those related to metabolism of
protein (i.e., protein biosynthesis, urea cycle, ammonia recycling), citric acid cycle,
and nicotinate /nicotinamide metabolism (Figure 2-2A). Pathway impact analysis
was employed to identify metabolite sets with members that reside at highly
impactful nodes for generation of the relevant product species. Metabolite sets are
plotted such that those existing highest and closest to the diagonal contain the
most significant and impactful metabolites (Figures 2-2B). Based on this analysis,
nicotinate /nicotinamide metabolism is the most significant and highly impacted
Chapter 2 Adipose tissue FABP deficiency profoundly impacts liver NAD metabolism
Figure 2-1. Global metabolite profiling. -3 -2 -1 0 1 2 3
0 2 4 6 0 2 4 6
Log2(Fold Change)
-log10(pvalue) nicotinamide -0.60 -0.40 -0.20 0 0.20 0.40 0.60 low high Plasma! Skeletal muscle Liver! Ad ip ose ! Pl asma ! Ske le ta l mu scl e Li ve r ! aP2-mal1-/- WT
below threshold / unaltered above threshold / altered
Adipose!
-4 -2 0 2 4
0 1 2 3 4 0 1 2 3 4
Log2(Fold Change)
-log10(pvalue)
-3 -2 -1 0 1 2 3 0 1 2 3 4 0 1 2 3 4
Log2(Fold Change)
-log10(pvalue)
A
-6 -4 -2 0 2 4 0 1 2 3 0 1 2 3
Log2(Fold Change)
Chapter 2 Adipose tissue FABP deficiency profoundly impacts liver NAD metabolism
Figure 2-1 (Continued). Global metabolite profiling.
(A-D) All significantly regulated metabolites are represented in adipose, plasma
and skeletal muscle. For liver, only the top 50 metabolites measured are shown.
The adjacent pie graphs indicate the percentage of regulated metabolites out of
Chapter 2 Adipose tissue FABP deficiency profoundly impacts liver NAD metabolism
Figure 2-2. Pathway impact analysis of significantly altered metabolites
0 0.5 1.0 1.5 2.0 2.5 3.0 4.0 Fold Enrichment
B
Pathway Impact Score
0.0 0.1 0.2 0.3 0.4 0.5 0.6 0.7 0.8
-
lo
g1
0
(
p
-va
lu
e)
8
7
6
5
4
3
2
1
0!!!
nicotinate / nicotinamide metabolism
2
3
5 4
1
Chapter 2 Adipose tissue FABP deficiency profoundly impacts liver NAD metabolism
Figure 2-2 (Continued). Pathway Analysis of significantly altered metabolites
(A) Metabolite enrichment set overview. P value and fold change threshold equal
to p< 0.05 and 2, respectively. P value corresponds to significance of fold
enrichment. Highest significance is indicated in red, lowest is indicated in yellow.
(B) Pathway impact. In this graphic, as in 3E, the color signifies pathway
significance based on p-value threshold <0.05. Circle size indicates magnitude of
pathway impact. 1) Nicotinate /nicotinamide metabolism, 2) Arginine and proline
metabolism, 3) Pyrimidine metabolism, 4) Ala, Asp, Glu metabolism, 5) Citric acid
Chapter 2 Adipose tissue FABP deficiency profoundly impacts liver NAD metabolism
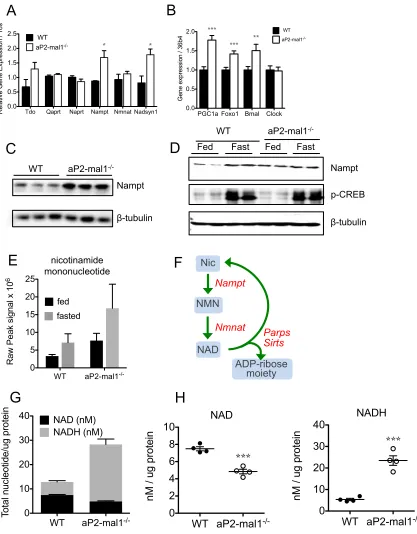
Liver nicotinamide metabolism and NAD/NADH ratio is altered in FABP deficiency
Nicotinate and nicotinamide are important precursors for the production of NAD,
an essential nucleotide and a vital co-factor in the catabolism of lipids,
carbohydrates, and proteins. For this reason, we used qPCR to examine hepatic
gene expression of enzymes involved in producing NAD, requiring either
nicotinate, nicotinamide, or the de novo precursor, tryptophan. Adipose FABP
deficiency led to increased expression of de novo NAD synthesis enzymes,
tryptophan dioxygenase (1.6-fold), and NAD synthase (fold, p<0.01) (Figure
2-3A). Contribution of the nicotinate salvage pathway to cellular NAD levels is
considered relatively minor, and accordingly we determined no significant
regulation of nicotinic acid phosphoribosyltransferase (Naprt), an enzyme specific
to this arm (Figure 2-3A). On the other hand, Nampt, a rate-limiting enzyme of the
nicotinamide salvage pathway and main route for NAD synthesis in mammals was
significantly upregulated (1.8-fold, p<0.05). Given that nicotinate /nicotinamide
metabolism was identified as the most highly impacted metabolite set, and we did
not detect significant gene regulation of the nicotinate pathway, we focused on
the NAD salvage pathway requiring Nampt.
Analysis of known transcriptional regulators of Nampt expression revealed
significant increases of Foxo1, PGC1α and Bmal in liver of FABP deficient mice. (Liu
2007, Ramsey 2009) (Figure 2-3B). Together, these transcription factors integrate
metabolic signals and the molecular clock machinery corresponding to circadian
Chapter 2 Adipose tissue FABP deficiency profoundly impacts liver NAD metabolism
energy demands. In the fed state, Nampt protein levels were increased in
aP2-mal1-/- mice compared to wild type (Figure 2-3C), which was concordant with gene
expression data (Figure 2-3A). Nampt protein levels highly reflect the cellular
energy status, and normally become elevated upon fasting in vivo, or glucose
withdrawal in vitro (Imai 2000). However, aP2-mal1-/- mice maintained a
constitutively high level of Nampt protein independent of fed status, comparable
to wild type levels in the fasted state (Figure 2-3D). Furthermore, the immediate
product of Nampt catalytic activity and the precursor to NAD, nicotinamide
mononucleotide, was present at high levels compared to wild type in both the fed
and fasted state.
Elevated levels of Nampt in aP2-mal1-/- animals is perhaps indicative of an
attempt to both restore NAD levels to avoid depletion during excessive
consumption and to eliminate excess nicotinamide, an inhibitor of NAD
consuming enzymes (Figure 2-3F) (Revollo et al., 2007). To explore this possibility,
we first measured nucleotide concentrations using a fluorometric assay to
determine the status of oxidized (NAD+) and reduced (NADH) forms of NAD. FABP
deficiency resulted in an overall increase in the total pool of nucleotide (Figure
2-3G). However, NAD+ content was lowered in aP2-mal1-/- mice (mean difference
from wild type, -2.648 ± 0.4 nM/µg protein, p<0.001), and was accompanied by a
concomitant increase in NADH (mean difference from wild type, 18.10 ± 2 nM/µg
Chapter 2 Adipose tissue FABP deficiency profoundly impacts liver NAD metabolism
effects of dietary restriction in increasing healthspan (Imai 2009). Specifically, a
reduced NAD/NADH ratio largely driven by an increase in NADH levels was
reported in livers of dietary-restricted mice (Chen et al., 2008). Here, we observe a
similar trend in FABP deficiency, along with other features common to metabolic
reprogramming events. With this in mind, we also considered the role of NAD
consumption in this process. First, we selected two well-described NAD consuming
enzymes to examine: Sirtuin1, and poly-ADP ribose polymerase (PARP). Sirt1
couples NAD cleavage to the deacetylation of protein substrates (Vaziri et al., 2001)
and PARP transfers ADP-ribose from NAD to itself and other nuclear proteins at
sites of DNA single strand breaks to signal repair (Charron and Bonner-Weir, 1999).
The potential for PARP to regulate NAD levels greatly outweighs that of Sirtuins,
given that the later consume only one molecule of NAD per reaction while PARP
has the capacity to generate polymers comprised of hundreds of ADP ribose
moieties. Thus, we determined gene expression using qPCR and functional outputs
of Sirtuin and PARP activities using a fluorometric enzyme assay and western blot
of ADP-ribosylated proteins, respectively. While mRNA levels of both Sirt1 and
PARP were elevated (Figure 2-4A), poly ADP-ribosylation was increased in FABP
deficiency (Figure 2-4B) but Sirtuin-mediated deacetylation was not (reaction rates,
387.1±12.5 and 382.5±7.5, WT and aP2-mal1-/-, respectively) (Figure 2-4C). Taken
together, these observations signify that FABP deficiency evokes an increase in
Chapter 2 Adipose tissue FABP deficiency profoundly impacts liver NAD metabolism
NAD synthesis gene Nampt, while shifting the predominant species from NAD to
NADH.
Citric acid cycle activation contributes to altered NAD/NADH ratio
NADH, typically produced during macronutrient catabolism, is a marker for carbon
flux through the citric acid cycle, providing reducing equivalents to drive
mitochondrial electron transport for ATP synthesis. Our data points to a nucleotide
imbalance having potential effects on both substrate availability and substrate
utilization. Indeed, there is a substantial impact on citric acid cycle pathway gene
activation (Figure 2-5A) and a marked increase in the corresponding levels of citric
acid cycle metabolites (Figure 2-5B). With the exception of citrate synthase and
alpha-ketoglutarate dehydrogenase, all enzymes of the citric acid cycle are
elevated between 1.5 to 2 fold, as determined by qPCR array (Figure 2-5A)
Additionally, pathway intermediates were elevated between 1.5 and 4 fold (Figure
2-5B). Notably, all of the metabolites that directly participate in redox-reactions
producing NADH were increased by several fold in aP2-mal-/- mice.
Although citric acid cycle activation provided a means to explain the high
levels of NADH present in FABP deficient livers (Figure 2-3H), two fundamental
questions remained. First, why has this switch in redox status occurred? Secondly,
Chapter 2 Adipose tissue FABP deficiency profoundly impacts liver NAD metabolism
Figure 2-3. NAD metabolism in Liver.
WT aP2-mal1
-/-0 10 20 30 40 To ta l n uc le ot id e/ ug p ro te in NADH (nM) NAD (nM)
B
A
D
C
NADWT aP2-mal1
-/-0 2 4 6 8 10
nM / ug protein
***
NADH
WT aP2-mal1
-/-0 10 20 30 40
nM / ug protein
*** Fed Fast Fed Fast
WT aP2-mal1-/-
Nampt
β-tubulin
p-CREB
G
NMN
WT aP2-mal1 -/-0 5 10 15 20 25
Raw Peak signal x 10
6
fed fasted
Tdo Qaprt Naprt Nampt Nmnat Nadsyn1
0.0 0.5 1.0 1.5 2.0 2.5
Relative Gene Expression / 18s
WT
aP2-mal1-/- * *
WT aP2-mal1
-/-Nampt
β-tubulin
PGC1a Foxo1 Bmal Clock 0.0
0.5 1.0 1.5 2.0
Gene expression / 36b4
**
*** WT
aP2-mal1 -/-***
E
F
NMN!
NAD! Nic!
Nampt!
Nmnat! Parps
Chapter 2 Adipose tissue FABP deficiency profoundly impacts liver NAD metabolism
Figure 2-3 (Continued). NAD metabolism in Liver.
(A) qPCR of genes encoding enzymes involved in each of the three pathways for
NAD production and (B) transcription factors regulating Nampt. (C) N=4. (D)
Immunoblot of rate limiting enzyme of NAD synthesis, Nampt in random fed
animals, and (E) animals in the fed and fasted state. (E) Levels of nicotinamide
mononucleotide, the immediate product of Nampt activity. (F) Graphical
representation of NAD salvage pathway from nicotinamide. (G-H) Total nucleotide
levels (G) as nanomolar ratios and (H) as separate species. Abbreviations:
tryptophan dioxygenase (TDO), quinolinate phosphoribosyltransferase (Qaprt),
nicotinamide/nicotinate mononucleotide adenylyltransferase (Nmnat), NAD
synthetase (Nadsyn), nicotinic acid phosphoribosyltransferase (Naprt),
Chapter 2 Adipose tissue FABP deficiency profoundly impacts liver NAD metabolism
Figure 2-4. NAD consumption in FABP deficiency. (A) qPCR of NAD consuming
enzymes, (B) Immunoblot of poly-ADP ribosylated proteins and an H2O2 treated
HeLa cell lysate as a positive control. Line indicates range of 116-200kD
corresponding to ribosylated proteins. (C) Sirtuin protein levels (left) and
deacetylase activity (right) in 10 μg of liver lysate. Graph includes linear portion of
60-minute assay. Recombinant-Sirt1 was assayed +/- NAD as a positive control. N =
3-4, 12 weeks of age for each genotype.
PARP1 Sirt1 0.0
0.5 1.0 1.5 2.0
Relative Gene Expression / 18s
aP2-mal1
WT
WT aP2-mal1-/- H202
IB: PAR
0 5 10 15 20 25 30
0 10 20 30 40 50
Minutes
Sirtuin activity (Fluorescence Counts x 10
5)
Recombinant Sirt1 (- NAD) Recombinant Sirt1 (+ NAD) WT
aP2-mal1
-/-C
A
B
WT aP2-mal1
Chapter 2 Adipose tissue FABP deficiency profoundly impacts liver NAD metabolism
Figure 2-5. Citric acid cycle pathway activation. (A) Citric acid cycle gene
expression as determined using SAB biosciences qPCR array on pooled cDNA from
each genotype. (B) Heatmap of TCA cycle intermediates in aP2-mal1-/- versus wild
type.
0.0 0.5 1.0 1.5 2.0 2.5 malate dehydrogenase fumarate hydaratase succinate dehydrogenase succinyl-CoA synthetase a-ketoglutarate dehydrogenase isocitrate dehydrogenase aconitase citrate synthase pyruvate carboxylase
fold change of WT
NADH NADH NADH Acetyl-CoA
TCA Cycle
Isocitrate α-ketoglutarate Succinate Malate FumarateOxaloacetate Citrate
416706.6 411700.5 337882.7 539251.9 WT 1787470.1 1347989.9 1636764 1108078.7
KO
163239.69 105196.15 122062.43 58721.72 WT 195474.91 204958.12 256288.34 294973.89
KO
WT
4131.023 10619.6 9738.897 4131.023
KO
20102.054 24561.049 31069.239 16366.54 WT
6282034.799 9506014.012 7237550.448
KO
7088325.324 8451746.898 11517571.43 WT
120431.62 57202.36 52122.96 38978.75
KO
154515.3 173593.23 186624.21 241836.55 WT
2048350.865 1689963.141 1866177.77
KO
2473939.036 2636336.996 3079714.34
184335.5 272450.3 218264.3 285877.1 WT
241315.7 232897 187999.9 375528.2
KO
Succinyl-CoA
150010.6 137411.6 108295.9 211495
WT 410493.4 471801.5 518439.2 612754.8
KO 3.5x 2x 3x 3x 1.5x 4x A B
WT 1 2 3 4 aP2-mal1
-/-1 2 3 4
1 2 3 4
Chapter 2 Adipose tissue FABP deficiency profoundly impacts liver NAD metabolism
Metabolic reprogramming in FABP deficiency
Harvesting energy from nutritional substrates and stored macromolecules requires
a series of steps that generate carbon units to be processed through the citric acid
cycle. For small mammals, metabolic cage experiments are used to determine
substrate utilization. In this type of experiment, O2 intake and CO2 produced from
macronutrient catabolism are measured. From this, a respiratory exchange ratio
(RER) is determined, representing the stoichiometric relationship between the
amount of oxygen required and the amount of CO2 produced in the complete
oxidation of one mole of carbohydrate (RER = 1.0) or one mole of lipid (RER = 0.7).
Using this standard method, we calculated the RER value over a 12-hour dark
period. We found that there is a marked difference in the frequency distribution of
RERs between wild type and aP2-mal1-/- mice across all intervals (Figure 2-6), with
FABP deficiency causing a leftward shift towards lower RERs, suggesting an
alteration of substrate preference from carbohydrates to fatty acids. [Determining
substrate utilization from this value can however be complicated by two factors.
First, highly glycolytic tissues release lactate into circulation leading to a rise in pH,
necessitating the conversion of HCO3 to CO2 in a deacidification reaction. Having
previously documented enhanced muscle glucose uptake in aP2-mal1-/- mice
(Maeda et al., 2005), it seemed likely that these RER values could also reflect a
measure of discordant CO2 production in FABP deficient mice. Secondly, proteins
cannot be completely oxidized to CO2, thus it is difficult to attribute a single RER
Chapter 2 Adipose tissue FABP deficiency profoundly impacts liver NAD metabolism
Figure 2-6. Evidence of altered substrate utilization in FABP deficiency.
Respiratory exchange ratios. VO2 and VCO2 gas exchange was measured over a
72-hour period. Plot represents frequency distribution of RERs recorded at 10-minute
intervals over a 12-hour dark cycle. N = 4 per group.
0.78
0.80
0.82
0.84
0.86
0.88
0.90
0.92
0.94
0
5
10
15
20
25
30
35
40
45
non-protein RER value
RER frequency
WT
-/-Chapter 2 Adipose tissue FABP deficiency profoundly impacts liver NAD metabolism
regarded as a minor contributor to overall carbon flux under normal conditions,
the inaccuracy associated with metabolic cage determination of substrate
utilization, with respect to protein, is considered negligible and not accounted for.
If indeed the case, blood buffering of lactate and/or activation of protein
catabolism in FABP deficiency would lead to a significant overestimation of RER,
and therefore, an underestimation of the fatty acid oxidation contribution to
cellular respiration.
Given the caveats of metabolic cage monitoring, we explored the possible
contribution of blood buffering and protein catabolism to RER in FABP deficiency.
Lactate produced by highly glycolytic skeletal muscle is delivered to liver through
the circulation to the liver, where it is metabolized. LC/MS analysis of lactate,
however, revealed no apparent activation of this cycle in FABP deficiency, as
skeletal muscle, plasma and liver lactate levels were comparable between both
genotypes (Figure 2-7A). We then asked whether protein catabolism was activated
in FABP deficiency by investigating the urea cycle, as ammonium released during
protein deamination enters this pathway to be processed for excretion. While
expression of ornithine transcarbamylase (OTC), arginosuccinate synthase 1 (ASS1),
and arginosuccinate lyase (ASL) were all modestly elevated, OTC was the only urea
cycle enzyme gene to reach a statistical increase in aP2-mal1-/- livers (Figure 2-7B
and C). Additionally we found that Sirt3, which promotes urea cycle activity by
deacetylation of OTC, was also modestly increased though not significantly (Figure
Chapter 2 Adipose tissue FABP deficiency profoundly impacts liver NAD metabolism
Figure 2-7. Activation of Protein Catabolism. (A) Lactate levels in skeletal
muscle, plasma and liver, corresponding to the Cori cycle. (B) Gene expression of
urea cycle enzymes. (C) Urea cycle intermediates increased in aP2-mal1-/- vs. WT are
circumscribed by solid red line (≥ 1.5-Fold). (D) Amino acid mediated citric acid
cycle anaplerosis. Fold Change (Log2) indicates magnitude of increase in amino
acids leading to production of α-ketoglutarate .
0 1 2 3 4
a-ketoglutaratealanine glutamine glutamatehistidine proline arginine
Log2(Fold Change)
CPS-1 OTC ASS1 ASL ARG1 Sirt3 0.0
0.5 1.0 1.5 2.0
Relative mRNA
Expression / 36b4
WT aP2-mal1
-/-**
A
B
C
D
Sk. Muscle Plasma Liver 0
10 20 30
Lactate Peak Signal (Log
(2
)
)
-/-Chapter 2 Adipose tissue FABP deficiency profoundly impacts liver NAD metabolism
acetylglutamate and arginine were both increased in FABP deficient livers, by
4-fold and 7-4-fold, respectively (Figure 2-7C). Ornithine, another key intermediate in
the urea cycle, achieved the highest fold increase (13-fold) of the 208 metabolites
that were detected in liver, and was among several other enhanced cycle
intermediates (Figure 2-7C). An important mechanistic feature of urea cycling,
parallel to the detoxification of nitrogen generated from protein catabolism, is
anaplerosis—the replenishment of citric acid cycle intermediates for the
generation of NADH. Accordingly, all alpha-ketoglutarate related amino acids are
present at high levels in aP2-mal1-/- livers (Figure 2-7D). This substrate-driven
activation of the urea cycle underscores a dominant role for proteins in the
replenishment of energy substrates in FABP deficiency. Adding further strength to
this idea is the fact that pathways relevant to protein metabolism appeared high
on both the metabolite enrichment and pathway impact scales, ranking adjacent
to citric acid cycle, and nicotinamide metabolism (Figure 2-2A and B). Remarkably,
though protein catabolism is known to predominate during high intensity exercise
or prolonged fasting, FABP deficiency alone mimics the same pathway activation.
To determine the nature of this switch in substrate preference from
carbohydrates to fatty acids revealed by the left-shift in RER frequency distribution,
we examined glycolysis and fatty acid oxidation pathways. Glycolytic gene
expression, protein levels of glucose transporter 2, and metabolites of glycolysis
were all decreased in FABP deficient mice (Figures 2-8A,B,C). Conversely,
Chapter 2 Adipose tissue FABP deficiency profoundly impacts liver NAD metabolism
uptake of fatty acids and subsequent β-oxidation, CPT1α and Acadm, respectively,
were each elevated by two-fold (Figures 2-8D and E).
Through this comprehensive analysis of the liver metabolome, we have
confirmed enhanced activation of β-oxidation, and revealed a previously unknown
phenotype of FABP deficiency: protein-mediated citric acid cycle anaplerosis. This
alternative pathway activation likely contributes to an enhanced rate of NADH
production, and improved homeostatic control when FABP deficiency is coupled
with genetic or diet induced obesity. Together, these data allow us to assign a
probable cause and source of the NAD/NADH nucleotide imbalance demonstrated
Chapter 2 Adipose tissue FABP deficiency profoundly impacts liver NAD metabolism
Figure 2-8. Metabolic shift from glucose utilization to lipid oxidation CPT1α Acadm 0 2 4 6 8
Relative Expression / 36b4
WT aP2-mal1
-/-*
p"="0.058
WT aP2-mal1
-/-0 50 100 150 200 250 Ac et yl C o-A le ve ls ( % ) *
0.0 0.5 1.0 1.5
pyruvate kinase enolase phosphoglycerate mutase phosphoglycerate kinase Gly-3-phosphate dehydrogenase aldolase phosphofructokinase phosphoglucose isomerase glucokinase
fold change of WT
WT aP2-mal1-/-
Glut2
β-tubulin
1,3$bisphosphoglycerate
279758.97 255444.42 362834.46 72228.21
WT 0.54x 91335.63 163472.91 129705.66 141577
KO
3$phosphoglycerate
155476.11 125379.76 117509.21 92138.35
WT 1.4x 125156.52 158798.88 174428.44 212818.03
KO
2$phosphoglycerate
WT
N.D. KO
phosphoenolpyruvate
84801.43 97002 135262.89 31875.01
WT 0.70x 64540.71 66221.48 49043.69 64483.58
KO
glucose(6(phosphate
WT 825034.96 629314.9 423243.57 377620.86
KO 47978.56 401652.29 291212.44 291107.19 0.46x 0.5x
fructose(6(phosphate
WT 1041027.59 758880.97 642592.34 531817.96
KO 56287.56 560754.77 390022.51 420120.48 0.48x
fructose(1,6(bisphosphate
WT 108538.95 143916.95 111028.45 121369.54
KO 69516.68 85601.54 98856.21 78145.03 0.69x
glyceraldehyde(3(phosphate
WT 666823.013 1228746.224 344383.6398
KO 727984.796 286142.211 207832.504
Chapter 2 Adipose tissue FABP deficiency profoundly impacts liver NAD metabolism
Figure 2-8 (Continued). Metabolic shift from glucose utilization to lipid
oxidation (A-C) Glucose metabolism. (A) Glycolytic gene expression as in figure 3A.
(B) Glut2 protein levels and (C) heatmapping of glycolytic intermediates using
same scale as figure 3b. Fatty acid oxidation. (D) Expression of critical genes for
mitochondrial fatty acid uptake and oxidation, CPT1α and Acadm. (E) Acetyl-CoA