This is a repository copy of A Microstructural Investigation of Gas Atomized Raney Type Al-27.5 at.%Ni Catalyst Precursor Alloys.
White Rose Research Online URL for this paper: http://eprints.whiterose.ac.uk/87832/
Version: Accepted Version
Article:
Mullis, AM, Bigg, TD and Adkins, NJ (2015) A Microstructural Investigation of Gas Atomized Raney Type Al-27.5 at.%Ni Catalyst Precursor Alloys. Journal of Alloys and Compounds, 648. 139 - 148. ISSN 0925-8388
https://doi.org/10.1016/j.jallcom.2015.05.142
© 2015, Elsevier. Licensed under the Creative Commons Attribution-NonCommercial-NoDerivatives 4.0 International http://creativecommons.org/licenses/by-nc-nd/4.0/
eprints@whiterose.ac.uk https://eprints.whiterose.ac.uk/ Reuse
Unless indicated otherwise, fulltext items are protected by copyright with all rights reserved. The copyright exception in section 29 of the Copyright, Designs and Patents Act 1988 allows the making of a single copy solely for the purpose of non-commercial research or private study within the limits of fair dealing. The publisher or other rights-holder may allow further reproduction and re-use of this version - refer to the White Rose Research Online record for this item. Where records identify the publisher as the copyright holder, users can verify any specific terms of use on the publisher’s website.
Takedown
If you consider content in White Rose Research Online to be in breach of UK law, please notify us by
A Microstructural Investigation of Gas Atomized Raney Type
Al-27.5 at.%Ni Catalyst Precursor Alloys
A.M. Mullis1a,T.D. Bigg1bandN.J. Adkins2c
1
Institute for Materials Research, University of Leeds, Leeds LS2 9JT, UK.
2
IRC in Materials Processing, University of Birmingham, Edgbaston, Birmingham B15-2TT.
a)a.m.mullis@leeds.ac.ukb)t.bigg@leeds.ac.ukc)n.j.e.adkins@bham.ac.uk
Abstract
Quantitative image analysis has been used to investigate the phase composition of gas atomized powders of a Raney type Ni catalyst precursor alloys of composition Al-27.5 at.% Ni in the powder size range
150-212 m. We find that there are considerable variations in phase
composition both between powders from the same batch and as a function distance from the particle surface within individual particles. Such variations may have significant implications for the future production and uptake of such catalysts, including the necessity for post-production crushing of gas atomized powders. Models are proposed to account for both variations.
Keywords: Raney-type nickel catalysts; Nickel aluminium alloy; Gas atomisation process
1 Introduction
Skeletal, or sponge metal, catalysts have found wide application in a range of hydrogenation and dehydrogenation reactions [1], as well as in hydrogenolysis [2] and hydrolysis reactions [3]. Of these skeletal metal catalysts, Raney type Ni [4] is by far the most common. Traditionally Raney Ni catalysts are produced by casting ingots of a 50-50 wt.% mixture of Ni and Al (which due to the large density difference is Al-31.5 at.% Ni) that are subsequently crushed into coarse powders so that the catalyst can be activated by leaching in a concentrated solution of alkali metal hydroxide [5]. During this process much of the Al is removed from the precursor alloy to leave a nano-crystalline Ni structure, which is the active catalyst.
A number of studies [see e.g. 6] have shown that the main phases present in the precursor Ni-Al alloy are the intermetallics Ni2Al3 and NiAl3, together with an
Al-NiAl3 eutectic. This is broadly in agreement with the binary phase diagram, wherein
the first phase to form at the liquidus temperature of 1623 K for the Al-31.5 at.% Ni composition is NiAl. This subsequently transforms to Ni2Al3via a peritectic reaction
at 1406 K. As NiAl is not generally observed in Raney type Ni precursor alloys [7], it is generally assumed that this peritectic reaction goes to completion. Upon further cooling a second peritectic is encountered at 1127 K, wherein Ni2Al3 is converted to
NiAl3. The retention of significant fractions of Ni2Al3 in the as-solidified precursor
easily able to go to completion. Solidification ends at 912 K with the formation of an Al-NiAl3eutectic. The Al-rich end of the Al-Ni phase diagram is shown inFigure 1.
Figure 1 –Al-rich portion of the Al-Ni phase diagram showing the main phases present in Raney type Ni catalyst precursor alloys (Ni2Al3, NiAl3 and Al-NiAl3
eutectic), together with the 27.5 at.% starting composition of the liquid which forms
the basis for this study. C etc. refer to the terms in Equ. (1), which describes the rate
at which the solid-solid peritectic transformation occurs, in this case with reference to the Ni2Al3+ LNiAl3peritectic (see below).
Each of the equilibrium phases, Ni2Al3, NiAl3 and Al, responds differently to
leaching. NiAl3 leaches easily and gives the most active catalyst [6, 8] but is easily
friable, meaning that in its pure form it is unsuitable for applications such as slurry and tubular bed reactors [9]. Ni2Al3is less easily leached than NiAl3, and is therefore
less catalytically active, but retains greater structural integrity [6, 8]. For this reason it is also considered an important constituent of most Raney type catalyst precursor alloys [10], with the original dendritic structure of the Ni2Al3remaining after leaching
to support the active nano-crystalline Ni phase produced by the leaching of NiAl3.
The Al-NiAl3 eutectic, being largely Al by volume, is almost entirely lost during
leaching, producing a microporous network of channels by which both the leaching agent can enter the precursor particles, and subsequently by which the chemical reagents can enter the activated catalyst. Consequently, anything that changes the balance of phases within the catalyst, be that the composition of the precursor alloy or its cooling rate during solidification, can significantly alter the performance of the final, activated catalyst.
ribbons [11, 12] could lead to a catalyst with higher activity and could allow the possibility of higher Al concentrations, something that proves difficult via the cast-crush route due to the extreme friability of the resulting catalyst [10]. In recent years there has been an upsurge in interest in gas atomized Raney type Ni precursors [13-15], with Al concentrations in the range 68.5-82.5 at.% being investigated. Gas atomization would be expected to give cooling rates of the order 102-105K s-1[16-18] (depending upon particle size and, to a lesser extent, gas type) with catalytic activities in the subsequently activated catalyst [14] more than twice that of conventional Raney type Ni being reported. Generally, the best catalytic performance has been found for relatively large particles that would have experienced cooling rates towards the lower end of the spectrum quoted above. There is some evidence that subsequent crushing of the atomized precursor alloy to produce an ultra-fine powder, that nevertheless experienced a low-intermediate cooling rate, gives the optimum catalytic performance.
However, our lack of understanding of this system may in part arise as the kinetics of peritectic reactions have been much less well studied than most other solidification morphologies. Kerr & Kurz [19] describe peritectic solidification as comprising three stages. For the transformation+ L these are:
i) Liquid-solid peritectic reaction (PR): The initiating stage of the transformation in which a thin shell ofovergrows the primaryphase. Growth occurs at the triple junction at which all three phases remain in contact. This stage terminates when the phase is completely encased in a thin layer of . It is important in terms of the nucleation of , but is unlikely to contribute significantly to either the increase in volume of or the corresponding decrease in volume of.
ii) Solid-solid peritectic transformation (SSPT): Once the phase is completely encased in any further transformation of to requires diffusion through the solid layer. This is likely to make such transformations sluggish. It is normally taken that the thickness,, of thelayer is given by [20]
L
L L
2
2 C C C C
C C C C D (1)
where Dis the average interdiffusion coefficient in the phase, C and C
are the compositions of the phase in equilibrium with the phase (or liquid in the case of CL and CL), and vice-versa, C is the average composition of
the phase and is the time available at, or below, the peritectic temperature, before the onset of significant direct solidification (DS) of (see iii below). With reference to the Al-Ni phase diagram we note that the Ni2Al3() + L
NiAl3 ( ) peritectic reaction is Type C in the classification described in [20,
21], i.e. NiAl3is a line compound so that CL C , wherein the transformation
rate is expected to be slow. The values of C , C , CL and CL are given in
iii) Direct solidification of peritectic phase (DS): As the temperature drops below that of the peritectic,Tp, the driving force for the direct solidification offrom
the liquid will increase more rapidly than for the solid-solid transformation of
to. This leads to the direct growth of from the liquid. In many situations this will be the major contributor to the volume of found in the as-solidified sample, but will of course not reduce the volume ofas is the case for the PR and SSPT stages.
A number of papers have shown that the phase evolution in Raney type Ni precursor alloys as a function of cooling rate may be complex. Neutron and X-ray diffraction studies [13, 21] have shown that for Ni concentrations of 25 at.% the fraction of NiAl3decreases with increasing cooling rates (which for gas atomization corresponds
to decreasing particle diameter) while the fraction of Ni2Al3 increases. This can be
understood in terms of the kinetics of the SSPT stage of the peritectic reaction Ni2Al3+ LNiAl3, as defined above, this being the stage in the peritectic that is
responsible for the majority of the conversion of Ni2Al3. Due to the reliance upon
solid-state diffusion this is a relatively slow conversion, wherein high cooling rates restrict the time available for this reaction to proceed, giving more retained Ni2Al3
(and hence less NiAl3) in the as-solidified microstructure. Conversely, for Ni
concentrations of < 25 at.% the fraction of NiAl3 increases with increasing cooling
rates. The most likely explanation for this is that the stability field for the primary solidification to Ni2Al3 becomes quite restricted at low Ni concentrations, such that
some droplets attain sufficient undercooling to bypass the formation of Ni2Al3,
solidifying instead to give NiAl3as the primary solidification phase.
A further complexity when considering gas atomized powders is that the stochastic nature of the nucleation process within a population of rapidly cooling droplets leads to considerable variability within a sample of notionally similar droplets. To a good first approximation, droplets of the same size will be subjected to the same cooling rate. However, it is not true that all droplets of the same size will solidify at the same undercooling, as this is controlled by nucleation which is a stochastic process. Solidification of the liquid might be catalysed by a potent nucleation site, such as an oxide, and in such cases deep undercooling would not be expected. However, the catalytic effect of active nuclei can be restricted by dispersing the liquid into a large number of small droplets that solidify individually. This is often referred to as melt sub-division. In this stochastic process, a range of undercoolings from low to relatively high would be expected in each size range due to the variation in nuclei density and potency. Consequently, techniques such as neutron and X-ray diffraction, which provide a bulk average for the material, can hide considerable natural variability within the particle population.
Recent studies have shown that during rapid solidification of the melt additional metastable phases may form, including Ni2Al9and a decagonal quasicrystalline phase
[22]. The composition of the decagonal phase has been determined to be between 24 and 30 at% Ni and it shows distinct structural similarities to Ni2Al3[22]. However,in situ synchrotron studies on levitated droplets have shown that the formation of this phase requires the Ni2Al3 + L mush to be undercooled ≥155 K below the NiAl3
peritectic temperature without the nucleation of the NiAl3phase [23, 24]. Both phases
NiAl3 the decagonal phase is converted rapidly to NiAl3 [23]. Given that NiAl3 is a
stoichiometric intermetallic, little evidence for the origin of the NiAl3 is likely to be
retained in the as-solidified sample and consequently we may conjecture this is likely to have little effect on the catalytic properties of gas atomized Raney powders.
In this paper we explore a technique for analysing the kinetics of the Ni2Al3+ LNiAl3 peritectic transformation using a method based on the image
analysis of annular sections of gas atomized Al-27.5 at.% Ni powders in the diameter range 150-212m. Despite the small size of these powders the surface will be subject to more rapid cooling than the interior, leading to small, but quantifiable, radial variations in the phase composition of the particles. The technique, being based on the examination of individual particles, also yields information on the natural variability within the particle distribution. Interpretation of the results is aided by numerical modelling of heat transfer within the cooling droplets.
2 Experimental Method and Analysis Techniques
2.1 Powder Preparation
Powders of the Raney precursor alloy were prepared by close-coupled gas atomization. The atomizer utilises a simple die of the discrete jet type with 18 cylindrical jets of 0.5 mm diameter arranged around a tapered melt delivery nozzle at an apex angle of 45°. The design is similar to the USAG [26] and Ames HPGA-I [27] designs. The liquid metal is delivered to the tip of the atomization nozzle via a central 2 mm diameter bore in the nozzle. In order to ensure the smooth flow of liquid metal an over pressure of 40 kPa is applied to the reservoir above the atomization nozzle. In order to prevent oxidation of the liquid metal Ar was used as the atomizing gas. The atomization pressure was 3.5 MPa, giving a gas flow rate of 0.049 kg s-1. A melt pour temperature of 200 K above the liquidus was used to ensure smooth flow of the melt.
The alloy selected for this investigation was Al-27.5 at.% Ni, the reasons being:
1) this composition yields approximately equal volume fractions of the Ni2Al3
and NiAl3 phases, which reduces the errors associated with the measurement
technique,
2) The liquidus temperature for this composition is 1480 K wherein it is unlikely that sufficient undercooling could be achieved in any droplet to bypass the L + Ni2Al3 NiAl3peritectic (1127 K), as might be the case for some of the more
Al-rich alloys.
The average cooling rate for particles produced using the same atomization configuration as utilised here has been measured by [18] using the secondary dendrite arm spacing in Al-4 wt.% Cu alloys. They found that the cooling rate for particles in this size range to be of the order of 300 K s-1, this low value being attributed largely to the high temperature of the circulating gas in the atomization chamber. Using the model of Libera et al. [28] the maximum undercooling prior to nucleation for this cooling rate can be estimated, wherein correspondingly low values of the undercooling (< 60 K) are obtained. Although the primary dendrite growth velocity has not been determined as a function of undercooling for this alloy, such determinations have been made [29] for both Al-25 at.% Ni and Al-30 at.% Ni, with growth velocities for these low undercoolings being 0.3 m s-1 and 0.45 m s-1 respectively.
2.2 Phase Composition & Solidification Morphology
In order to confirm that the powder sample contained only the expected Ni2Al3, NiAl3
and -Al phases, phase identification by powder XRD was employed prior to preparing polished sections for microstructural analysis. The powder was mounted using a low-background silicon single crystal substrate then measured using a Philips Xpert diffractometer fitted with a copper X-Ray tube. A nickel foil in the diffracted
beam path was employed to filter the incoming X-Rays such that only K 1 and K 2
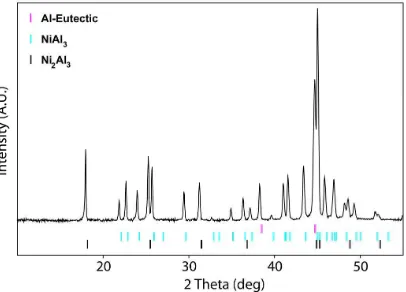
wavelengths were recorded by the detector. Diffraction data was collected over a 2-theta range of 10-80 degrees. To improve the statistics at high 2-2-theta angles the programmable divergence slit feature of the diffractometer was made use of. Post processing of the XRD measurements was initially performed using PANalytical software in order to apply a fixed divergence slit correction to the programmable divergence slit data. Crystallographic data for the phases present was obtained from the ICSD database. The resulting XRD trace is shown in Figure 2. The observed diffraction pattern can clearly be fitted by assuming only the three phases Ni2Al3,
NiAl3and-Al are present and this is assumed in the subsequent analysis of all SEM
micrographs. Unlike [25], we find no evidence of any additional metastable phases in the gas atomized powders studied here. This is consistent with the relatively low cooling rates and consequently undercoolings experienced by these samples. In particular, the decagonal phase has only been observed to be retained in gas atomized droplets if the diameter is < 38 m, wherein [18] estimates the cooling rate to be of the order of 104K s-1, compared to 300 K s-1for the size of droplets considered here.
Figure 2 – XRD trace for the Al-27.5 at.% Ni alloy studied here, showing the presence of Ni2Al3, NiAl3and-Al only.
As the response from the backscatter detector varies according to atomic mass, and there exists a significant difference between the atomic mass of aluminium and nickel, the location of different phases in the particle can readily be resolved via density variation in the greyscale image. The nickel-rich Ni2Al3phase scatters electrons most
strongly, and so appears lightest, while the aluminium-eutectic phase scatters electrons least strongly, and therefore appears darkest. The NiAl3 phase appears as a
Figure 3– Electron backscatter image of a particle showing density variations due to different phases. Contrast outside the particle circumference is due to electrically conductive mounting compound. Also shown are the positions of the annuli used in the quantitative analysis discussed in Section 2.3.
Figure 4ashows a magnified region of a typical particle from the 212 – 150 µm sieve fraction. For clarity the Ni2Al3, which is the primary solidification phase, has been
coloured red. The micrograph reveals numerous small dendritic fragments which suggests that the droplet has experienced multiple nucleation events. In contrast,
Figure 4bshows an example of a powder from the 75-53 m diameter sieve fraction where a single dendrite extends over much of the droplet, suggesting that the droplet consists of only one, or a a small number of, crystal(s). Even in the smaller size fractions such droplets are rare although there prevalence increases with decreasing particle size, presumably due to the rapid increase in cooling rate with decreasing particle size. Although these events are rare, Figure 4billustrates that it is relatively straightforward to identify droplets that consist of only 1-2 crystallites from those that are highly polycrystalline.
independent of the sectioning angle and position. All droplets considered for quantitative analysis were highly polycrystalline.
Figure 4– (a) Electron backscatter image of part of a particle from the 212-150 m sieve fraction with the Ni2Al3 phase coloured red, wherein the highly fragmented
nature of the primary solidification morphology is evident. Contrast this with (b) a relatively rare example of a droplet comprising only 1-2 crystallites from the 75-53m sieve fraction. Such droplets containing only 1-2 crystallites are easily identified in backscatter images and were not present in the larger size sieve fractions.
2.3 Quantitative Image Analysis
A histogram showing the grey-scale density distribution present in the particle shown in Figure 3 (excluding the surrounding mount material) is shown in Figure 5, from which it can be seen that the analysis does indeed identify three distinct phases. The low plateau region at the left represents the aluminium eutectic phase, while the double peaks on the right represent the NiAl3 and Ni2Al3 phases respectively. To
ensure that individual particles being observed had been sectioned through, or close to their centre, when capturing images particles with an apparent diameter < 120 m were excluded from the analysis (in this sample no particle has an actual diameter < 150m).
A combination of manual and automated analysis was used within the ImageJ [30] software package to extract information on the location of the different phases within the particle. The manual analysis consisted of initial inspection of each particle image in order to calculate the dimensions of the particle from the image scaling factor, and to determine the dimensions and position of an ellipse that fits the periphery of the particle. The contour plotting plugin for ImageJ was used on a zoomed portion of the particle image, in conjunction with the greyscale density distribution plot, to establish density ranges for each of the three phases. Figure 6 shows the use of the ImageJ contour plotting plugin for a portion of Figure 3, with the contour thresholds set to greyscale values of 145 and 179. In this image, areas enclosed by blue lines have been designated as Ni2Al3 phase, areas enclosed by red lines are considered to be
aluminium-eutectic, with the remaining area between red and blue lines being the intermediate NiAl3phase. The minimum image resolution used in this type of analysis
Figure 5– Grey scale density distribution for the particle shown inFigure 3.
Figure 6– A zoomed-in portion of Figure 3showing the use of the ImageJ contour plotting add-on to establish density ranges for each phase.
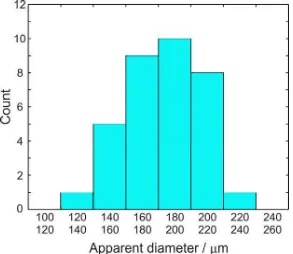
[image:11.595.120.476.420.688.2]density data from a series of ellipses of decreasing size. Within the macro, density data for each ellipse was subtracted from the preceding ellipse in order to produce density data for a series of annuli. The width of each annulus was 15 µm, with the procedure of reducing the ellipse axes 30 µm at a time being repeated until the centre of the particle was reached. This would typically result in six annular regions per particle (see Figure 3), although a lesser number resulted for particles with the smallest apparent diameter. The macro then converted the annular greyscale data to a tabular output consisting of annulus mid-point diameter versus phase fraction for each particle. A total of 34 different particles were analysed by this method. The distribution of the apparent diameters of the particles surveyed, as they appear in cross-section, is as shown inFigure 7.
To cross check the reproducibility of the method four particles were selected at random and their phase composition independently re-examined and compared to the original determination. It was found that the mean (RMS) variation in the volume phase fraction of Ni2Al3, which is the main phase we will subsequently focus on, was
0.38% (0.73%), with the largest individual difference being 1.25%. As an approximate guide we would estimate the accuracy of the technique as around
[image:12.595.153.446.376.630.2]0.5 at.%. As this is much smaller than the variation between different particles reported below we judge that the method is an appropriate means to determine the phase composition of gas atomized particles.
3 Results
The volume fraction of the three phases present, as a function of the radial distance from the centre of the particle, r, is shown for two typical particles inFigure 8. The following observations may be made regarding the radial phase variation across the population of droplets investigated here:
1) There is a considerable variation in the phase composition of the particles as a function ofr.
2) This variation within particles does not appear to be random, nor is it in all cases well described by a linear relationship in r. Indeed, in many cases the trend appears to be for there to be a sharp rise in the amount of Ni2Al3retained
near the surface of the particle, with an approximately constant amount of Ni2Al3 near the centre of the particle. The amount of NiAl3 appears in many
cases to show the opposite trend, with less of this phase being present at the surface of the particle. This is apparent in the three points nearest the surface for the two particles shown.
3) No clear trend is observed in relation to the volume fraction of Al-eutectic. 4) Notwithstanding the observed phase variation within particles, there is an at
[image:13.595.89.507.360.702.2]least comparable variation in the mean level of the phases present between particles.
The variability in the phase composition between the particles studied here is depicted inFigure 9a-c, in which we plot histograms of the mean volume fraction per particle for the three phases present. The mean and 2 sigma limits are 38.1 5.5, 45.9 6.2 and 16.1 3.3 volume % for Ni2Al3, NiAl3 and Al-eutectic respectively, with these
limits being indicative of the level of natural variability we observe between particles from the same batch of powders. Although the phase composition of gas atomized Raney-Ni precursors has been extensively studied by both X-ray and neutron diffraction [13, 21] the large degree of variability observed between particles will not have been evident from such studies, although the variability within particles has been alluded to. In [21] a comparative analysis of gas atomized Raney-Ni precursors by neutron and X-ray diffraction is presented. With respect to the differences between the neutron and X-ray data sets and noting that neutrons will penetrate the whole
particle but that X-rays are limited to a penetration depth of < 5 m the authors
conclude that ‘the surface layer in a grain on the average contains relatively more of the Al3Ni2 phase than the bulk’, which is consistent with the findings presented here.
[image:14.595.94.506.321.661.2]With respect to Figure 9a we also note that the distribution appears to be bimodal, a point to which we will return subsequently.
Figure 9– Average phase composition for the particles investigated in this study. The possibly bimodal distribution for Ni2Al3content is highlighted.
The radial variation in the phase composition within particles has been characterised with reference to the Ni2Al3 phase only, this being the most reliable indicator of the
uniform network of dendritic fragments of Ni2Al3were formed throughout the
sample, either by direct solidification from the liquid or via the NiAl + L Ni2Al3
peritectic going to completion. During the subsequent Ni2Al3 + LNiAl3 peritectic
some of this Ni2Al3 will be converted to NiAl3, wherein a reduction in the amount of
Ni2Al3 observed will be recorded. Due to the large variability in the phase
composition between particles the variation within particles has been characterised by determining the difference in Ni2Al3 composition between the inner and outer annuli
of each particle, rather than by the absolute amount of the phase present. A histogram of these results is given as Figure 10, in which a positive difference indicates more Ni2Al3being retained in the outer annulus.
As with the phase composition between particles, very significant variability within particles is observed. The variation range is -5.0 to +9.5 vol.%, with the mean, RMS and 2 sigma limits being 2.8, 4.8 and 4.0 vol. % respectively. Given the small size of the droplets the extent of the radial variation within droplets is quite surprising, although it is consistent with the findings of [21], wherein differences between the Ni2Al3 phase fraction as determined by neutron and X-ray diffraction on 150-212 m
powders of the order of 10 wt.% were observed. Equally surprising is the fact that a small number of droplets show a negative variation, i.e. that more Ni2Al3 is retained
in the centre of the droplet than at its surface. This is the opposite of what would be expected for a droplet which is cooling more rapidly at its surface than in the centre, as more time should be available in the droplet centre for the peritectic to proceed. However, when we look at the individual particles which display a large negative variation, these all come from the region circled inFigure 9a, i.e. those particles that already display an anomalously low fraction of Ni2Al3 and which give rise to the
[image:15.595.159.437.447.674.2]apparently bimodal nature of the distribution shown inFigure 9a.
Figure 10– Difference in Ni2Al3content between the centre and outer most annulus
for the particles investigated in this study (positive difference indicates more Ni2Al3
4 Discussion
In terms of the solidification pathway for this alloy we can account for the majority of these observations as follows. During the gas atomization process the melt stream will be repeatedly disrupted so as to form a spray of fine molten droplets which will proceed to cool rapidly. At some point below the liquidus temperature nucleation will occur, resulting in the primary solidification of Ni2Al3. As seems likely from the
microstructure of these larger droplets, the violence of the atomization process will result in fragmentation of these primary dendrites and possibly of the whole droplet as it passes through the secondary atomization zone. For very low undercoolings we may see the growth of NiAl with the subsequent peritectic conversion of NiAl to Ni2Al3
but, as the NiAl + L Ni2Al3 peritectic always appears to go to completion, these
two pathways will still result in an initial Ni2Al3solid. Further Ni2Al3will grow as the
local temperature within the particle drops, until such time as this reaches the Ni2Al3
+ L NiAl3 peritectic temperature, wherein the PR and SSPT phase of peritectic
solidification will convert some of the Ni2Al3 to NiAl3. Further cooling will then
result in the direct growth of NiAl3 from the liquid. This will continue until the
Al-NiAl3eutectic temperature is reached, wherein the remaining liquid will solidify.
We conjecture that the main source of variability between droplets is the undercooling at which primary solidification is nucleated. This variability will arise due to the melt sub-division effect described in the introduction giving rise to variability in the undercooling at which primary solidification is nucleated. In general terms the effects of increased undercooling will be:
i) a reduction in the scale of the microstructure;
ii) a change in the composition of the primary phase. For the case in which the liquidus and solidus lines are of positive slope (which is the case for the Ni-Al system as plotted in Figure 1) the primary phase will become less solute rich as the undercooling increases;
iii) a higher volume fraction of the primary solidification phase, particularly if the undercooling is sufficiently high that any intervening peritectic or eutectic phase transformation can be bypassed;
iv) the formation of metastable phases.
Considerations (i)-(iv) will apply to any metallic melt being subject to gas atomization and we should therefore expect the type of variability observed in this study to be ubiquitous in gas atomized powders, although the extent to how the four considerations listed above impact the final product is, of course, dependent upon the alloy system being considered. Exactly this type of stochastic variation has recently been observed by [31] in a study of Ni-15.0 at% Fe- 25.0 at% Si metal powders. During slow cooling of such powders the normal solidification morphology is a coarse lamellar structure comprising the stable Ni31Si12and1-Ni3Si phases, although
[31] found that in their 212-150 m diameter sieve fraction approximately 7% of particles solidified to a highly refined lamellar structure with a further 7% solidifying to the metastable single-phase Ni25Si9. In the 150-106 m diameter sieve fraction,
In relation to the Ni-Al system, (iii) is clearly important to the catalytic activity which is known to be strongly dependent upon the phase composition of the catalyst [6] and (i) will also play a role in this respect as a finer scale microstructure would be expected to facilitate the SSPT stage of the peritectic conversion of Ni2Al3 to NiAl3
due to the higher specific surface area of the Ni2Al3dendrites. As discussed above (iv)
may be important at very high cooling rates but is not likely to have an impact on the 212-150m diameter particles discussed here while (ii) is discussed in detail below.
It is generally assumed that during cooling and solidification, droplets in the < 1 mm size range will be approximately isothermal, although the results presented here and in [21] would seem to contradict this assumption. To assess the viability of sustaining a differential thermal gradient across such small droplets a simple numerical model has been employed. Assuming radial symmetry, the cooling of a spherical droplet during solidification can be described by
t f L r T r r r t T c 2 2 p 1 (2)
where is the density of the droplet material, cp the specific heat capacity, the
thermal conductivity and L the specific heat capacity. Values for these parameters appropriate to the Al-27.5 at.% Ni alloy studied here are given in Table I.fis the solid fraction, which is given by [32] as
kET T T T f f 1 1 S R S R 1 1 (3)
wherefRis the solid fraction at the end of recalescence,TSis the solidus temperature,
[image:17.595.89.513.548.683.2]TRthe temperature attained at the end of recalescence andkEthe equilibrium partition coefficient.
Table I – Thermophysical properties used in the Al-27.5 at.% Ni cooling model
Quantity Value Range of
application
Units
55.8 + 0.048T - 4.910-5T2 T < 1132 K W m K-1
55.8 T > 1132 K W m K-1
cp(sol) 701 + 0.183(T-273) T < 1132 K J kg-1K-1 cp(liq) 1200 T > 1398 K J kg-1K-1 cp(mush) f*cp(sol) + (1-f)*cp(liq) 1132T1398 K J kg-1K-1
L 43630 J kg-1
3590 Kg m-3
we plot (r) againstras, with reference to Equation (1), this will give a measure of
the thickness, , of the layer transformed during the SSPT phase of the peritectic
transformation. Moreover, for a thin layer, this will also approximate the transformed volume. In order to avoid consideration of the interdiffusion coefficient in the solid-state, which is not known for this system, we have presented the results relative to a characteristic time,0, where0is chosen so as to give the appropriate conversion rate
in the centre of the particle.
The calculation has been performed for a particle of radiusR0 = 105 m and subject to
[image:18.595.156.444.338.569.2]a fixed temperature boundary condition at the particle surface. As this is equivalent to perfect thermal transfer between the droplet and its surroundings this will set an upper limit on the internal thermal gradients that can be sustained within the droplet. The temperature of the boundary is set at 800 K. This is based on [18], in which the cooling rate of gas atomized Al-Cu powders in an atomizer configuration identical to that employed here was studied by analysis of the secondary dendrite arm spacing. For a finite heat transfer coefficient at the droplet surface, the internal temperature profile will be closer to isothermal than predicted by the fixed temperature boundary condition utilised here.
Figure 11 – Results of the cooling rate calculation (solid line) showing the relative difference in time available for the Ni2Al3+ L NiAl3peritectic transformation as a
function of the radial co-ordinate r. Also shown the amount of Ni2Al3 transformed
normalised by the peritectic for the two particles shown in Figure 8(normalised to 0 at the surface and 1 at the centre of the particle).
As can be seen from Figure 11, the model predicts very little transformation of Ni2Al3 to NiAl3 near the surface of the particle (by virtue of the fixed temperature
boundary condition this is by definition zero at r = R0). In contrast, a near constant transformation rate is predicted forr ≤ 0.6R0. Also shown inFigure 11is an estimate
As can be seen, the trend is for near constant transformation rate near the centre of the particle with a sharp decline in the volume of Ni2Al3 transformed near the surface of
the particle, approximately matching the predicted trend. This is highly suggestive that the radial variation in phase composition observed here within particles is due to the variation in cooling rate withr.
In relation to this we note that Ni2Al3is a non-stoichiometric intermetallic and that the
actual stability field for Ni2Al3 spans the composition range 35.9-40.7 at.% Ni. As
noted above, notwithstanding any solute trapping effects that might arise during rapid solidification, both the liquidus and solidus lines for the Ni2Al3 compound have a
positive slope, wherein we note that higher undercooling will result in the formation of Ni-lean Ni2Al3relative to the notional composition. This will in turn alter the phase
composition of the as-solidified product. Conversely, for droplets with zero or very low undercooling the primary solidification phase will be NiAl, with the subsequent rapid peritectic conversion of NiAl to Ni2Al3. With reference to the Al-Ni phase
diagram we note that this should result in the formation of Ni2Al3 which is Ni-rich
relative to the notional composition and to that which forms direct from the melt.
With this in mind we have performed a mass balance calculation to determine the likely composition of the Ni2Al3phase on an individual particle basis for each particle
analysed. The assumptions used are that the composition of the liquid is uniform and exactly equal to 27.5 at.% Ni, that the NiAl3phase is exactly stoichiometric (25 at.%
Ni) and that the Ni concentration of the Al-eutectic, determined from Figure 1, is 2.09 at.% Ni. The range of compositions found is shown in the histogram depicted in
Figure 12. The particles occupying the region of the distribution that corresponds to the highest Ni content (> 40 at.% Ni) in the Ni2Al3 phase are also the particles that
show the anomalously low Ni2Al3 phase fraction in Figure 9a and the negative
difference (more Ni2Al3 retained in the centre of the particles than at the surface) in Figure 10. Once the Ni content of the Ni2Al3 phase has been fixed it is also possible
to use the mass balance calculation to check whether there is any systematic variation in composition across droplets as a function of r. This appears not to be the case. In fact, for the particles studied the average difference between the Ni concentration at the surface of the particle and at its centre, was 0.16 at.%. This is comparable to the error that would arise from the quoted 0.5 at.% reproducibility in the Ni2Al3
determination and compares with a 0.18 at.% average difference in bulk composition between particles estimated in the same manner. From this we conclude that there is no significant evidence for a variation in the droplet composition with radial distance.
Although based on relatively small numbers of observations the inference would appear to be that if the Ni2Al3 is formed via the NiAl + L Ni2Al3 peritectic, the
Ni2Al3 within the droplet is Ni-rich and is relatively resistant to conversion to NiAl3
via the subsequent Ni2Al3+ LNiAl3peritectic. Conversely, Ni2Al3formed directly
from the melt appears Ni-lean (relative to the notional composition) and more readily able to convert to NiAl3. This would be consistent with Equ. (1) as an Ni-lean
composition for the Ni2Al3compound would reduce the size of the term
C C
inIn terms of the crystallography of the Ni2Al3 phase it is essentially a trigonal
extension of the cubic B2 (NiAl) phase with every third plane of Ni atoms perpendicular to the trigonal axis missing [33]. To the Ni-rich side of the stoichiometric composition at 40 at.% Ni, the vacancies associated with the missing plane are progressively filled by Ni atoms but to the Al-rich side of the stoichiometric composition Al replaces Ni on the existing occupied Ni sites [33]. Consequently, an Ni-rich Ni2Al3 phase may have a lower vacancy concentration than either a
[image:20.595.154.437.211.437.2]stoichiometric or Ni-lean composition, potentially affecting both the nucleation of the NiAl3phase and the subsequent leaching behaviour of the catalyst.
Figure 12 – Ni content of the Ni2Al3 phase based on a particle by particle mass
balance calculation for the data shown in Figure 9. The Ni-rich particles circled are the same group as circled inFigure 9a.
The findings presented here allow us to explain a number of aspects of the behaviour of skeletal nickel catalysts produced by gas atomization and have significant implications for the future production and uptake of such catalysts. In particular, the variation in phase composition within particles, and the deficiency of the more catalytically active NiAl3 phase at the particle surface, may explain why
post-solidification crushing of the precursor alloy particles enhances the final activity of the catalyst. It would suggest that such crushing is an essential ingredient in obtaining a homogeneous catalyst, due to both the variation within, and between, particles, which in turn may have implications for the financial viability of gas atomized Raney catalysts. Also, the apparent resistance of Ni2Al3 to undergo the peritectic conversion
to NiAl3at the high cooling rates experienced during gas atomization when the Ni2Al3
has itself been formed from the peritectic conversion of NiAl, may help to explain why the traditional Raney Ni composition of a 50-50 wt% mixture of Ni and Al performs so poorly when gas atomized. The tendency of Ni2Al3 formed direct from
the melt to participate more readily in the Ni2Al3 + L NiAl3 peritectic would then
homogeneous due to the high cooling rates experienced and the lack of segregation, this work indicates that, at least with some alloys, this assumption may not be correct.
5 Summary and Conclusions
The main conclusions from this work may be summarised as follows:
Image analysis has been used to quantify the phase composition of gas atomized Al-27.5 at.% Ni Raney type Ni precursors from backscatter electron images. By dividing each particle into a number of concentric annuli it is possible to quantify both variations within particles (as a function ofr) and the average variation between particles.
Within the 150-212 m size range considered in this study considerable
natural variability in phase composition between particles is observed, with the mean and 2 sigma limits for Ni2Al3, NiAl3 and Al-eutectic being 38.1
5.5, 45.9 6.2 and 16.1 3.3 volume % respectively. This is probably a consequence of variations in the nucleation temperature resulting from the stochastic nature of the nucleation process in small droplets.
Notwithstanding the variation between droplets, considerable variation in the phase composition was also observed within droplets, with typically more Ni2Al3and less NiAl3being observed at the surface of the particles than in the
centre. The average (RMS) excess of Ni2Al3at the surface was found to be 2.8
(4.8) vol. %. This appears to be consistent with more rapid cooling at the surface giving less time for the SSPT stage of the Ni2Al3 + L NiAl3
peritectic.
There is some evidence for a relationship connecting the variation between and within droplets. Specifically, droplets which show the lowest overall amount of the Ni2Al3 phase also tend to show a low difference between the
amount of Ni2Al3found at surface and centre of the particle (or in some cases
less Ni2Al3 at the surface). This may be related to the origin of the Ni2Al3
phase and whether it formed direct from the liquid or via the NiAl + L Ni2Al3peritectic.
6 References
[1] S.R. Montgomery, Catalysis of Organic Reactions, Marcel Dekker, New York, 1981.
[2] Catalytic hydrogenation of carboxylic acids and esters, in, Kyowa Hakko Kogyo Co. Ltd., GB, 1966.
[3] R.J. Allain, V.L. Seale, Acrylonitrile hydrolysis and catalyst useful therefor, in, Nalco Chemical Co., US, 1975.
[4] M. Raney, Method of producing finely-divided nickel, in, US, 1927.
[5] P. Fouilloux, G.A. Martin, A.J. Renouprez, B. Moraweck, B. Imelik, M. Prettre, Texture and structure of Raney nickel, J. Catal., 25 (1972) 212-222.
[7] A.B. Fasman, V.F. Timofeeva, V.N. Rechkin, Y.F. Klyuchnikov, I.A. Sapukov, Effect of the composition of a nickel-aluminum alloy on the structure and specific activity of a Raney nickel catalyst, Kinet. Katal., 13 (1972) 1513-1519.
[8] R. Wang, H. Chen, Z. Lu, S. Qiu, T. Ko, Structural transitions during aluminum leaching of NiAl3 phase in a Raney Ni-Al alloy, J. Mater. Sci., 43 (2008) 5712-5719. [9] A.J. Smith, D.L. Trimm, The preparation of skeletal catalysts, Annu. Rev. Mater. Res., 35 (2005) 127-147.
[10] M.L. Bakker, D.J. Young, M.S. Wainwright, Selective leaching of nickel-aluminum (NiAl3 and Ni2Al3) intermetallics to form Raney nickels, J. Mater. Sci., 23
(1988) 3921-3926.
[11] H. Warlimont, U. Kuehn, N. Mattern, Rapidly quenched Raney catalyst precursors, Mater. Sci. Eng. A, 226-228 (1997) 900-904.
[12] H. Lei, Z. Song, D. Tan, X. Bao, X. Mu, B. Zong, E. Min, Preparation of novel Raney-Ni catalysts and characterization by XRD, SEM and XPS, Appl. Catal. A, 214 (2001) 69-76.
[13] D. Tourret, G. Reinhart, C.-A. Gandin, G.N. Iles, U. Dahlborg, M. Calvo-Dahlborg, C.M. Bao, Gas atomization of Al-Ni powders: Solidification modeling and neutron diffraction analysis, Acta Mater., 59 (2011) 6658-6669.
[14] F. Devred, G. Reinhart, G.N. Iles, B. van der Klugt, N.J. Adkins, J.W. Bakker, B.E. Nieuwenhuys, Synchrotron X-ray microtomography of Raney-type nickel catalysts prepared by gas atomisation: Effect of microstructure on catalytic performance, Catal. Today, 163 (2011) 13-19.
[15] A. Ilbagi, H. Henein, A.B. Phillion, Phase quantification of impulse atomized Al68.5Ni31.5 alloy, J. Mater. Sci., 46 (2011) 6235-6242.
[16] M. Kearns, Development and applications of ultrafine aluminum powders, Mater. Sci. Eng. A, 375-377 (2004) 120-126.
[17] N. Zeoli, S. Gu, S. Kamnis, Numerical modelling of metal droplet cooling and solidification, Int. J. Heat Mass Transfer, 51 (2008) 4121-4131.
[18] A.M. Mullis, L. Farrell, R.F. Cochrane, N.J. Adkins, Estimation of cooling rates during close-coupled gas atomization using secondary dendrite arm spacing measurement, Metall. Mater. Trans. B, 44 (2013) 992-999.
[19] H.W. Kerr, W. Kurz, Solidification of peritectic alloys, Int. Mater. Rev., 41 (1996) 129-164.
[20] D.H. St John, L.M. Hogan, A simple prediction of the rate of the peritectic transformation, Acta Metall., 35 (1987) 171-174.
[21] C.M. Bao, U. Dahlborg, N. Adkins, M. Calvo-Dahlborg, Structural characterisation of Al-Ni powders produced by gas atomisation, J. Alloys Compd., 481 (2009) 199-206.
[22] C. Pohla, P.L. Ryder, Crystalline and quasicrystalline phases in rapidly solidified AI-Ni alloys, Acta Mater., 45 (1997) 2155-2166.
[23] O. Shuleshova, D. Holland-Moritz, W. Löser, G. Reinhart, G.N. Iles, B. Büchner, Metastable formation of decagonal quasicrystals during solidification of undercooled Al-Ni melts: In situ observations by synchrotron radiation, EPL, 80 (2009).
[24] O. Shuleshova, W. Löser, D. Holland-Moritz, D.M. Herlach, J. Eckert, Solidification and melting of high temperature materials: in situ observations by synchrotron radiation, J. Mater. Sci., 47 (2012) 4497-4513.
[25] F. Devred, G. Reinhart, G.N. Iles, U. Dahlborg, M. Calvo-Dahlborg, ESRF Experimental report HS-3612, in, 2009.
[27] I.E. Anderson, R.S. Figliola, H. Morton, Flow mechanisms in high-pressure gas atomization, Mater. Sci. Eng. A, 148 (1991) 101-114.
[28] M. Libera, G.B. Olson, S. Vander, Heterogeneous nucleation of solidification in atomized liquid metal droplets, Mater. Sci. Eng. A, 132 (1991) 107-118.
[29] A. Ilbagi, H. Henein, J. Chen, D.M. Herlach, R. Lengsdorf, C.-A. Gandin, D. Tourret, A. Garcia-Escorial, Containerless Solidification and Characterization of Industrial Alloys (NEQUISOL), Journal of Physics: Conference Series, 327 (2011). [30] C.A. Schneider, W.S. Rasband, K.W. Eliceiri, NIH Image to ImageJ: 25 years of image analysis, Nature Methods, 9 (2012) 671-675.
[31] L. Cao, A.M. Mullis, R.F. Cochrane, Solidification morphology and phase selection in drop-tube processed Ni-Fe-Si intermetallics, Intermetallics, 60 (2015) 33-44.
[32] M.C. Flemings, Solidification Processing, McGraw Hill, NY, 1974.