UNIVERSITI TEKNIKAL MALAYSIA MELAKA
A NEW INVESTIGATION METHOD OF POWER QUALITY
BEHAVIOR AND IMPROVE BY USING LOW SINGLE
PHASE INVERTER
This report submitted in accordance with requirement of the Universiti Teknikal Malaysia Melaka (UTeM) for the Bachelor’s Degree in Electronics Engineering Technology (Bachelor's Degree in Electronics Engineering Technology (Industrial
Electronics) with Honours) (Hons.)
by
SITI MAHFUZAH BINTI YAHAYA B071310093
900525016122
UNIVERSITI TEKNIKAL MALAYSIA MELAKA
BORANG PENGESAHAN STATUS LAPORAN PROJEK SARJANA MUDA
TAJUK: A NEW INVESTIGATIONMETHOD OF POWER QUALITY BEHAVIOR AND IMPROVEBY USING LOW SINGLE PHASE INVERTER
SESI PENGAJIAN: 2016/17 Semester 1
Saya SITI MAHFUZAH BINTI YAHAYA
mengaku membenarkan Laporan PSM ini disimpan di Perpustakaan Universiti Teknikal Malaysia Melaka (UTeM) dengan syarat-syarat kegunaan seperti berikut:
1. Laporan PSM adalah hak milik Universiti Teknikal Malaysia Melaka dan penulis. 2. Perpustakaan Universiti Teknikal Malaysia Melaka dibenarkan membuat salinan
untuk tujuan pengajian sahaja dengan izin penulis.
3. Perpustakaan dibenarkan membuat salinan laporan PSM ini sebagai bahan pertukaran antara institusi pengajian tinggi.
4. **Sila tandakan ( )
SULIT
TERHAD
TIDAK TERHAD
(Mengandungi maklumat yang berdarjah keselamatan atau kepentingan Malaysia sebagaimana yang termaktub dalam AKTA RAHSIA RASMI 1972)
(Mengandungi maklumat TERHAD yang telah ditentukan oleh organisasi/badan di mana penyelidikan dijalankan)
Alamat Tetap:
2, JALAN LADING 22, TAMAN PUTERI WANGSA, 81800, ULU TIRAM, JOHOR.
Tarikh: ________________________
Disahkan oleh:
Cop Rasmi:
Tarikh: _______________________
DECLARATION
I hereby, declared this report entitled “A New Investigation Method of Power Quality Behavior And Improve by Using Low Single Phase Inverter” is the
results of my own research except as cited in references.
Signature : ……….
Author’s Name : SITI MAHFUZAH BINTI YAHAYA
APPROVAL
This report is submitted to the Faculty of Engineering Technology of UTeM as a partial fulfillment of the requirements for the degree of Bachelor of Engineering Technology (Department of Electronics & Computer Engineering Technology) (Bachelor's Degree in Electronics Engineering Technology (Industrial Electronics) with Honours). The member of the supervisory is as follow:
i
ABSTRAK
ii
ABSTRACT
iii
DEDICATION
Thank you to Allah S.W.T to give me a chance to finished this project even I have a lot of problem during project. To my beloved parent, my mother Che Hasmah binti Che Hussin for the soul that she gives, my dad Yahaya bin Hassan to the spirit word for me and all my sibling for their understanding.
Mohd Khairolnizam Binti Yahaya Mohd Fadilrollah bin Yahaya
Mohd Sharhan bin Yahaya Siti Noor Aishah binti Yahaya
iv
ACKNOWLEDGEMENT
I would like to thank En Nik Azran bin Ab. Hadi as my supervisor for her guidance on completing this project. I would also like to thank all my friends that support me during working on this project.
All praise to Allah S.W.T for giving me with health and opportunity to gain this treasure of knowledge and experience to complete this project. First and foremost, I would like to thank to our Universiti Teknikal Malaysia Melaka (UTeM) for helping me funding this project.
v
TABLE OF CONTENT
DECLARATION APPROVAL
ABSTRAK i
ABSTRACT ii
DEDICATION iii
ACKNOWLEDGEMENT iv
TABLE OF CONTENT v
LIST OF TABLE viii
LIST OF FIGURES ix
LIST OF ABBREVIATIONS, SYMBOLS AND NOMENCLATURE xiii CHAPTER 1
INTRODUCTION
1.0 INTRODUCTION 1
1.1 PROJECT BACKGROUND 1
1.2 PROBLEM STATEMENT 2
1.3 OBJECTIVE 3
1.4 SCOPE 3
1.5 PROJECT SIGNIFICANCE 4
CHAPTER 2
LITERATURE REVIEW
2.0 INTRODUCTION 5
2.1 POWER QUALITY 6
2.2 HARMONICS 8
2.2.1 Measurement of Harmonics distortion 8
2.2.1.1 Harmonics factor (distortion factor, DF) 8
2.2.1.2 Total harmonic distortion (THD) 8
2.2.1.3 Individual harmonic distortion (IHD) 9
2.2.1.4 Total demand distortion (TDD) 10
2.2.1.5 Harmonic effects 10
vi 2.2.1.7 Indicator for irregularities harmonic 10
2.3 POWER FACTOR 10
2.3.1 Definition of reactive power 11
2.4 FLICKER 11
2.5 INVERTER 12
2.5.1 Inverter Output Waveform 14
2.5.2 Pulse Width Modulation as a Signal Generator for Inverter 15
2.6 RELATED PROJECT 15
2.6.1 Basic Inverter 15
2.6.2 Square wave inverter 17
2.6.3 Full Bridge Inverter 18
2.6.4 PWM Inverter 18
2.6.4.1 PWM output 19
2.6.5 Multilevel Inverter 21
2.7 CONCLUSION 24
CHAPTER 3 METHODOLOGY
3.0 INTRODUCTION 25
3.1 PROJECT PLANNING 25
3.2 SELECTION OF INVERTER 29
3.2.1 Input of Inverter 31
3.2.1.1 Batteries 31
3.2.1.1.1 Type of Car Batteries 32
3.2.1.1.2 Battery Capacity Rating 32
3.2.2.1 Calculation of Power Input 34
3.2.2.2 Runtime of Battery 34
3.3 TYPE OF ELECTRONICS SWITCH 35
3.3.1 Transistor 35
3.3.1.1 Type of transistor 36
3.4 CIRCUIT PROTECTION 36
3.5 DRAWING CIRCUIT 37
vii
3.7 ETCHING PROCESS 37
3.7.1 Manually 37
3.7.2 Automatically 38
3.8 SOLDERING PROCESS 39
3.9 TESTING 40
3.9.1 Method to Testing 42
3.10 SUMMARY 43
CHAPTER 4
RESULT & DISCUSSION
4.0 INTRODUCTION 44
4.1 HARDWARE IMPLEMENTATION AND ANALYSIS 44
4.1.1 Analysis in Laboratory 44
4.1.1.1 Find the Line 44
4.1.1.2 Collecting Data (Before Class) 45 4.1.1.3 Collecting Data (During Class) 50 4.2 THE COMPARISON BETWEEN AVR WHITE vs AVR BLACK 53
4.2.1 The different between AVR 53
4.3 RESULT OF THE PROJECT 57
4.4 DISCUSSION OF SYSTEM 58
4.5 DATA (AFTER THE EQUIPMENT WAS COMPLETED) 59
CHAPTER 5
CONCLUSION & FUTURE WORK
5.0 INTRODUCTION 61
5.1 CONCLUSION 62
5.2 PROBLEM 62
5.3 RECOMMENDATION 63
5.4 FUTURE WORK 63
viii
LIST OF TABLE
Table 2.1: Table of Voltage, Individual Harmonics and Total Harmonics Distortion
7
Table 2.2: Table of Current Distortion Limits at Stc 7
Table 2.3: Table of Individual Total Harmonics 9
Table 3.1: Table of H-Bridge Operation 29
Table 3.2: Type of Battery 34
Table 4.1: Table of Data Avr (Black) 54
Table 4.2: Table of Data Avr (White) 54
Table 4.3: The Specification of Avr (White) Vs Avr (Black) 56
Table 4.4: Table of Data from Rectifier 59
ix
LIST OF FIGURES
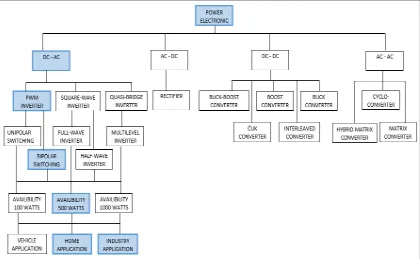
Figure 1.1: K-Chart of the Technique and System 4
Figure 2.1: Example of Power Inverter in Market 13
Figure 2.2: Basic Circuit of H-Bridge 16
Figure 2.3: Output Waveform of Square Wave Inverter 17
Figure 2 4: Bifurcation Diagrams of System 18
Figure 2.5: Example of Output Waveform on PWM Inverter 19
Figure 2.6: Circuit of Multilevel Inverter 22
Figure 2.7: Output of Multilevel Inverter 22
Figure 3.1: Flowchart of the Process 26
Figure 3.2: Inverter Block Diagram 27
Figure 3.3: The Relationship About Inverter Block Diagram 27
Figure 3.4: Figure of Gantt Chart 28
Figure 3.5: The Circuit of Basic Inverter (H-Bridge) Using Psim Software 29
Figure 3.6: Etching Machine 38
Figure 3.7: Etching Solution and Container 38
Figure 3.8: Example of Drill Bit Used for Drilling Hole on PCB 39 Figure 3.9: Example of Soldering Station and Solder 40
Figure 3.10: PCB Board After Soldering Process 40
x
Figure 3.12: Figure of Power Analyzer 42
Figure 3.13: The Method of Measurement Power Quality 42
Figure 3.14: The Value of the Reading 43
Figure 3.15: The Example of the Display Value in Excel 43
Figure 4.1: The Layout of the Laboratory 45
xi Figure 4.19: Graph of Voltage Vs Time (Red- with and without Avr) 49 Figure 4.20: Graph of Power Vs Time (Red- with and without Avr) 49 Figure 4.21: Graph of Power Vs Time (Red- with and without Avr) 49 Figure 4.22: Graph of Power Vs Time (Red- with and without Avr) 50 Figure 4.23: Graph of Current Vs Time (Yellow-During Class) 50 Figure 4.24: Graph of Power Factor Vs Time (Yellow-During Class) 50 Figure 4.25: Graph of Power Vs Time (Yellow-During Class) 50 Figure 4.26: Graph of Voltage Fluctuation Vs Time (Yellow-During Class) 51 Figure 4.27: Graph of Voltage Vs Time (Blue-During Class) 51 Figure 4 28: Graph of Current Vs Time (Blue-During Class) 51 Figure 4.29: Graph of Power Factor Vs Time (Blue-During Class) 51 Figure 4.30: Graph of Power Vs Time (Blue-During Class) 51 Figure 4.31: Graph of Voltage Fluctuation Vs Time (Blue-During Class) 52 Figure 4.32: Graph of Voltage Vs Time (Red-During Class) 52 Figure 4.33: Graph of Current Vs Time (Red-During Class) 52 Figure 4.34: Graph of Power Factor Vs Time (Red-During Class) 52 Figure 4.35: Graph of Power Vs Time (Red-During Class) 52 Figure 4.36: Graph of Voltage Fluctuation Vs Time (Red-During Class) 53
Figure 4.37: The Graph of Input Vs Avr(White) 54
Figure 4.38: The Graph of Input Vs After Avr(White) 54
Figure 4.39: The Graph of Input Vs Avr(Black) 55
xii Figure 4.41: The Graph of Avr(White) Vs Avr(Black) 55 Figure 4.42: The Graph of After Avr(White) Vs After Avr(Black) 55
Figure 4.43: The Avr (White) 55
Figure 4.44: The Avr (Black) 55
Figure 4.45: The Inverter Circuit 57
Figure 4.46: Testing of the Inverter Circuit 57
Figure 4.47: The Testing of Rectifier Circuit 58
xiii
LIST OF ABBREVIATIONS, SYMBOLS AND
NOMENCLATURE
AC - Alternating Current
DC - Direct Current
PWM - Pulse Width Modulation THD - Total Harmonics Distortion
PCB - Individual Total Harmonics Distortion DF - Distortion Factor
STC - Standard Test Condition UPS - Uninterrupted Power Supply
AH - Ampere Hour
PCC - Point of Common Coupling CSI - Current Source Inverter VSI - Voltage Source Inverter TDD - Total Demand Distortion
PF - Power Factor
SPWM - Sinusoidal Pulse Width Modulation CCA - Cold Cranking Ampere
CA - Cranking Ampere
BJT - Bipolar Junction Transistor
MOSFET Metal Oxide Semiconductor Field Effect. Transistor IGBT - Insulated Gate Bipolar Transistor
1
CHAPTER 1
INTRODUCTION
1.0 INTRODUCTION
This chapter is overall view about this project. It was included the project background, the problem statement, objective, and scope of this project.
1.1 PROJECT BACKGROUND
Power electronics industries is growing faster in the Electrical Engineering field. Application of solid-state is to conversion and control the electric power [1]. This research is referring to the electrical and electronic engineering design, control, computation. Electrical power is divided into two (2) types which are Alternating Current (AC) and Direct Current (DC). These two types of power can be converted through four different methods. These methods include AC to DC, DC to AC, DC to DC and AC to AC. The conversion of DC to AC can be done through an inverter circuit while a rectifier (full bridge) is an electronic circuit that will convert AC power to DC power.
2 converter (H-bridge) with using a low pass LC filter to get the smoothest of sinusoidal output. And the only way to control the switching is only using generating signals.
For low power inverter, it can be done by combinations of 555 timer and flip flop, also can generate using PIC microcontroller since it has their own PWM in the package. But for high power of inverter, PWM is widely used to control the switching especially for induction motor, photovoltaic solar power etc. PWM technique is divided into two ways includes unipolar and bipolar inverters method.
This study is to identify issues that may occur in the laboratory. Laboratory equipment is often damaged by power quality such as over voltage, under voltage, flicker, and others. Because of that, the equipment in the lab is often damage and the performance of that equipment decreases and do not save the maintenance cost of the equipment.
The project is closely linked to the inverter. Inverters are devices used to convert DC-AC supply. This project in its early stages, there is a rectifier circuit that converts AC-DC power supply is then converted back to AC supply via the inverter and there is also a back-up supply of batteries. The battery acts as the power supply which powers the circuit so that no damage occurred as happened to the equipment in the lab.
In addition, the project is also related to the power quality. Where it is needed in the analysis of the project and that funding should solve a problem from the problem statement on that project and it will achieve the objectives of the research project.
1.2 PROBLEM STATEMENT
3 behaviour issues. For the project, it needs to find a suitable technique for DC to AC converter or inverter and study the principle operation of that method.
In addition, for the previous project, the battery is not used as a backup to the main supply. Within the project, the design of the inverter will be designed with the aim to reduce disturbance when the power supply with battery as a backup. The project is designed to reduce variability in the circuit, and to minimize the damage and maintenance cost.
1.3 OBJECTIVE
• To study the behaviour in power quality in electrical supply. Study about the factor that make the power quality in electrical supply faulty.
• To define the switching technique for DC-AC converter or inverter and knows as the principle operation. Learn about the inverter DC-AC technique and the way of the operations.
• To learn the method for analysing and designing the inverter with battery as a backup. Study the best method and analysis the method and the design of the inverter with the other supply as the backup.
1.4 SCOPE
4
1.5 PROJECT SIGNIFICANCE
[image:21.595.115.535.228.487.2]This project will benefit students who use the lab as well as to reduce the level of damage to the equipment in the lab. Therefore, it is very useful to a lot of parties, in the future this project can be widely used in laboratory, especially for addressing the issue of power quality.
Figure 1.1: K-Chart of the technique and system
5
CHAPTER 2
LITERATURE REVIEW
2.0 INTRODUCTION
This chapter is summarized about the literature review of this project. To complete this project also, some researches about the previous system also been studied and explore. It is a frame of text that aims to review critical pint of current knowledge for any related information and reviews on Inverter and awareness about power quality system. These chapters also consist of aim to show all related studies, formula, result, history, type and function of Inverter to show the relationship with this project
2.1 POWER QUALITY
6 Power Control System is to determine the limits for voltage harmonics. The coupling is between the utility distributions to the end user. The standard is applied requiring the two sides. The prescribed standard is 5% of the amount of current and voltage distortion for each customer. The maximum individual harmonic components of low voltage from 69kV to be 3%. The inverter output, total harmonic distortion allowed less than 5% and not less than 25% for individual harmonics of odd harmonic limits should be lower.
2.2 HARMONICS
Nowadays, common power electronic equipment has led to harmonic distortion in the power system. Main concerns that led to the distortion caused significant harmonic distortion can be in electronic equipment, electrical machinery, and transformer. In an easy word, harmonics distortion is the corruption of the fundamental sine wave at frequencies that are multiples of the fundamental. In addition, potential occurrence of harmonic resonance is when the network has a capacitor bank.
7
Table 2 1: Table of Voltage, Individual Harmonics and Total Harmonics Distortion
Bus voltage V at PCC* Individual Harmonics (%) Total Harmonics Distortion THD(%)
V ≤ 1.0kV 5.0 8.0
1kV ≤ V ≤ 69kV 3.0 5.0
69kV ≤ V ≤ 161kV 1.5 2.5
161kV < V 1.0 1.51
1 high-voltage systems can have up to 2.0% THD where the cause is an HVDC terminal whose effects will have attenuated at points in the network where future users may be connected.
*PCC is Point of Common Coupling. It is the location of the harmonics voltage and current distortion to be calculated or measured.
Table 2 2: Table of Current Distortion Limits at sTC
Current Distortion Limits at STC* (IEC 61727)
Odd harmonics Distortion limit
3rd through 9th Less than 4.0% 11th through 15th Less than 2.0% 17th through 21st Less than 1.5% 23rd through 33rd Less than 0.6%
Even harmonics Distortion Limit
2nd through 8th Less than 1.0%
10th through 32nd Less than 0.5%
Current Distortion Limit at STC*
[image:24.595.111.505.486.719.2]