PROGRAMME FOR RESEARCH AND ACTIONS ON THE
DEVELOPMENT OF THE LABOUR MARKET
NEW FORMS AND NEW AREAS
OF EMPLOYMENT GROWTH
FINAL REPORT FOR THE UNITED KINGDOM
IOCU
Í! DOCUMENTACI
OF THE EUROPEAN
This document has been prepared for use within the Commission. It does not necessarily represent the Commission's official position.
Cataloguing data can be found at the end of this publication.
Luxembourg: Office for Official Publications of the European Communities, 1987 ISBN 92-825-7198-X
Catalogue number: CB-49-87-486-EN-C
© ECSC-EEC-EAEC, Brussels - Luxembourg, 1987
Commission of the European Communities
Programme for Research and Actions on the Development of the Labour Market
NEU FORNS ANO NEU AREAS CF EMPLOYMENT GROUTH
FinaL report for UK
By
R.A. WILSON & D.I.. BOSWORTH Institute for Emplovment Research
University of Warwick Coventry CV4 7AL
United Kingdom
This document has been prepared for use within the Commission. It does not necessarily represent the Commission's, official position.
Copyright ECSC-EEC-EAEC, Brussels - Luxembourg, 1987
The research (study 85/8/A ) o n wh i c h these reports were based was financed by the Cu ¡»m ission of the European Communities as part of its programme of Research and Actions on the Development of the Labour Market.
Contents
List of Tables List of Figures
Preface and Acknowledgements
1. SUMMARY
2. RECENT DEVELOPMENTS IN WORK PATTERNS IN THE UK 2.1 Introduction
2.2 The Changing Industrial Structure of Employment Developments in Occupational Structure
2.3
2.4 Growth of the Proportion of Persons with Formal Qualifications
2.5 The Increasing Share of Females in Total Employment 2.6 The Increasing Importance of Part-time Work
2.7 The Recent Growth in Self-employment 2.8 Hours of Work
2.9 Shiftwork and Unsocial Times of Work 2.10 Magnitude of the Informal Economy 2.11 Allocation of Time
2.12 The Upward Trend in Unemployment
2.13 New Forras of Employment and Work Patterns
CHANGING FORMS OF EMPLOYMENT : JOB CONTENT 3.1 Introduction
3.2 Changes in the Occupational Structure of Employment 3.3 Increases in the Numbers with Formal Qualifications 3.4 Other Aspects of Changing Job Content
NEW FORMS OF EMPLOYMENT : CONTRACTUAL ARRANGEMENTS 4.1 Introduction
Page iii
ν vi
3 . 3
4 6
11 14 14 16 PO 23 28. 29 34 35
39 39 39 51 58
Page
4.2 Temporary Work 63
4.3 Homeworking and Outworking 65
4.4 Part-time Working 66
4'. 5 Hours of Work 68
4.6 Shiftwork and Unsocial Hours 72
4.7 Self-employment 78
4.8 The Informal Economy 80
4.9 Government Special Employment and Training Schemes 88
5. NEW AREAS OF EMPLOYMENT GROWTH 94
5.1 Recent Developments in Industrial Employment 94
5.2 Some Possible Explanations 104
5-3 Future Prospects 107
6. CONCLUSIONS 111
6.1 New Formò and New Areas of Employment 111
6.2 Policy Issues 115
6.3 Recommendations on Data and Research 122
Appendix A Shift-share Analysis 125
appendix Β UK Data Sources on Employment Structure 129
References 139
List of Tables
Page
2. i Employment by Broad Industry Sector, 1950-85 5
2.2 Employment by Occupation, 1971-84 7
2.3 Changes in the Proportions of Those Qualified at Advanced
Level, 1971-81 12
2.4 Female Employment Shares, 1950-85 15
2.5 . Growth of Part-time Employment in Great Britain, 1951-86 15
2.6 Self-employment as a Percentage of Total Employment, 1950-85 17
2.7 Businesses by Turnover Size, 1984 19
2.8 Normal and Actual Hours of Work, 1950-85 21
2.9 Overtime and Snort-time Working, 1950-85 22
2.10 Basic Holiday Entitlements, 1951-85 24
2.11 Trends in the Incidence of Shiftworking, 1970-85 25
2.12 Time Spent on Main Activities by Employment Groups, 1974 27
2.13 Allocation of Time, 1983 31
2.14 Average Percentage Participation, 1974 and 1983 33
3.1 Changes in Occupational Employment, 1971-81 42
3.2 Changes in Occupational Employment, 1981-84 43
3.3 Changes in Occupational Employment, 1984-90 44 3.4 Ranking of Occupations by Percentage Growth in Employment,
1971-81 46
3.5 Analysis of Changes in the Numbers of Highly Qualified
Persons, 1971-81 52
3.6 Detailed Analysis of Changes in the Numbers of the
Highly Qualified, 1971-81 54
4.1 Access to Capital Equipment by the Employed and
Unemployed, Brighton, 1982 (males) 82
4.2 Special Employment and Training Measures, I98I-87 89
5.1 Output and Output per Person by Broad Industrial Sector 95
Page
5.3 Employment Growth in Services, 1950-85 98
5.4 Ranking of Industries by Percentage Growth in Employment,
1971-85 . 100
List of Figures
Page
2.1 Changes in Industrial and Occupational Employment, 1971-81 8
2.2 Changes in Industrial and Occupational Employment, 1981-84 9
2.3 Changes in Industrial and Occupational Employment, 1984-90 10
PREFACE AND ACKNOWLEDGEMENTS
This report by Rob Wilson and Derek 3osworth represents the draft final report for the UK of an international comparative research project entitled 'New Forms and New Areas of Employment Growth'. The aims of the project were to review recent developments in employment patterns; to assess the likely direction of future trends; to identify the limitations of currently available data in this area; to make suggestions for further research; and to consider the policy implications which arise.
The project has been funded by the Commission of the European Communities (Directorate General V) and co-ordinated by Professor Robert Lindley of the Institute for Employment Research, University of Warwick. The Institute gratefully acknowledges the helpful discussions with fellow participants.: Henri Nadel and Laurent Schwab (France);· Kurt Vogler-Ludwig (Germany); Bruno Contini (Italy); Tammo Oegema and Chris Van der Vegt (Netherlands); Andrew Chapman, Klaus Kaeding and John Morley (Commission DG,V); and Anne Houtman (Eurostat). The views expressed in this report are, however, the responsibility of the authors.
1. SUMMARY
The objectives of this report are to consider the ways in which employment and work' patterns are changing in the UK economy and to assess the implications of these trends for government policy. In Chapter 2 the main features of recent developments are described. These include : the changes in the industrial structure of employment in favour of services; the shift in occupational employment shares in favour of white collar professional jobs; the growth in the importance of formal qualifications; the increased participation of females in the formal economy; the growth of part-time work; the increase in self employment; the fall in average hours worked; the increasing importance of shiftworking; the growth of the informal economy; significant changes in the domestic allocation of time; and finally the apparently inexorable rise in unemployment. The reason for these developments and the links between them are outlined.
Most of these changes have been in train for many years. However a number of important new features appear to be emerging. Chapter 3 is concerned "with job content. This encompasses not just the changing occupational structure of employment and the qualifications people hold but other aspects concerned with the skills and knowledge required to undertake different jobs. It also highlights the way in which the boundaries between jobs are changing.
In Chapter 4 we concentrate upon changes in contractual arrangements. This is defined very broadly to include not just the formal contract of employment but the changing boundaries between work in the formal economy, domestic work, the black economy and so on.
The growth of part-time work, the increase in self-employment, as well as changing patterns of hours and shift-work, appear to be aspects of the attempts by firms to introduce more flexibility in their Input of labour services. In recent years this has also been associated with the increasing fragmentation of jobs characterised by the use of temporary and casual workers, freelances and outworkers rather than full-time permanent workers. This strategy has been characterised as leading to a dual labour market with a group of core workers (with well paid secure jobs) and secondary workers (with varying degrees of attachment to the firm, poor pay and poor job prospects). Another feature of recent developments is the blurring of boundaries between: domestic work and leisure; formal and informal work; and different types of employment contract. The changing pattern of the allocation of time within households and the growth of the informal economy are two major features that are highlighted.
without a major investment in infrastructure in telecommunications. Areas of employment that were in the past major sources of adiitional jobs such as health and education services appear to have reached a limit beyond which it is impossible to increase employment significantly without radically changing the way in which they are provided.
The overall prospects for unemployment therefore are very gloomy with little prospect of any significant decline to the end of the current decade. This in conjunction with the fragmentation of jobs seem? likely to lead to a growth in the importance of the informal economy.
The implications for government policy are manifold. They are considered in detail in Chapter 6. The most important are concerned with the rise in unemployment and the increasing trend towards a divided dual economy. Various suggestions are made as to how employment might be stimulated. These include: measures to strengthen the manufacturing sector (although this is not seen as a direct source of additional jobs); investment in infrastructure, both traditional (roads, dwellings) and novel (telecommunications Γ; 'changes in modes of provision of health and education services; and finally measures to stimulate the growth of employment in the informal economy.
2. RECENT DEVELOPMENTS IN WORK PATTERNS IN THE UK
2.1 Introduction
This chapter provides a summary of how work patterns have altered in the UK over recent years. It is concerned both with the structure of employment as well as other aspects of working patterns such as the allocation of time by households, contractual arrangements and the changing nature of work in a developed economy. Many of the changes that can be observed in work patterns have been going on for a very long time. For example, the evolution from a predominantly agrarian to an industrialised economy following the industrial revolution, resulted in vary dx'amatic change in employment patterns. In more recent years this process of economic development has continued with the decline of manufacturing, and the growth of services. These broad' trends reflect the impact of technological change and rising real incomes. Associated with them have been very substantial changes in other aspects of employment structure 'and working patterns.
Over the last 30-40 years the main developments may be summarised as follows :
(1) continued changes in the industrial structure of employment, with the shift from primary and manufacturing industries into services being the main feature;
(2) a shift in employment from so called "blue-collar" or manual jobs towards "white-collar" or "non-manual" jobs;
(3) a very substantial increase in the proportion of employees holding formal qualifications (eg. at the higher level, University degrees or equivalent);
(4) a very large increase in female participation in the labour force and a growing share of female employment;
(3) an increasing tendency, especially since the early 1960's for jobs to be part-time rather than full-time;
(ó) a significant rise in the proportion of self-employment since the mid-1970's, reversing a previously well established negative trend;
(7) a reduction in the average length of the working year, resulting from both falling average weekly hours and increasing annual holiday entitlements;
(3) the growing importance of shiftworking and changes in associated working patterns, including an increase in unsocial times of work linked with (1) and (7) above;
(10) significant changes in the domesti.) allocation of time with, in particular, a growing degree of self-provision of services while at the same time the proportion oí' women working in the formal economy has increased (see point 4 above).
(11) finally, as a backdrop to all these changes, there has been the apparently inexorable upward trend in unemployment to levels of 3 - 4 million in the early 1900s.
These developments are clearly not unrelated and one objective of this chapter is to explore some of the links between them as well as their underlying determinants. For expository purposes we.prefer to deal with each of these main developments separately, noting, where appropriate, 3ome of the more important inter-relationships. A separate section is therefore devoted to each of the main points. This is followed by a final section which concentrates on the most recent developments and identifies some of the more subtle ways in which work patterns are currently being altered.
2.2 The Changing Industrial Structure of Employment
The industrial structure of employment in the UK has undergone continuous change over the past two hundred years. Even in the relatively short period since the second world war there have been very substantial changes as the data in Table 2.1 illustrate. The share of employment in primary and energy industries has fallen steadily, especially between 1950 and 1970, and by 1985 accounted for just 5 per cent of employment. Manufacturing employment has also fallen since the mid-1950's, declining especially rapidly during the recent recession. It now accounts for less than a quarter of total employment compared with 36 per cent in 1950. This decline was however largely offset, up to the end of the 1970s, by -a growing share of employment in services, particularly those in the public sector. Between 1980 and 1985 the growth in marketed services continued while constraints on public expenditure led lo a decline in public service employment. This broad brush picture tends to conceal even more dramatic changes within the sectors. In manufacturing, for example, the decline in traditional industries such as shipbuilding, and textiles has been to some extent offset by growth in other industries, most notably electrical engineering and especially electronics. In contrast, the substantial growth in hotels and catering within services has been offset to some degree by declining employment in transport and laundries.
The explanations for these developments lie in the impact of technological change upon labour productivity, unit costs and relative prices and the effects of rising real incomes and changing relative prices on the demands for the products of different industries. This includes some significant changes in the pattern of intermediate demands of one industry for another industry's products (or, more especially, services). These phenomenon form one of the main subjects for discussion in Chapter 5. This chapter also presents material on where the most recent changes in employment have been concentrated and speculates about possible future developments.
Table 2.1 Employment by Broad Industry Sector, 1950-85
I I m u ; ; a n d s
S l i d ί e
1 9 5 0 ci f T o t a l I'J 71) EmpI oymen t (19Θ0 Ι9Θ5 % I 1 9 5 0 1 9 7 0 1 9 8 0 L e v e l s 1985
Pr i mó ι y .nul e n e r g y Man u f d c 111 r 111 çj Cons r r u f t i n u Mai h H i e i l s e r v i c e s f' ull I i... s e r v i c e s
1 1 . 1 5 . 1 5 . I
3 5 6 3 5 l I
. 7 , 1 .0
. β
3 4 li 3 6
Ι5 . il
Γ b
b 2U
G •4 l
l U . 3 . 1 . 3 . G
2 3 a 4 5 .
I 9 . 7 l 9 2
2521 7Θ8Θ 14 19 7735 2556
1623 8 5 1 4 1600 8 9 3 7 3B 19
I 340 7079 1609 10314 464 1
12 13 5 6 6 6
1455 IÜ976 4 6 0 0
Who I if e r o r i o m y 100 . 0 IHO. 0 1 0 0 . 0 1 0 0 . 0 22 120 2 4 4 9 3 2 4 9 8 3 2 3 9 1 I
T h o u s a n d s
Net C11 a 11 g e 1 9 5 0 - 7 0 I 9 7 U - 8 0 1 9 8 0 - 8 5
A v e r a g e G i O r t t h \ p . a . 1 9 5 0 - 7 0 1 9 7 0 - 8 0 1 9 8 0 - 8 5
Pi lina I y a n d e n e r g y M a n u f a c t u r i n g C o n s t i n e t 1 ο 11 Mai l i e t e i l s e r v i c e s P u b l i c s e ι v i c e s Who I e e c o n o m y
-8 9 9 6 2 fi 182 I 2 0 ? I 26 2
.•.3 ! 3
2 B 3 - 1 4 3 5
a
1 3 7 8 8 2 2
4 9 0
- 1 2 7 - 14 1 3
- 1 5 3 6 6 2 - 4 0
- 107 1
2 0 0 0 2
2 4 6 7
υ
- 1 . 9 - 1 . 8 0 . 1 1 . 4 2 . 0
- 2 -4 2 1 -0
. 0 . 4 . 0 . 3 . 2
υ . 5 0 . 2 • 0 . 9
carried out by the Institute for Manpower Studies (IMS) for the Occupational Study Group (OSG) based on a survey of employers; a number of special studies of individual industries undertaken by the Science Policy Research Unit (SPRU) as part of their TEMPO project ;^ and finally various more qualitative assessments such as those by Gershuny (1933).
These various projections differ in detail but all tend to emphasise the continuing decline in employment in most manufacturing industries, with continued productivity growth outweighing relatively modest increases in output, the latter reflecting the continuing decline in competitiveness of many UK firms. The main increases in employment are seen as emerging within the service sector as a result of changes in the pattern of final and intermediate demands by consumers and producers. However, technological change in sectors such as banking and finance and the continued switch in consumer demand towards self provision in areas such as transport, mean that this is not a general phenomenon across all service industries.
2.3 Developments in Occupational Structure
These developments in industrial structure 'nave been associated with marked shifts in the occupational distribution of employment. The main features are illustrated in. Tab Le 2.2, which highlights the growth of white-collar jobs, especially of the more skilled kind and the decline of blue-collar work especially for those with few skills or skills tied to industries in decline.
A very significant proportion of the total change can be directly attributed to the altered industrial structure noted above. However, an increasingly important part of the overall change has been due to changes in the occupational structure of employment within industries, 1ER (1986), IMS/OSG (1986) and Gershuny and Miles (1983). These changes are attributable to: technological change; organisational changes, including the increasing tendency to sub-contract many service functions; and finally, changing job demarcations. Some insight into the pattern of occupational employment change within industries is given by Figures .2.1-2.3, which show the main increases and decreases over the periods 1971-1981 and 1981-1984, and the IER's forecasts for
1984-1990. They illustrate how the industrial and occupational structure of
employment have been changing. The dark crosshatched squares indicate cells of the occupation by industry matrix where employment has ^isen rapidly, the more lightly shaded squares indicate corresponding areas of employment decline. A dot in the centre of a square indicates 'chat that occupation accounts for more than 20 per cent of employment in the industry concerned.
Over the period 1971-81 the diagram splits roughly down the mein
diagonal. Those cells below it to the left contain most of thp
significar l. areas of empi r-y¡:¡ent decline. These are principally lower-skilled, white-collar and blue-collar occupations in the non-service sector. In contrast those cells to the top and right contain the main growth areas. These include the highly skilled professional occupations and the service sector. This pattern is repeated if the criteria are changed to absolute changes in employment.
Table 2.2 Employment by Occupation, 197184
T h o u s a n d s
1 9 7 1 1 9 8 1 1 9 8 4
W O C O c c u p â t i o n % o f
t o t a I
1 ¿ .1 h 7 H ;)
I l i
I I
I J
ι :i
I A
I b ι n ! 7 IH' 1 ! 2 0 2 1
M a n a g e r s a n d a d m i n i s t r a t o r s E d u c a t i o n p r o f e s s i o n s H e a l t h , w e l f a r e p r o f e s s i o n s O t o e ι p r o f e s s i o n s
L i t e i a r y . a r t i s t i c , s p o r t s o c c u p a t i o n s E n g i n e e r s , s c i e n t i s t s e t c .
T e c h n i c i a n s , d r a u g h t s m e n Clã·" ¡(.al o c c u p a t i o n s S e c ι i;Ui i a I o c c u p a t i o n s S a l e s r e p r e s e n t a t i v e s (Jtliui s a l e s o c c u p a t i o n s S u p e rv i s o r s
F ureiiien
E n g i n e e r i n g c r a f t o c c u p a t i o n s ( m o d u l e ) E n g i n e e r i n g c r a f t o c c u p a t i o n s ( n o n m o d u l e ) C ο π s t ι υ c t i o n c r a f t o c c u p a t i o n s
U 111 e ι c r a f t o c c u p a t i o n s S k i I led o p e r a t i v e s Otliei o p e r a t i v e s S e c m ity o c c u p a t i o n s
S u i I led p e r s o n a l s e r v i c e o c c u p a t i o n s C) t lier p e r s o n a I sei
O t h e r o c c u p a t i o n s Al I O c c u p a t i o n s
5 7 7 7 8 5 7 5 3 H 3 5 1 5 4 4 5 5 4 2 2 2 7 0 3 8 4 3 4 2 0 1 0 7 5 2 0 6 5 7 6 1 5 0 0
5 14 8 1 7 3 7 6 1 0 0 8 4 9 7 4 2 6 0
2 1 5 0 1 7 6 1 9 8 0 2 4 1 4 6
2 3 3 3 0 1 1 1 1 3 I 4 0 2 6 2 3 1 4 2 0 1 a 7 4 730 956 1048 1 076 197 608 472
2 7 2 3
958 39 1
1 1 2 6
32 1 563 1 350 459 75 1 276 77 1 3999 320 2378 1894 619
% of total
3 .0 4 . 0 4 . 4 4 .5 0 . 8 2 . 5 2. 0 11.4 4.0 1 .6 4 . 7
1 . 3 2.3 5 . 6
1 . 9 3 . 1 1 . 2
3 . 2
16.7 1 . 3 9 . 9 7 .9
2 . 6
% of t o t a I
1 0 0 . 0 2 3 9 8 7 1 0 0 . 0
7 4 1 9 9 I 1 1 4 2 1 1 6 1
2 2 7 6 4 9 5 2 1 2 6 4 3
9 3 4 4 0 5 12 10 3 0 2 4 6 3 1 2 5 4
4 2 2 8 3 2 2 2 3 6 8 7 3 5 7 6
3 0 5 2 4 2 3 19 3 9 6 0 1 2 3 6 5 2
3 4 4 A 1 . 2 . 2 . 1 1 ,
4 . 1 S I 2 5 I 3 O 2 I 5 I I IJ .
H . 2 .
10 0 . 0
Figure 2.1 Changes in Industrial and Occupational Employment, 197181
III
( ) *-> —' τ
o — (
U i D l
Γ — Γ
— ι*
—' II)
0
m l i l
C
Ο ι I
— I
—
ÍD
U )
—' ID
I ) .>
Χ
( I ) t
111 —ι
L"
m I
— 1/1 ( i l
¡il
I . o 1
η
η o
0
- V
£ — ι
1 1 I I (Ι)
^ 1 1
tv
t
I I l i
( l «1
η
o u i
(
il)
■> O
il)
-U a
cri co co
c c c
i 1 õ ° J j e ' ' 3 and a d m i n i s t r a t o r s Fuor at I nr, p r o f e s s i o n s iloa l i ' " . , w e l f a r e p r o f o s s I ons Other p r o f e s s i o n s L ι c erar y, ai ζ ι sc I c, s p o r t s occ.
E n a ' n e e r s , s c ¡ e n t I s t s e t c . Techn! c ι ans, d r a u g h t smen
C l e r i c a l o c c u p a t i o n s ■jee-et ar I a I o c c u p a t i o n s 5 - i l e i ; r e p r e s e n t a t i v e s o i h ur s a l e s o c c u p a t i o n s
Super-ν 1 s o r s ForeTiOr,
iQ 'iciir'" ' i ^ . - ' ' ¿ t t o c c . ' m o d u l e '
ί · e. a " ; ore 'non-niodu le> y i s f u c u o n e r a * t occ. lene'· c'i~a'r occupai ' .ms
S<' I lad operac :JGS Γη tier ope' at I ves
Seco-ι ι y occupations
5k1 liée po'soial service occ.
'Jt;Mi·' po'sor.al su' v u o ote.
Ü t l i o " o c c u p a i ! ¿J'IU
[image:20.842.103.791.62.552.2]Figure_2._2 Changes i n I n d u s t r i a l and O c c u p a t i o n a l Employment, 1981-84
III
( 1
M
)
I I
— ι u>
I I I
*~ — 1
— r
—' .0 o Ο 1') 1 111 1
— 1
en
m
öl
—' 111
( 1
υ Cl' Ι 11 I ra — — j ) ι οί c
— Uî CO ω υ ο L α _w
ο ί ο
-O (.
φ
ι
J *-· I I IB 4 -- ι ί C h ( ι Ι . Ο 11) Cl I I 01 ι ΙΟ > ( Ι m _ ν Ο c
— L ^ en
< —» —
I l
—' II) I .1) Γ —
ΙΛ —' CU
( ι — Ι ΟΙ
J.
—» m
Φ ^> 01 Ι ) 1 ro ι Ο L ΙΛ CO * J CD Ι Ο) 1 CI 1 I ai .*-1 1 o 1 CII CD r
— o I
CI)
—■ * IO Ci
— 1 (0 1 C) CD
Managers and a d m i n i s t r a t o r s Education p r o f e s s i o n s H e a l t h , « e l ' a r e p r o f e s s i o n s Olhe1" p r o f e s s i o n s
L I t e r a r y , a r t ι st l e , sport s occ. Engineers, sc i ent I st s e t c . Techn1 c ι ans, draught smen
C l e r i c a l occupations S e c r e t a r i a l occupations Sales r e p r e s e n t a t i v e s Other sales o c c u p a t i o n s Super ν I sors Foreme". Enq ' nee*" ' nq cr- ait occ. 'module'
Enq. c a f i occ. 'non-module' C o n s t r u c t ' e n c - a f t occ. Oilier c-a'i occupât I ons
Sk ι l led o p e t a t ' v e s Ûthe·- opérât ι »/es Seen'- ' t v occupât ι ons Skl l i e d personal s e r v i c e occ.
Other personal sur-» ice occ. Othe~ occupations
Figure 2.3 Changes in Industrial and Occupational Employment, 1984-90
uaiiagers and adm I ' r Sif acor s Education 3Γο'ίΐΐ s ι oris h e a l t h , w j . ' a r c pi c f,jss I or.s
Ut nar ρι o tess I ans u t e'-;n / , í.rt ' st ' c, 9port s jr.c. Eng meurs, scient 1st s etc.
Tochnlc I ans,draughtsmen
Clerical occupations Socket ar1 al occupations
Sales representatives Other sales ο :τ jpat ι ons
Suoarv ' ?ors
l'c · .,.„cu, i.j ".eci'l'ig i r r t ccc. ''nodule'
t. n.j. c r a f t · " . 'no r..cûu le) I .l'rjtr „ t ι .111 ιa·" orr. Πι ' li.' .".ill ..' 4 M L ' .ill'
bk ' ι iea eoe'a: '■ v o s O t h e r s p e r a i ι S e c u r i t y o c c jpat ions S k i l l e d pe'so.al s e r ^ ' c e o c c . Other personal se' .''ce occ.
St her occupations
Hoy .
in service sector again, especially amongst white collar occupations. The areas of significant decline were, in constant, concentrated in a fairly large quadrant in the bottom left of the figure. These broad trends are confirmed in the IMS/OSG study. Within manufacturing industries in particular there is a clear tendency for increasing shares of employment in skill and knowledge-intensive occupations, despite falling employment levels overall. This has benefitted scientists, engineers and certain multifunctional craftsmen and technicians. Within service industries the occupational change within sectors has been relatively less significant. There has been some growth for the less skilled personal and support occupations.
There are few detailed forecasts available of occupational structure other than those prepared by the 1ER which are summarised in Figure 2.3
(further details may be found in Table 3·3 below) and those in the IMS document referred to in the previous section although authors such as Gershuny (1983) provide seme qualitative predictions. These all suggest: an increasing number of highly skilled non-manual jobs; a slow down, if not a reversal, in the growth of routine clerical work; and, with a few exceptions, a declining number of craft, operative and labouring jobs. The only increases in the 'blue collar/manual' part of the job spectrum are likely to be for certain multiskilled technicians and craftsmen and for security and personal service occupations. The 1ER projections contained in Figure 2.3 suggest a continuation of these developments, with a further concentration of the areas of growth into a few selected industrial sectors such as insurance, banking and finance, professional services and miscellaneous services. Again these areas of increase are expected to especially favour the white-collar occupations.
2.4 Growth of the Proportion of Persons with Formal Qual ..fications
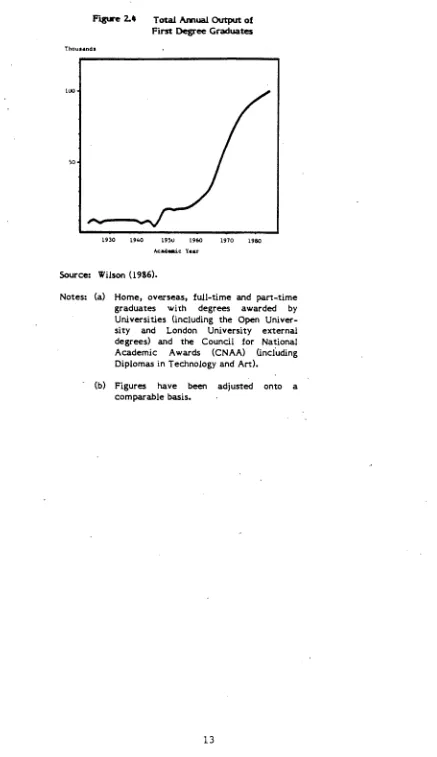
Related to the changing occupational structure of employment has been an increasing proportion of persons holding formal qualifications. This has been reflected bcth in rising standards for entry into many occupations coupled with a growing proportion of young people entering higher and further education in order to meet these entry requirements and to compete in the labour market. One of the most dramatic examples of this phenomenon has been the increase in the number of people entering higher education in the UK since the second world war, mirroring changes in many other countries, (see Figure 2.4) Between
1971 and 1981 the total stock of persons qualified at University degree level or its equivalent increased by over 40 per cent. The proportion of those in employment who were highly qualified rose from just under 9 to just under 13 per cent. This was reflected in an increasing proportion of persons qualified in most occupations as shown in Table 2.3. Regrettably tne Census data for 198I do not distinguish those with lower level qualifications. In Chapter 3 data from the LFS are used to assess more recent developments.
Table 2.3 Changes i n the P r o p o r t i o n of Those Q u a l i f i e d a t Advanced Level 1971-81
T h o u s a n d s
O c c u p â t i o n ( a )
O c c u p â t 1 o n a I E m p l o y m e n t
N u m b e r s Qua l i f i β α
P e r c e n t a g e T o t a l Qua I 1 f l e d C h a n g e
1 9 7 1 19Θ1 1 9 7 1 - 8 1
F a r m a r s , f o r e s t e r s , f i s h e r m e n
M i n e r s a n d q u a r r y m e n
G a s , c o k e a n d c h e m i c a l s mak e r s
G l a s s a n d c e r a m i c s m a k e r s
25 1 . 2
88 .3
5 8 5 . α
I 6 0 . β
Ι 1 β . I
1 2 . 4
0.9
1 . 3
20 . S
2 .S
ι . 9
3 . 5
ι . s
I . 7
2.0
Β . 1
1 . 5
0. 7
F u r η a e θ. F o r g e , f o u n d r y , r o l l i n g m i l l w o r k e r s
E l e c t r i c a l a n a e l e c t r o n i c w o r k e r s
E n g i n e e r i n g a n d a l l i e d t r a d e s
W o o d w o r k e r s
5 8 1 . 3
4 0 4 . 3
1 1 9 . 9
5 8 9 .9
2 3 8 8 . 7
3 7 4 . S
0. 6
9. I
24 .8
2 . 4
0 . 7
1 9 . 7
5 0 . 3
4 .9
0.6
1 .6
0 . 6
1 0 . 6
25 .5
2 . 5
L e a t n e r w o r k e r s
T e « t 1 Ι θ w o r k e r s
C Iotn i n g w o r k e r s
F o o d , d r i n k a n d t o o a c c o w o r k e r s
P a p e r a n d p r i n t i n g w o r k e r s
M a k e r s of o t n e r p r o d u c t s
C o n s t r u c t i o n w o r k e r s
I 0 4 . 9
29 1 . 0
3 6 4 . 2
3 4 7. I
29 4 .5
2 d 4 . 3
6 5 . 3
1 7 0 . 7
2 7 9 . 2
3 0 9 . 6
2 6 8 . 0
2 7 3 .5
6 0 2 .8
0. 5
1 . 8
I . 5
I . 3
1 . 7
l . d
4 . 3 0 1 2 2 3 4 1 0 . 3 . 2 . a . a , 4 3 7
0 . 5
0. 6
0 . 4
0. 4
0. 6
0. 6
u . a
0.5 0 . 1
l . 3
1 . 6
ι . a
ι . 7
2 . b
6 . 4
P d i n t e i s a n d d e c o r a t o r s 0 . A 0 . 2 0 . 6 I . 1
D r i v e r s of s t a t i o n a r y tin < ι I nur> , c r a n u k , ett:.
L a h o u r e r s η . e . c.
I i iii ι spur t a n d
c o m m u n 1 c a t 1 o n s w o r k e r s
W a r e h o u s e m e n , s t o r e k e e p e r s, ρ à ι.kers. D ö t t lers
Cifirical w o r k e r s
S a ' e s w a r k e r s
S e r v i c e , s p o r t a n o r e c r e a t i o n w o r k e r s
A d m i n i s t r a t o r s a n a m a n a g e r s
Pi jfessional , t e c h n i c a l w o r k e r s , a r t i s t s
A r m e d f o r c e s ( B r i t i s h a n n F u r e i g n)
I n a d e q u a t e I / d e s c r i ó l o ui'.uupa t i o n s
1 4 U 0
7 5 4
3 3 5 5
2 I 2 9
2 8 7 9
9 2 5
2 7 2 0
2 3 7
5 7 6 7 7 α 0 6 2 8 4 A
1 2 8 4
7 2 6
3 6 2 0
2 155
3 2 2 7
1 3 4 0
3 4 7 3
2 4 0
8 1 4
a 2 1 , 1 7 3 9 3 5 1 7 3 99 7B J4 20 1
l 5 8 0
l 4 1 7 . 5 . 4 6 . a a . 6 2 5 . 3 18.1
28 . 3
0 4
0.5
2.3
1 . 2
5 . 4
5. 0
9 7 . 2
5 7 . 5
39 . 5
2 1.8
5 8 . 1
6. 1
3 . 0 25 6 l 7 3 . 2 9 6 . S
1 3 6 . 4
5 6 9 . 6
3. 7
1 1 . 1
Λ ι ! o c c u p a t i en s 2 3 9 B 2 5 2 4 5 7 3 . 4 2 1 1 5 . 4 3 1 1 3 . 5
S o u r c e : C e n s u s Of Porjulnt wjn 1971 a n d 1 9 8 1 .
[image:24.595.67.537.68.736.2]Figure 2.* Total Annual Output ol First Degree Graduates
1930 1940 1.950 1960 1970 1980 Academic Year
Source: Wilson (19S6).
Notes: (a) Home, overseas, full-time and part-time graduates with degrees awarded by Universities (including the Open Univer-sity and London UniverUniver-sity external degrees) and the Council for National Academic Awards (CNAA) (including Diplomas in Technology and Art).
Furthermore the relative earnings of those with such qualifications continue to provide a substantial incentive to individuals to make this investment. In addition technological and organisational change have resulted in an ever increasing complexity in economic affairs which have resulted in growing demands for those with scientific, technological, business, language and other skills. There are however some schools of though which hold that education (and training) may not impart new skills but simply serves as a "screening" device to identify those with above average natural abilities. Although there is undoubtedly some truth in this view, there is considerable evidence that higher education does increase individual productivity and that the need for people with such training has genuinely increased. These issues are discussed in Chapter 3·
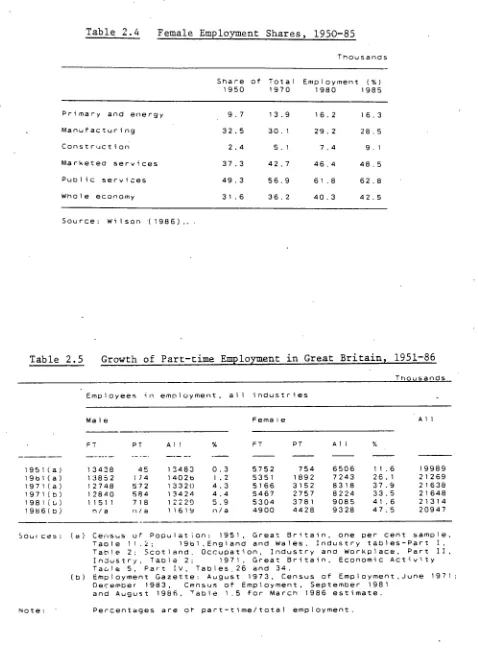
2.5 The Increasing Share of Females in Total Employment
Table 2.4 illustrates the rise in the share of females in total employment. In the past 35 years while male employment has fallen by almost 1.4 million .the number of females has increased by over 3 million. This difference in experience has if anything become even more pronounced in recent years. (Although to some extent these figures give a false impression, since as noted in the next section a large proportion of these jobs are part-time.)
It is clear that this phenomenon reflects both supply and demand factors. On the one hand there has been a steady increase in female participation rates and a growing demand for jobs by, in particular, married females. As noted below this has been facilitated to some extent by technological progress in domestic machinery which has enabled informal domestic work to be undertaken more efficiently. On the other hand changes in industrial structure have resulted in a increasing number of jobs that have traditionally been taken by women (e.g. in education and health services). Moreover within many industries changes in occupational structure (e.g. towards clerical work) and increasing requirements for part-time work (to meet needs for greater flexibility) have resulted in a change in che nature of jobs which has tended to favour women.
There are few forecasts of future changes in the proportion of females in employment. The 1ER (1985) has projected that between 1984 and 1990 the number of females in employment will continue to rise (by some 400 thousand) while male employment falls by over 600 thousand. This growth reflects increasing employment shares across almost every sector but also the continuing movements in industrial structure towards those industries (most notably in the service sector) which have traditionally employed large proportions of women. The IMS/0SG (1986) study predicts a similar trend. According to their analysis over 50 per cent of all jobs could be female by 1990, although a very large proportion of these jobs will be part-time.
2.6 The Increasing Importance of Part-time Work
Table 2.4 Female Employment Shares, 1950-85
Thousands
Share of Total Employment (%) 1950 1970 1980 1985
Primary ana energy
Manufactur i ng
Construction
Marketed services
Pub M c se rv i ces
Whole economy
9.7 13.9
32.5 30 . 1
2.4 5.1
37.3 42.7
49.3 56.9
3 1.6 36.2
16.2 16.3
29.2 28.5
7.4 9.1
46.4 48.5
6 1.8 62.8
40.3 42.5
Source: Wilson (1986)..
Table 2.5 Growth of Part-time Employment in Great Britain, 1951-86
T h o u s a n d s E m p l o y e e s in e m p l o y m e n t , all i n d u s t r i e s
M a 1 e F e m a ι e A l 1
195 1(a) 19b1(a) 197 1(a) 197 1(b) 1981(b) 1986(b)
1 3438 1 3852 1 2748 1 2840 115 11
η / a
PT
45 1 74 572 584 7 18
η / a
A 1 1
1 3483 1402b 13320 1 3424 12229 116 19
0 . 3 I . 2
4. 3 4 . 4 5 .9
η / a
5752 535 1 5 1 66 5467 5304 4900
754 1 892 3 152 2757 378 1 4428
A 1 1
6506 7243 83 18 8224 9085 9328
11.6 19989 26.1 2 1269 37.9 2 1638
33.5 2 1648
4 1.6 21314
47 . 5 20947
Souices: (a) Census of Population: 1951, Great Britain, one per cent sample, Taole 11.2: 19bl,England and W a l e s . Industry tables-Part I, Table 2; Scotland. Occupation, Industry and Workplace, Part II, Industry, Table 2; 1971, Great Britain, Economic Activity Taole 5, Part IV, Tables,26 and 34.
(b) Employment Gazette: August 1973, Census of Employment J u n e 1971 December 1983, Census of Employment, September 1981
and August 1986. Ta b l e 1.5 for March 1986 estimate.
that for males (at around 6 per cent). The phenomenon of the shift towards part-time working has clearly been closely linked with the rising employment share of females.
Information from various sources, such as the Labour Force Survey, New Earnings Survey, General Household Survey and many others, all confirm that the main growth in employment in the UK in recent years has continued to be in the form of part-time jobs, especially for women. The DE's Census of Employment based estimates show that between September 198I, and March 1986, while the number of male employees in Great Britain fell by over 600 thousand and the number of full-time female employees by around 350 thousand, the number of part-time females in employment increased by over 600 thousand. The DE has not published information on part-time males since 198I but analysis of data from the other sources referred to above suggests that a similar pattern has emerged for both sexes. Blanchflower and Elias (1985) suggest that the industrial pattern of part-time employment for men and women are very similar with the great majority being employed outside the manufacturing sector, especially in services.
The reasons for these developments have been vigorously debated in the literature. Some explanations emphasise the demand side and firms' attempts to improve efficiency and flexibility in their operations including the introduction of new shift systems. Others have stressed the supply side pressures for jobs that can be fitted in more easily with child rearing.
There are only a few projections of future trends in part-time working» Those conducted by both the 1ER and the 0SG suggest that the various factors that have resulted in past increases in part-time working are likely to continue to operate in the future. The 1ER for example projects that while the number of full-time employees in employment is likely to decline by over a million between 1984 and 1990 there will be an increase in the number of part-time jobs of about 900 thousand. This growth reflects both increasing shares of part-timers in all industries together with a continued shift in industrial structure towards those service industries which traditionally employ a large proportion of such workers. The IMS/0SG study projects a similar picture, with growth in medium to large sized service organisations being the main influence in increasing the share of part-time jobs to 25 per cent of total employment by 1990.
2.7 The Recent Growth in Self-Employment
Table 2.6 Self-employment as a Percentage of Total Employment, 1950-85
Thousands
Share of Total Employment (%) 1950 1970 1980 1985
Primary and energy
Manufact uri ng
Const ruet i on
Marketed services
Pub lie servi ces
Who 1 e economy
15.3
3.0
11,0
14.6
0. 0
8 . 6
20 .6
1 .7
20 .0
13.6
0.0
8 . 2
19.0 1 .9
22 . 1
12.2
0.0
8 . 0
22. 3
3 .4
34. 2
15.1
0 . 0
11.0
The causes of this recent growth in self-employment are still unclear. It seems likely that a significant part of the increase in certain sectors, such as construction, simply represents a reclassification of persons who were previously employees. Legislative changes, and the desire of employers to avoid certain fixed employment costs have resulted in a move towards sub-contracting in preference to a normal employment contract. Another school of thought regards the growth as a reflection of an outburst of entrepreneurial activity as a result of various policies introduced by the Thatcher Government, (including some explicitly aimed at encouraging self-employment), together with the growth in new opportunities opened up by technological advances, especially in the area of micro-electronics. This type of explanation may be especially important for some manufacturing industries where increases have been very rapid, as well as certain business services.
A related phenomenon has been the apparent growth in the numbers of small firms (defined as those with an annual turnover of £1 million or less in 1981 prices (£250,000 outside manufacturing). Although there are few reliable.data.on this, British Statistics Office data about the number of registered businesses (i.e. registered for VAT purposes), give some idea of the importance of small businesses within the economy. Table 2.7 reveals that of the approximately 1.5 million businesses registered in 1984, 237 thousand (16 per cent) had a turnover less than £17,000 and 735 thousand (50 per cent) had a turnover of less than £50,000 (British Business, December 14, 1984). The distribution was skewed further towards low turnover in the case of sole proprietorships. Despite the likely under-reporting of smaller businesses and the exclusion of those which are VAT exempt, they are, nevertheless, numerically extremely important and particularly in terms of employment because of their relatively high labour intensity.
Government figures on turnover are not reported in constant prices and it is therefore difficult to'make use of the same source for comparative purposes. The general view appears to be that the small firm sector exhibited a secular decline from the late 1930s to the end of the 1960s, but, since then, has shown marked growth (Storey, 1982). Data on registrations and liquidations over the period 1970 to 1980 suggested a 2.31 fold increase in registrations and a 1.88 fold increase in liquidations (Bannock, 1981). This is consistent with a significant growth in the number of small businesses (Cross, 1983» p. 97), which, after a hiccup in 198O, appears to have continued (British Business,
Table 2.7 Businesses by Turnover Size, 1984
Number (percentage) of legal units in 1984 Turnover band (J_ 000 ' s ) in 1982
5000
Trade classification 0-17 18-49 50-99 100-249 250-499 500-999 1000-4999 and over Total
Source: British Business: 14th. December 1984.
Notes: (a) The coverage of this heading is substantially deficient because of Vat exemptions.
Agriculture 50180(31) 49370(30) 31180(19) 23337 (4) 6462 (4) 2147 (1) 961 (1) 88 (-) 163725 M i ri ing and quail ying
and public utilities 396(22) 261(15) 207(12) 297(17) 172(10) 142 (8) 179(10) 125 (7) 1779
Manufacturing industries 20926(14) 38170(25) 24577(16) 28016(18) 14194 (9) 10074 (7) 11496 (7) 4531 (3) 151986
Construction 45992(21) 90038(41) 33213(15) 26698(12) 10651 (5) 5872 (3) 4334 (2) 987 (-) 217785
Transport industries 10352(16) 25551(40) 8749(14) 8303(13) 4351 (7) 2903 (5) 2647 (4) 813 (1) 63669
Wholesaling and dealing 15269(13) 24493(20) 17786(15) 23191(19) 13470(11) 10445 (9) 12318(10) 3492 (3) 120464
Retailing 19197 (7) 89248(34) 74016(28) 57508(22) 13417 (5) 4902 (2) 2608 (1) 718 (-) 120464
Finance, property and
professional services(a) 26089(25) 37839(36) 13490(13·) 13437(13) 5545 (5) 3120 (3) 3056 (3) 1660 (2) 104236
Catering 6077 (5) 45986(38) 40853(34) 22602(19) 3963 (3) 1073 (1) 610 (1) 150 (-) 121374
Motor trades 7815(10) 23259(31) 11664(16) 12866(17) 7244(10) 5421 (7) 5380 (7) 1001 (1) 74650
Business services 140*95(21) 27804(41) 9319(14) 8468(13) 3451 (5) 2157 (3) 1763 (3) 449 (1) 67596
Existing forecasts of the share of self-employment are very limited. The 1ER using simple extrapolative models has suggested that between 1984 and 1990 self-employment is likely to continue to increase by over 300 thousand while the number of employees in employment falls by almost 200 thousand. The IMS/OSG study presents a very similar picture. Their analysis also points to a quite strong employment growth for small businesses (defined by turnover as described above). They suggest that there were probably about 5 million people employed in small firms in 1985. This is forecast to increase by at least 700 thousand jobs by 1990, with corresponding declines for large enterprises. The increase is expected to arise partly as a result of organic growth of new firms, partly due to competition with larger enterprises and partly as a consequence of the increasing degree of out-sourcing by larger companies in manufacturing and the general move towards sub-contracting for many service activities.
2.8 Hours of Work
Over the period since 1850, the long-term trend in average weekly hours has been downward, with few relatively shortlived reversals. Normal hours were close to 60 per week in most sectors in I85O. This had fallen to around 55 per week by I88O in many sectors, with a considerable degree of dispersion, and nearer to 50 by 1900. Further major reductions followed each of the World Wars and, by 1950, normal hours of manual workers were around 44. A further reduction took place in the 1960s, reaching 40 by the next decade. This level was maintained throughout the 1970s and only in the last few years is there evidence of a further downward movement to around 39 or slightly less.
With such major movements in normal hours, average actual hours per week have also tracked downwards, as shown in Table 2.8. Male and female normal hours under collective agreements converged in the early to mid
1970s with the introduction of equal opportunities legislation. While both " male and female average actual hours have decreased over time, female hours have remained below male because of the higher incidence of part-time working amongst women (i.e. in recent years, over 30 per cent for women compared with 6 per cent for men). As the whole frequency distribution of hours of work has shifted downwards, an increasing proportion of employees have moved across the 30 hour boundary which marks the official divide between full-time and part-time employment in
the UK.
Returning to Table 2.8, it can be seen that average actual hours have exceeded normal hours throughout the post-War period, indicating the existence of net overtime working (i.e. overtime exceeding short-time working). In certain years, such as 1969, the difference between average actual and normal hours has been over 4 hours per manual employee in manufacturing. Given that overtime is not worked by all manual workers, those on overtime were clearly working more than four hours of overtime per week.
Table 2.8 Normal and Actual Hours of Work, 1950-85
Year Normal weekly hours Actual weekly hours of manual workers of manual workers
1 9 5 0 1951 1 9 5 2 1 9 5 3 1 9 5 4 1 9 5 5 1 9 5 6 1 9 5 7 1 9 5 8 1 9 5 9 1 9 6 0 1961 1 9 6 2 1 9 6 3 1 9 6 4 1 9 6 5 1 9 6 6 1 9 6 7 1 9 6 8 1 9 6 9 ( a ) 1 9 7 0 197 1 1 9 7 2 1 9 7 3 1 9 7 4 1 9 7 5 1 9 7 6 1 9 7 7 1 9 7 8 1 9 7 9 1 9 8 0 1981 1 9 8 2 1 9 8 3 1 9 8 4 1 9 8 5
M e n 4 4 .4 4 4 .4 4 4 . 4 4 4 . 3 4 4 . 3 4 4 . 3 4 4 . 3 4 4 . 2 4 4 . 2 4 4 . 2 4 3 . 0 4 2 .3 4 2 . 1 4 2 . 0 4 1 . 9 4 1 . 0 4 0 . 3 4 0 . 2 4 0 . 1 4 0 . 1 4 0 . 1 4 0 . 0 4 0 . 0 4 0 . 0 4 0 . 0 4 0 . 0 4 0 . 0 4 0 . 0 4 0 . 0 4 0 . 0 39 .8 39 . 7 39 . 4 3 9 . 2 3 9 . 1 39 . 1
W o m e n 4 4 , 4 4 , 4 4 , 4 4 . 4 4 4 4 4 4 4 4 4 4 4 4 4 3 4 2 4 2 4 2 4 2 4 1 4 0 4 0 4 0 4 0 4 0 4 0 4 0 4 0 4 0 4 0 4 0 4 0 4 0 4 0 38 38 38 38 38 38 5 5 5 5 4 4 4 . 4 . 3 3 , 4 . 3 . 2 . 1 1 , 2 , 5 . 4 . 2 . 1 . 0 . 0 . 0 . 0 . 0 . 0 . 0 . 0 . 0 . 0 . 5 . 4 . 3 . 3 . 1 . 0 Al ' 4 4 . 4 4 4 4 , 4 4 4 4 4 4 4 4 4 4 . 4 4 4 4 4 3 4 2 4 2 4 2 4 2 4 1 4 0 4 0 4 0 4 0 4 0 4 0 4 0 4 0 4 0 4 0 4 0 4 0 4 0 4 0 3 9 3 9 39 3 9 3 9 38. 4 . 4 . 4 4 4 4 3 . 3 . 3 . 2 , 1
Γ'3 ' '
. 1 . 0 . 0 .0 , 3 , 2 . 1 . 1 . 1 . 0 . Q .0 , 0 . 0 . 0 , 0 . 0 , 0 . 6 . 5 . 2 , 0 . 0 , 9
M e n 4 7 . 3 4 7 .9 4 7 . 5 4 7 .9 4 8 . 4 4 8 . 9 4 8 .6 4 8 . 4 4 7 .9 4 8 . 3 4 8 . 0 4 7 . 7 4 7 . 2 4 7 . 8 4 7 . 8 4 7 . 3 4 6 . 2 4 6 . 2 4 6 . 3 4 6 . 5 4 5 . 7 4 4 . 7 4 5 . 0 4 5 . 6 4 5 . 1 4 3 .6 4 4 . 0 4 4 . 2' 4 4 . 2 4 4 . 0 4 3 . 0 4 3 .0 4 2 .9 4 3 . 3 4 3 .4
*
W o m e n 4 1 . 7 4 1 . 6 4 1 . 2 4 1 . 8 4 1.8 4 1 . 7 4 1.3 4 1 . 2 4 1 . 0 4 1.4 4 0 . 7 39 . 8 39 . 5 39 . 7 39 . 7 3 8 .9 3 8 .3 38 . 2 38 . 4 . 3 8 . 1
3 7 .9 3 7 .7 3 7 .9 3 7 . 7 3 7 .4 3 7 .0 3 7 .4 3 7 .4 3 7 .4 3 7 .4 3 7 . 5 37 . 7 38 .0 38 . 2 3 8 . 2
* A 1 4 5 4 6 4 5 4 6 4 6 4 7 4 6 4 6 4 6 4 6 4 6 4 5 4 5 4 5 4 5 4 5 4 4 4 4 4 4 4 4 4 3 4 3 4 3 4 3 4 3 4 2 4 2 4 1 41 41 4 0 4 0 4 0 4 2 4 2 4 2 .
I .9 . 3 .9 . 3 . 7 . 6 . 8 . 6 . 2 . 6 . 2 . 7 . 3 . 8 . 8 . 3 . 3 . 3 , 5 , 6 .9 . 2 . 5 .9 . 4 . 2 . 6 . 4 . 4 2 . 7 . 7 . 8 4 . 5 8
Table 2.9 Overtime and Short-time Working, 1950-85
O v e r t i Y e a r
1 9 5 0 1951 1 9 5 2 1 9 5 3 1 9 5 4 1 9 5 5 1 9 5 6 1 9 5 7 1958 1 9 5 9 1 9 6 0 1961 1 9 6 2 1 9 6 3 1 9 6 4 1 9 6 5 1 9 6 6 1 9 6 7 1 9 6 8 1 9 6 9 1 9 7 0 197 1 1 9 7 2 1 9 7 3 1 9 7 4 1 9 7 5 1 9 7 6 1 9 7 7 1978 19 79 1 9 8 0 198 1 1 9 8 2 1 9 8 3 1 9 8 4 1 9 8 5 S o u r c e
m e
% of al 1 o p e r a t i v e s
n η , 20 2 4 26 27 25 26 23 26 3 0 29 28 29 3 3 3 4 3 3 3 2 3 5 3 5 3 4 29 29 35 , 3 3 . 3 0 . 3 2 . 3 4 . 3 4 . 3 5 . 29 . 2 6 , 29 . 3 1 . 3 4 , 3 4 , : D E
a . a 7 . 0 . 5 . 5 7 , 1 . 1 . 4 . 5 , 1 , 1 , 3 .0 . 6 9 . 4 1 , 7 4 .8 9 0 0 3 2 6 3 0 5 6 8 5 3 9
G a z e t te
A v e r a g e h o u r s / w e e k p e r o p e r a t i v e o n
o v e r t i m e 7 7 7 7
a
8 7 7 7 7 7 7 7 7 8 8a
a
8a
8 8 8 8 8a
a
a
a
a
8 8a
a
a
9 . 3 . 5 . 7 . 8 . 0 . 0 .9 . 8 . 6 . 6 .9 .9 . 8 .9 . 2 .5 . 5 . 4 . 5 . 5 . 5 . 1 , 2 . 5 .4 . 3 4 7 5 , S 3 2 .3 .5 9 0S h o r t - t i m e % of all o p e r a r i v e s
η . a η . a 3 .8
1 .0 0. 7 0 . 8 1 .5 1 . 1 2 .8 1 . 3 1 .0 1 . 2 1 . 7 1 .3 0.4 0 .5 1 . 2 1 .6 0 . 5 0 .5 0 .6 1 . 6 2 . 6 0.4 4.5 3 . 2
1 .6 0 .9 0 . 7 0.9 5.9 7. 8 3 . 5 2 .0 1 .5 0 . 7
A v e r a g e h o u r s / w e e k p e r o p e r a t i v e o n
overtime were over 8 per week for much of the post-war period and, if anything, increased over the period as a whole.
Interestingly, at the same time, there have been marked movements in hours lost through short-time working. As firms move back into equilibrium or are removed through bankruptcy and liquidation, we would expect the incidence of short time to fall to zero, although in each period there will clearly be some firms in disequilibrium. The incidence of short-time certainly returns to very low levels in some years, such as 1968 and 1973. The average number of hours lost through short time per operative on short time has varied considerably, although generally maintaining a level of over 10 hours per week.
A further dimension of hours concerns the annual work period and, therefore, holiday entitlements. Table 2.10 shows the trends over the post-war period. The whole distribution of holiday entitlements has shifted rightwards and this has caused the average length of holiday to rise from 1.7 weeks per year in 1951 to 4.6 weeks per year in 1985, a 2.7 fold increase over the period as a whole. The period from 1978 to 1983 showed an increase of a whole week, with most of that change occurring in 1979 and 198O. Additional holidays for long service and the like are also received by a minority of the workforce. This percentage has fluctuated over the period as a whole. The low of 12 per cent in 1972 was followed by rapid growth to 40 per cent in 1980, since when it has fallen back again. However, extra service entitlements per employee are generally quite low, and the general picture of a steady growth in holidays is not markedly affected by the fluctuations in this variable.
2.9 Shiftwork and Unsocial Times of Work
Shiftwork and unsocial times of work have been the subject of considerable debate both in the UK and, more widely throughout Europe, during the post-War period. More intensive shiftwork has often been seen as a means of increasing employment opportunities in less developed economies with under-utilised labour and capital, capital shortages at current utilisation levels and foreign reserve problems. However, shiftwork is also recognised to incur potential physiological and social costs. Encouragement to increase shiftworking, where it has occurred at all (i.e. by the ILO in less developed countries), has often been limited to the socially more acceptable double day, two shift system.
Table 2.10 Basic Holiday Entitlements, 195185
195 1 195G I 9 6 0 1 9 6 2 1 9 6 3 1 9 6 4 1 9 6 5 I 9 6 0 1 9 6 7 Ι96Η 1 9 6 9
ι a 7û
197 1 1 9 7 2 1 9 7 3 1 9 7 4 1 9 7 5 1 9 7 6 1 9 7 7 1978 1 9 7 9 1 9 8 0 198 I 1 9 8 2 198 3 1 9 8 4 1 9 8 5
Percentage of manual workers who have a basic holiday with pay of;
1 2
2 Η
2 w e e k s
6 6 9 6 97 9 7 9 7 9 2 75 63 6 0 5 6 5 0 41 28 a 6 1 1
23 w e e k s 3 w e e k s
2 2 1 2 2 7 2 2 33 34 34 3 5 7 5 16 9 1 1 2 1 1 1 3 4 6 10 14 49 63 39 36 30 1 7 18 18 1 7 7 2 2
34 weeks 4 weeks
ι 3 4 33 45 40 5 1 47 47 47 42 2 4 1 1 5 5 5 1
45 weeks *eeks 8. over
4 2 8 3 0 34 34 35 5 0 19 25 21 17 15 16 5 5 ei 5 3 6 0 61 6 3 1 19 18 19 20
Source: D E , British Labour Statistics Yearbook and Gazette
Note: (a) Decline caused by alteration in Wages Council Orders
per cent
Percentage with extra servi ce Average entitlement
1 . 7 2.0 2 . 0 2.0 2.0 2 . 1
2 . 7
3 .0 3 . 2
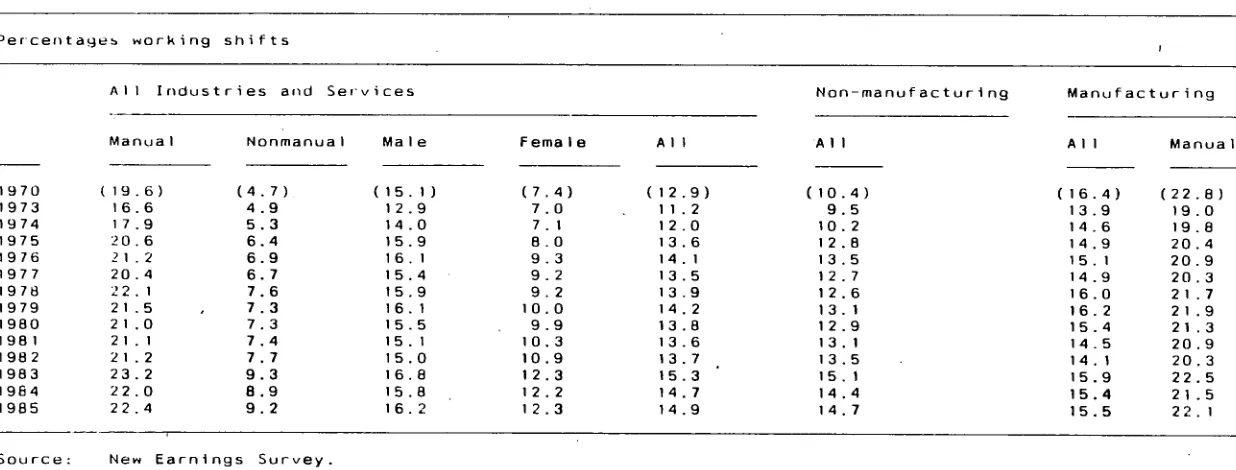
Table 2.11 Trends in the Incidence of Shiftworking, 1970-85
Percentages working shifts
All Industries and Sei'vices
1970 1973 1974 1975 1976 1977 1978 1979 1980 198 1 1982 1983 1984 1985 Manua I ( 19.6) I 6 1 7 20 2 I 20 2 2 2 1 2 1 2 1 2 1.2 23 . 2
22.0 22 .4
NonmanuaI Ma I e
(4.7) 4 .9 5 . 3
(15.1) 12.9 14.0 15.9 16.1 15.4 15.9 16.1 15.5 15.1 15.0 16.8 15.8 16.2 Fema1 e (7.4) 7 7 θ 9 9 9 10 9 10 10 1 2 1 2 1 2 .0 1 0 . 3 2 2 0 .9 . 3 .9 . 3 . 2 . 3
A I I
(12.9) 11.2 12.0 13.6 14.1 13.5 13.9 14.2 13.8 13.6 13.7 15.3 14.7 14.9 Non-manufacturing Manufacturing
A I I
(10. 9 . 10. 1 2 1 3 1 2 1 2 13 1 2 1 3 13 1 5 14 14 4) 5 2 8 5 7 6 1 9 . 1 . 5 1 .4 . 7 A 1 ( 16. 13. 1 4 1 4 . 1 5 1 4 16 16 15 14 14 15 15 15 1 4) 9 6 9 1 9 ,0 . 2 . 4 . 5 . 1 . 9 .4 . 5 Manua 1 (22.8) 19.0 19.8 20 . 4 20 . 9 20 . 3 21.7 21.9 21.3 20 . 9 20. 3 22 . 5 21.5 22. 1
Source: New Earnings Survey.
[image:37.842.107.725.98.333.2]different basis, but, taken at face value, they indicate that shiftwork may well have continued along an upward trend until the late 1960s or early 1970s, although at a slower pace than the 1954 to 1964 period). Since 1970, however, the trend has been roughly level, with the decline in shiftwork during the early 1970s broadly matched by a recovery during the early 1980s in manufacturing. Elsewhere there has been a rising trend however, and the overall incidence for all industries and services has risen from 11 per cent in 1973 to 15 percent by 1985. This growth has been especially pronounced for females and for non-manual workers.
The NES data highlight a number of other important features of shiftworking in the UK. Not least of these are the important differences in the incidence of shiftworking between manufacturing and non-manufacturing, manuals and non-manuals, and males and females at the beginning of the period, around 1973· However, while there are still some differences, by the end of the period they are much smaller in magnitude. Finally, taken individually, some of these series, such as those for non-manuals, show quite rapid rates of increase in the incidence of shiftworking. These changes provide important clues about the reasons for the overall pattern of shiftworking in the UK and we return to this topic in Chapter 4.
This overall picture conceals changes in the relative importance of the different types of shift system. Comparisons of the 1964 (Ministry of Labour, 1965). with the results available for 1978 (IFF, 1978) and 198O (WIRS, 198O) Surveys indicate the growth of double day working within the total. Double day is the most social of the various systems in terms of the timing of work, measured simply against the deviation from the normal 9-00 am to 5.00 pm, Monday to Friday period. On the other hand, this type of system does involve an early start to the day on the morning shift, as well as working during the peak social period of the evening (see Table 2.12 below). Both of the3e have comparatively high, if short-lived social costs (Bosworth and Dawkins, I98O). Two other types of comparatively unsocial systems, three shift working and permanent nights, showed only minor declines. Three shift working maintained its overall ranking as the most important type of shift operation. Permanent nights came close to maintaining its comparative importance, although it was less common than double days or three shift working„
Table 2.12 Time Spent on Main Activities by Employment Groups, 1974
H o u r s per week (Winter and Summer c o m b i n e d )
Work The rest
Personal i n c l u d i n g D o m e s t i c mainly
Sleep c a r e / M e a l s t r a v e l l i n g work free time Total
M a l e s e m p l o y e d f u l l t i m e 56.3 16.5 4 4 . 5 ( a ) 8.4 4 1 . 4 168 0
F e m a l e s e m p l o y e d f u l l t i m e 57.5 18.1 3 8 . 4 ( a ) 17.4 35*6 168 0
F e m a l e s e m p l o y e d p a r t t i m e 56.9 18.0 1 9 . 5 ( a ) 32.4 39 8' 168 0
H o u s e w i v e s 5 9 . 2 18.3 0.6 41.9 46^1 168 0
S o u r c e : B B C ( 1 9 7 B ) , ρ 656
N o t e : (a) T h e s e accord fairly well with D e p a r t m e n t of E m p l o y m e n t f i g u r e s of the a v e r a g e w o r k i n g week in A p r i l , 1 9 7 5 , v i z . m a l e s f u l l t i m e , 43 h o u r s : f e m a l e s
¡^ f u l l t i m e , 4 1 . 4 h o u r s ; f e m a l e s p a r t t i m e , 21.4 h o u r s . T h e s e did not I n c l u d e
[image:39.842.86.718.66.537.2]The evidence of both the shiftwork and the allocation of time data indicate important changes in the timing of work. The slower growth of shiftwork appears to have been accompanied by a growth in other forms of unsocial time of work arrangements, particularly amongst part-time workers, that have tended to re-schedule work, particularly during the weekday evening and weekend periods.
2.10 Magnitude of the Informal Economy
In this section we briefly review evidence regarding the size of the" informal economy. As the discussion in Chapter 4 makes clear, there are many different aspects to the informal economy ranging from criminal activities, through the so called "black economy" to domestic work. Handy (1984) distinguishes three main components: first, the "black" or underground economy which consists essentially of illicit or illegal activities carried out in such a manner as to avoid tax. In the extreme this can include outright criminal acts; second, the so called "grey" economy which consists of domestic and voluntary work undertaken without payment; and third, the "mauve" economy which is defined to include all those activities on the fringe of the economy which fall outside the net of the- official statisticians' measures of production, (for example, "kissagrams").
These different elements are often very difficult to measure. Nevertheless the general feeling seems to be that the.importance of the informal, relative to the formal economy has been increasing. One set of indicators which are at least suggestive are the trends in employment and unemployment referred to elsewhere in this chapter. In particular, we can point to the rapid growth in unemployment over the last fifteen years, which, if anything, is an underestimate of the true growth because of the rise in discouraged workers (see Section .2.11 and Bosworth and Westaway, 1986). In addition, there are the recent significant upward trends in part-time employment, self-employment and the growth in small businesses, as well as the rising proportion of females in total employment in the formal economy. Of these trends, only the growth of female employment in the formal workforce appears likely to have slowed the growth of the informal sector, (in the sense of reducing the amount of time spent on domestic work). On the other hand, part-time workers (most of whom are female), the self-employed and small businesses may often operate at the fringes of the formal economy, with a significant part of their activities actually falling outside its bounds, while the growth of unemployment will have forced many individuals to operate outside the formal economy. Coupled with these changes are the long-term reductions in lifetime working hours (in the formal economy) which means that individuals have much more time to devote to activities in the informal economy as well as to leisure.
More direct measures of the informell economy are notoriously problematic. Some of the main difficulties are discussed in Chapter 4. At one end of the spectrum there are obvious practical difficulties in measuring the volume and value of criminal activities. At the other end of the spectrum there are serious theoretical problems in attempting to measure the value of domestic work done outside the formal economy (Gershuny, 1983). In between these extremes there are problems of both kinds in attempting to measure the level of activity in the "underground" economy. These activities can range from the illicit
businesses and self-employed persons to the perfectly legal but unmeasured activities of those involved in voluntary work or informal bartering arrangements.
Because of the nature of the black economy, it is very difficult to be precise about its size. On the other hand, the growing body of somewhat qualitative evidence suggests that it is not particularly large in the UK compared with a number of other European economies, such as Belgium and Italy. (Heertje, et al., 1982, p. 108). In the early 1980s, the" general view appeared to be that the black economy accounted for about 7_ per cent of GNP (Smithies, 1984, p. 3 and Shankland and Turner, 1984, p. 120). It should be added, however, that there are considerable variations in the available estimates, some much lower (Macafee, 1980)
and others considerably higher (Fiege, 1981).
The differences in the estimates of the black economy amongst various subgroups of the population are a general feature across a number of studies (Macafee, 198O, 0'Higgins, 198O). In particular, it is the group receiving income from self-employment that is by far the most important with regard to the black economy. Estimates for 1978 suggest a ratio of income from the black economy to declared income of over 20 per cent on certain fairly reasonable assumptions for this group.
The long-term trends are even more difficult to establish. Taking a fairly limited focus, drawing particularly on evidence concerning crimes and associated prosecutions, Smithies (1984) examines the evolution of the black ' economy in five UK towns over the period from 1914. Several interesting features emerge. First, that the black economy has varied in importance over time, associated with particular stimuli, such as wartime shortages and associated controls on the operation of markets. Second," that, at least in the towns surveyed, the black economy was invariably small scale. Finally, that there is some evidence to support the hypothesis of a growth in the black economy in the recent post-war period. Macafee (1980) argues that there has been slow growth over the last 20 years, although his figures indicate a small fall between 1975 and 1978. The O'Higgins (1980) results, however, were consistent with continued growth over the period 1972 to 1978. Fiege (198I) suggested a much more rapid growth than Macafee over the period 1960 to 1979, but also reported a decline in the black economy as a percentage of GNP after 1974.
Small businesses and self-employment (which merge at the extreme), form a further potentially important element of the informal economy (see the discussion in the previous sections). We do not have direct information about the informal activities of these groups. Shankland and Turner
(1984, p. 119), suggest that as much as 50 per cent of their time may be allocated to the informal sector.. It is interesting to note that the strong upward movement in self-employment in recent years is only partially captured in the company registration and turnover statistics discussed above.
2.11 Allocation of Time
minimised, subject to obtaining a certain level of income. This model regards work or labour as an activity that is solely conducted with a view to obtaining income. In its traditional form it excludes from consideration domestic work or any other work that is not paid for. Nor does it consider that work may itself provide the worker with utility. The problem of defining work precisely, and distinguishing it from leisure and domestic work, is a very thorny one which could itself fill a large volume. We provide a brief overview of this in Chapter 4 below.
Leisure has also been the subject of investigation by economists in its own right in attempts to measure aggregate welfare. This is on the grounds that it is an important component of individuals' utility but does not appear in measures of national income. Research by Beckerman (1978) has shown just how important leisure might be in adjusting the income measures in some countries. However, he suggests, for the UK, that leisure per active person increased only marginally over the period 1950/2 to 1971/3 (6 per cent for males and just over 3 per cent for females) and leisure per total population aged 15 and over was static, while the average level per' head of total population of all ages fell slightly. Here leisure is defined very broadly as all time other than that spent in formal work. Apparent contradictions between these trends in leisure time and those for hours of work are in part due to compositional effects