International Journal of Innovative Technology and Exploring Engineering (IJITEE) ISSN: 2278-3075, Volume-8 Issue-7, May, 2019
Abstract: In an internal combustion engine, chemical reactions occur between oxygen present in air and hydrocarbon fuel. Engine works on stoichiometric air/fuel ratio when there is the correct ratio of air such that there is no excess oxygen left after combustion but in reality, the combustion process is not perfect which leads to emission of several types of pollutants. Therefore, it is important to study and gain knowledge about how much pollution is caused by these engines so that we can develop new methods for building a better environmentally friendly engine. Although, there are many other factors which cause pollution like factories, burning crackers, burning of waste material, emission of pollutants from automobiles etc yet our main focus is on pollution from cars because of the following reason-
The number of cars on roads is increasing day by day. Earlier travelling by car was considered a luxury but now it’s a necessity as they are convenient to use, reduce travelling time and are comfortable. This is one of the reasons why the number of privately-owned cars has significantly increased. The price of a car is not very high these days and can easily be afforded by a man belonging to a middle-class family. Due to drastic increase in the number of cars not only our fuel
like petrol and diesel is being used in excess which has led to depletion of these resources but also utilisation of these fuels has led to emission of pollutants like carbon monoxide, carbon dioxide, smoke excess.
Level of these pollutants specially carbon dioxide CO2 and CO has increased so much that it is unsafe in many metropolitan cities to even breathe. CO2 in such dangerous amount can cause problems like asthma and other lung related problems.
This paper, aims at measuring the factors related to a car that lead to main cause of pollution. Several cars running in Vellore Institute of technology, Vellore were selected for predicting the same.
I. INTRODUCTION
Cars play a major role in air pollution. This paper aims to highlight the major factors in cars that are responsible for air pollution. We have considered factors like ignition value, acceleration value, torque, distance, mileage and CO2
produced by cars, these attributes have been grouped together to identify whether the given car is producing pollution in excess as compared to other cars. The ignition and acceleration value is the concentration of gas in a particular amount of air. We have used MQ9 sensor which detects the concentration of carbon monoxide.
Revised Manuscript Received on May 06, 2019
Name : vishal yadav, University : VIT, Branch : Information technology
Name : divyansh khatana, University : VIT, Branch : Information technology
Name : meghna bajoria, University : VIT, Branch : : Information technology
The Rs/R0 ratio which we have calculated using the sensor
along with Arduino is 9.8 in clean air. On this basis we can decide if the amount of CO emitted from the car is in excess or not. As RS/RO is directly proportional to COemitted
therefore lower the ratio, lower the CO produced and better it is for the environment.
The CO2 produced depends on the mileage of the car.
Approximately 2.62 Kg and 2.39Kg of carbon dioxide is produced by burning 1 litre of diesel and petrol respectively. Old cars may produce less carbon dioxide due to unburnt fuel present. We have recorded amount of CO2 from cars based on
their mileage. Other factors like max power, fuel type, cc engine, torque also play a role in carbon emission detection.
II. BACKGROUND
We used Arduino to measure the concentration of gas emitted from vehicles at the time of ignition and acceleration using MQ9 gas sensor. MQ9 gas sensor is used to detect concentration of carbon monoxide present. Using Arduino, we get the following dataset
III. ALGORITHM USED
In the given dataset above, we observe that we have certain strings values so we have to consider an algorithm which will provide accuracy. Hence, we use fuzzy logic i.e. grey analysis to analyse the dataset and give prediction based on the results.
Ignition Pollution Check
IV. PURPOSE
Since this paper tells us the factors which are most important when considering CO2and CO emission, it can help the
government to set a limitation on the number of such cars to be allowed on road, or set a target for car manufacturing companies so that they can take care of these factors and reduce CO2 emission. To implement this, we have to consider
the given data set and make a decision based on the ranks calculated. This analysis gives us ranks based on ignition value and CO2 produced. Lower the rank, lower the pollution
and hence better the car.
V. METHODOLOGY
This research applies grey relation analysis to find the best car i.e. the car which produces least amount of ignition value and hence causes the least pollution. The attributes are first selected, converted into quantitative values using fuzzy conversion scale. The data obtained is then pre-processed to obtain normalized values. According to these sequences a reference sequence is then defined. Then, the grey relation coefficient between all comparability sequence and the reference sequence is calculated. Finally based on these grey relation coefficients the grey relation grade between the reference sequence and every comparability sequence is calculated. If a comparability sequence translated from an alternative has the highest grey relation grade between the reference sequence and itself, then that alternative will be the best choice. Fuzzy logic is used here to convert linguistic data into crisp score.
VI. DATA VISUALIZATION
The data has been visualized on the basis of car number as very car has a unique number. Each car number is categorized into different colours. Each colour represents a car which also represents that car in graph of each attribute.
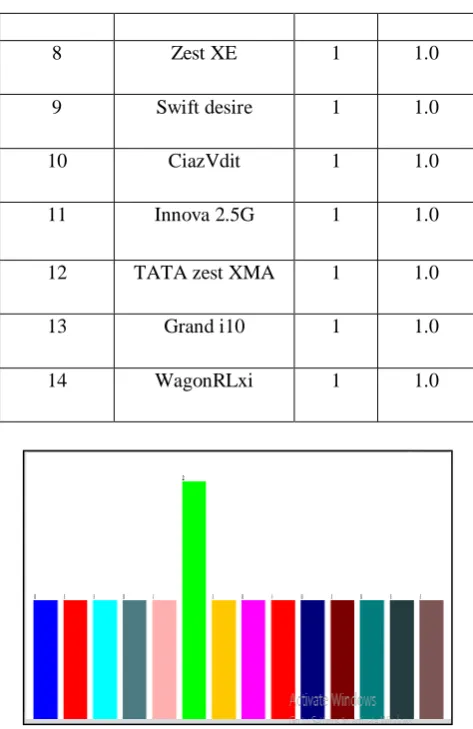
1) Selected attributes
Name: car name Type: Normal Missing: 0(0%) Distinct: 14 Unique: 13 (87%)
No Label Count Weight
1 Nissan sunny XL 1 1.0
2 Etios Toyota GD 1 1.0
3 Ertika Hybrid 1 1.0
4 Tiago XM Tata 1 1.0
5 Volks wagon Polo 1 1.0
6 Ford Figo TDCI 2 2.0
7 Alto 800 1 1.0
8 Zest XE 1 1.0
9 Swift desire 1 1.0
10 CiazVdit 1 1.0
11 Innova 2.5G 1 1.0
12 TATA zest XMA 1 1.0
13 Grand i10 1 1.0
[image:2.595.308.545.44.409.2]14 WagonRLxi 1 1.0
Figure 1: Data visualization with respect to car name
2) Selected attributes
Name: Year Type: Numeric Missing: 0(0%) Distinct: 8 Unique: 3 (20%)
Statistic Value
Minimum 2011
Maximum 2019
Mean 2014.733
StdDev 2.764
Figure 2: Data visualization with respect to year of purchase
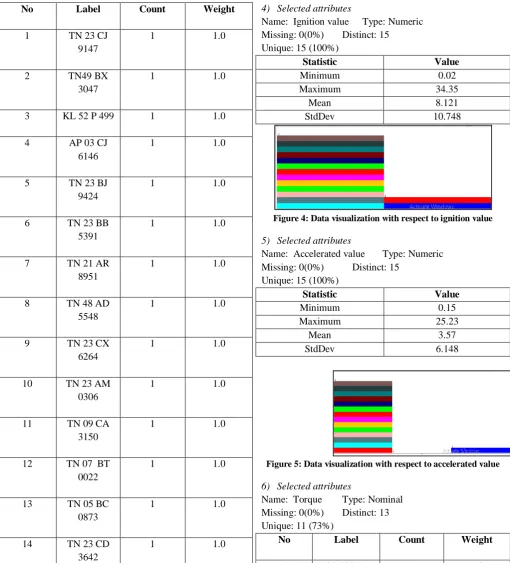
3) Selected attributes
International Journal of Innovative Technology and Exploring Engineering (IJITEE) ISSN: 2278-3075, Volume-8 Issue-7, May, 2019
No Label Count Weight
1 TN 23 CJ
9147
1 1.0
2 TN49 BX
3047
1 1.0
3 KL 52 P 499 1 1.0
4 AP 03 CJ
6146
1 1.0
5 TN 23 BJ
9424
1 1.0
6 TN 23 BB
5391
1 1.0
7 TN 21 AR
8951
1 1.0
8 TN 48 AD
5548
1 1.0
9 TN 23 CX
6264
1 1.0
10 TN 23 AM
0306
1 1.0
11 TN 09 CA
3150
1 1.0
12 TN 07 BT
0022
1 1.0
13 TN 05 BC
0873
1 1.0
14 TN 23 CD
3642
1 1.0
15 TN 23 AM
5402
1 1.0
Figure 3: Data visualization with respect to car number
4) Selected attributes
Name: Ignition value Type: Numeric Missing: 0(0%) Distinct: 15
Unique: 15 (100%)
Statistic Value
Minimum 0.02
Maximum 34.35
Mean 8.121
StdDev 10.748
Figure 4: Data visualization with respect to ignition value
5) Selected attributes
Name: Accelerated value Type: Numeric Missing: 0(0%) Distinct: 15
Unique: 15 (100%)
Statistic Value
Minimum 0.15
Maximum 25.23
Mean 3.57
[image:3.595.43.554.48.612.2]StdDev 6.148
Figure 5: Data visualization with respect to accelerated value
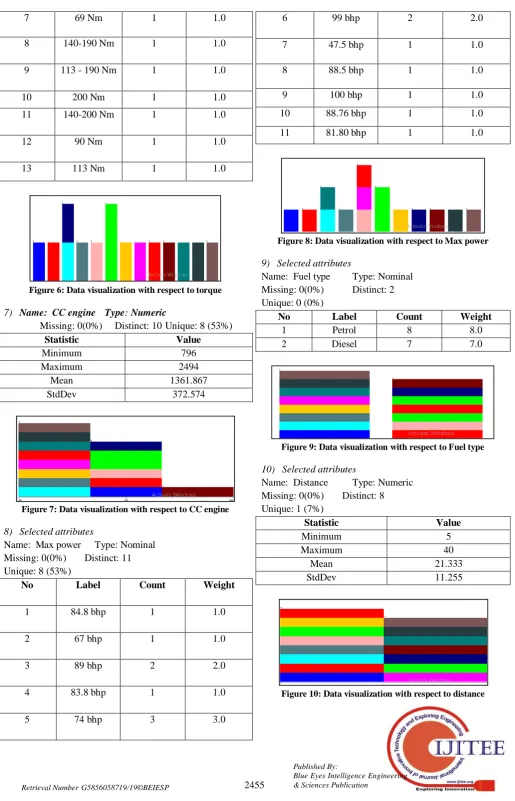
6) Selected attributes
Name: Torque Type: Nominal Missing: 0(0%) Distinct: 13 Unique: 11 (73%)
No Label Count Weight
1 134-200 Nm 1 1.0
2 179 Nm 1 1.0
3 200 Nm 2 2.0
4 114 - 140 Nm 1 1.0
5 95- 250 Nm 1 1.0
7 69 Nm 1 1.0
8 140-190 Nm 1 1.0
9 113 - 190 Nm 1 1.0
10 200 Nm 1 1.0
11 140-200 Nm 1 1.0
12 90 Nm 1 1.0
13 113 Nm 1 1.0
Figure 6: Data visualization with respect to torque
7) Name: CC engine Type: Numeric
Missing: 0(0%) Distinct: 10 Unique: 8 (53%)
Statistic Value
Minimum 796
Maximum 2494
Mean 1361.867
[image:4.595.43.559.39.842.2]StdDev 372.574
Figure 7: Data visualization with respect to CC engine
8) Selected attributes
Name: Max power Type: Nominal Missing: 0(0%) Distinct: 11 Unique: 8 (53%)
No Label Count Weight
1 84.8 bhp 1 1.0
2 67 bhp 1 1.0
3 89 bhp 2 2.0
4 83.8 bhp 1 1.0
5 74 bhp 3 3.0
6 99 bhp 2 2.0
7 47.5 bhp 1 1.0
8 88.5 bhp 1 1.0
9 100 bhp 1 1.0
10 88.76 bhp 1 1.0
11 81.80 bhp 1 1.0
Figure 8: Data visualization with respect to Max power
9) Selected attributes
Name: Fuel type Type: Nominal Missing: 0(0%) Distinct: 2 Unique: 0 (0%)
No Label Count Weight
1 Petrol 8 8.0
2 Diesel 7 7.0
Figure 9: Data visualization with respect to Fuel type
10) Selected attributes
Name: Distance Type: Numeric Missing: 0(0%) Distinct: 8 Unique: 1 (7%)
Statistic Value
Minimum 5
Maximum 40
Mean 21.333
StdDev 11.255
[image:4.595.38.558.46.326.2]International Journal of Innovative Technology and Exploring Engineering (IJITEE) ISSN: 2278-3075, Volume-8 Issue-7, May, 2019
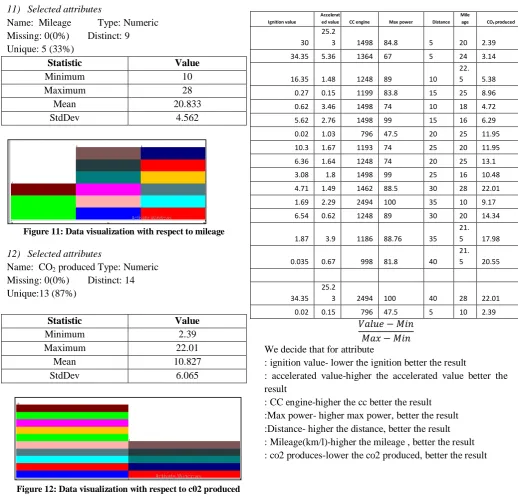
11) Selected attributes
Name: Mileage Type: Numeric Missing: 0(0%) Distinct: 9 Unique: 5 (33%)
Statistic Value
Minimum 10
Maximum 28
Mean 20.833
StdDev 4.562
Figure 11: Data visualization with respect to mileage
12) Selected attributes
Name: CO2 produced Type: Numeric
Missing: 0(0%) Distinct: 14 Unique:13 (87%)
Statistic Value
Minimum 2.39
Maximum 22.01
Mean 10.827
[image:5.595.40.559.47.543.2]StdDev 6.065
Figure 12: Data visualization with respect to c02 produced
VII. PRACTICAL IMPLEMENTATION
Step 1: We first find the maximum and minimum of each attribute using MAX formula and Min formula. Example: To calculate the maximum of ignition values we use the formula
and to calculate minimum for the same
attribute we use the formula The result for all the attributes is shown in the table below.
Step 2: Now, we decide whether we should take the minimum value or the maximum value of each attribute value. If we take the maximum value the formula is
And the formula for the minimum value is
We decide that for attribute
: ignition value- lower the ignition better the result
: accelerated value-higher the accelerated value better the result
: CC engine-higher the cc better the result :Max power- higher max power, better the result :Distance- higher the distance, better the result : Mileage(km/l)-higher the mileage , better the result : co2 produces-lower the co2 produced, better the result
Ignition value
Accelerat
ed value CC engine Max power Distance
Mile
age CO2 produced
30 25.2
3 1498 84.8 5 20 2.39
34.35 5.36 1364 67 5 24 3.14
16.35 1.48 1248 89 10 22. 5 5.38
0.27 0.15 1199 83.8 15 25 8.96 0.62 3.46 1498 74 10 18 4.72
5.62 2.76 1498 99 15 16 6.29 0.02 1.03 796 47.5 20 25 11.95
10.3 1.67 1193 74 25 20 11.95 6.36 1.64 1248 74 20 25 13.1
3.08 1.8 1498 99 25 16 10.48
4.71 1.49 1462 88.5 30 28 22.01 1.69 2.29 2494 100 35 10 9.17
6.54 0.62 1248 89 30 20 14.34
1.87 3.9 1186 88.76 35 21. 5 17.98
0.035 0.67 998 81.8 40 21. 5 20.55
34.35 25.2
3 2494 100 40 28 22.01
The table for the scenario is shown below
Ignition value
Accelerated value
CC engine
Max power
distance Milage(km/l) Co2
produced
0.126711 1 0.413428 0.710476 0 0.555556 1 0 0.207735 0.334511 0.371429 0 0.777778 0.961774 0.524323 0.05303 0.266196 0.790476 0.142857 0.694444 0.847604 0.992718 0 0.237338 0.691429 0.285714 0.833333 0.665138 0.982523 0.131978 0.413428 0.504762 0.142857 0.444444 0.881244 0.836877 0.104067 0.413428 0.980952 0.285714 0.333333 0.801223 1 0.035088 0 0 0.428571 0.833333 0.512742 0.700553 0.060606 0.233804 0.504762 0.571429 0.555556 0.512742 0.815322 0.05941 0.266196 0.504762 0.428571 0.833333 0.454128 0.910865 0.065789 0.413428 0.980952 0.571429 0.333333 0.587666 0.863385 0.053429 0.392226 0.780952 0.714286 1 0 0.951355 0.085327 1 1 0.857143 0 0.654434 0.810079 0.01874 0.266196 0.790476 0.714286 0.555556 0.390928 0.946111 0.149522 0.229682 0.785905 0.857143 0.638889 0.205403
0.999563 0.020734 0.118963 0.653333 1 0.638889 0.074414
1 1 1 1 1 1 1
0 0 0 0 0 0 0
0.36409 1 0.460163 0.633293 0.333333 0.529412 1 0.617184 2
0.333333 0.386918 0.429005 0.443038 0.333333 0.692308 0.928977 0.506702 13
0.512465 0.34555 0.405251 0.704698 0.368421 0.62069 0.766406 0.531926 11
0.985645 0.333333 0.395989 0.618375 0.411765 0.75 0.598901 0.584858 6
0.966226 0.365491 0.460163 0.502392 0.368421 0.473684 0.808072 0.563493 7
0.754008 0.358183 0.460163 0.963303 0.411765 0.428571 0.715536 0.584504 6
1 0.341317 0.333333 0.333333 0.466667 0.75 0.506453 0.533015 7
0.625433 0.347368 0.394884 0.502392 0.538462 0.529412 0.506453 0.492058 8
0.73027 0.34708 0.405251 0.502392 0.466667 0.75 0.47807 0.525676 7
0.848702 0.348624 0.460163 0.963303 0.538462 0.428571 0.548045 0.590838 4
0.785404 0.345645 0.451356 0.695364 0.636364 1 0.333333 0.606781 2
0.911335 0.353439 1 1 0.777778 0.333333 0.59132 0.709601 1
0.72472 0.33755 0.405251 0.704698 0.636364 0.529412 0.450827 0.54126 3
0.902708 0.370239 0.393602 0.700187 0.777778 0.580645 0.38622 0.58734 2
0.999127 0.338005 0.362047 0.590551 1 0.580645 0.350733 0.603015 1
This table is known as normalized matrix. The value of ∆MAX=1 and ∆MIN=1 always
Step 3: We calculate the deviation sequence in step 3 using the below formulas
And to calculate the maximum and minimum of each attribute. The maximum value will always be 1 and the minimum value will always be 0.
Step 4: This is the final table showing grey relation coefficient. Let θ=0.5 then we use the formula
The grey relation coefficient can be calculated as
ζ
j(k)=
ζ ζ
Now, we find the rank on the basis if which we deicide the car which produces the least CO2, whenever the new data comes it is classififed under these ranks and decision is taken that it is harmful or not.
VIII. RESULT
Following all the above steps, we get the rank of each car. The lowest rank represents the car.
International Journal of Innovative Technology and Exploring Engineering (IJITEE) ISSN: 2278-3075, Volume-8 Issue-7, May, 2019
IX. WHY GREY RELATION?
In our dataset decision tree cannot be applied because we cannot choose any root node as all our attributes are different from each other.
Also random forest cannot be used because the error is high, which is calculated using weka.
But when fuzzy grey relation is applied regression between each attributes is found we obtain 100% accuracy, so we choose grey relation for prediction.
Summary:
Correlation coefficient 1
Mean absolute error 0
Root mean squared error 0
Relative absolute error 0
Root relative squared error 0
Total number of Instances 15
X. EDITORIAL POLICY
The submitting author is responsible for obtaining agreement of all coauthors and any consent required from
sponsors before submitting a paper. It is the obligation of the authors to cite relevant prior work.
Authors of rejected papers may revise and resubmit them to the journal again.
XI. PUBLICATION PRINCIPLES
The contents of the journal are peer-reviewed and archival.
The journal INTERNATIONAL JOURNAL OF
ENGINEERING AND ADVANCED TECHNOLOGY (IJEAT) publishes scholarly articles of archival value as well as tutorial expositions and critical reviews of classical subjects and topics of current interest.
Authors should consider the following points:
1) Technical papers submitted for publication must
advance the state of knowledge and must cite relevant prior work.
2) The length of a submitted paper should be commensurate with the importance, or appropriate to the complexity, of the work. For example, an obvious extension of previously published work might not be appropriate for publication or might be adequately treated in just a few pages.
3) Authors must convince both peer reviewers and the editors of the scientific and technical merit of a paper; the standards of proof are higher when extraordinary or unexpected results are reported.
Because replication is required for scientific progress, papers submitted for publication must provide sufficient information to allow readers to perform similar experiments or
calculations and use the reported results. Although not everything need be disclosed, a paper must contain new, useable, and fully described information. For example, a specimen's chemical composition need not be reported if the main purpose of a paper is to introduce a new measurement technique. Authors should expect to be challenged by reviewers if the results are not supported by adequate data and critical details.
XII. CONCLUSION
In this paper we have collected ignition and CO2 values of different cars to detect the pollution level caused by them. We have done comparative study between different cars and proposed a fuzzy algorithm that distributes the data on the basis of rank. The grey analysis that we have applied here is a fuzzy algorithm that defines the grades for each row using which we can calculate the ranks. The steps mentioned above describes that how to find the grades and rank. Using data visualisation we have removed the attributes which are not suitable for including in the final dataset which has beenused for prediction like car name, car number and type of fuel. From our result we concluded that lower the rank, better the car. Ignition value and amount of CO2 produced are two most important factors in deciding whether the car produces excess pollution or not. In our dataset we are dealing with 15 cars instances that have different ignition and CO2 values among which the first rank is of that car which has lowest ignition value but highest CO2 values. The rank is given on the basis of gradient which is decided on the basis of maximum and minimum values of the given attribute. On the basis of this result we can decide which cars gives excess pollution. Using this data the car manufacturing companies can try to take care of the factors which lead to increase in emission of pollutants from cars
REFERENCES 1. https://www.jeffjournal.org/papers/Volume7/7.2.11H.Hasani.pdf 2. http://wiki.seeedstudio.com/Grove-Gas_Sensor-MQ9/ 3. https://www.transportenvironment.org/what-we-do/cars-and-co2 Car name Ignition value CO2
Produced Rank
Nissan sunny XL 30 2.39 15
Etios Toyota GD 34.35 3.14 14
Ertika Hybrid 16.35 5.38 12
Tiago XM Tata 0.27 8.96 10
Volks wagon
Polo 0.62 4.72 11
Ford Figo TDCI 5.62 6.29 10
Alto 800 0.02 11.95 6
Zest XE 10.3 11.95 6
Swift desire 6.36 13.1 5
Ford Figo TDCI 3.08 10.48 5
CiazVdit 4.71 22.01 1
Innova 2.5G 1.69 9.17 4
TATA zest
XMA 6.54 14.34 3
Grand i10 1.87 17.98 2
4. https://www.ncbi.nlm.nih.gov/books/NBK218135/
5. https://pdfs.semanticscholar.org/e5a8/053bb728de56fe953aa500c4b81
515bf510e.pdf
6. https://sciencing.com/list-5921485-effects-carbon-dioxide-air-pollution
.html
7. https://www.nationalgeographic.com/environment/global-warming/poll
ution/
8. http://www.mdpi.com/2071-1050/2/1/145/pdf
9. http://publications.iarc.fr/_publications/media/download/3700/f73ec51
5ebe6377bd0cfe1430065193a106e7b00.pdf
10.https://www.ucsusa.org/clean-vehicles/vehicles-air-pollution-and-huma
n-health
AUTHORS PROFILE Name : vishal yadav
Email id: [email protected] Phone number : 8870668337 University : VIT
Branch : Information technology
Name : divyansh khatana
Email id: [email protected] Phone number : 9521376808
University : VIT
Branch : Information technology
Name : meghna bajoria
Email id: [email protected] Phone number : 8935036240
University : VIT
Branch : : Information technology