International Journal of Innovative Technology and Exploring Engineering (IJITEE) ISSN: 2278-3075, Volume-8 Issue-7, May, 2019
Abstract: Skin cancer is highly ambiguous and difficult to identify and cure in the last stage. To increase the survival rate, it is important to recognize the stages of skin cancer for effective treatment. The main aim of the paper is to classify the various stages of skin cancer using dermoscopy images from the data repository of ISIC and PH2. The data is pre -processed with the help of median filter and wiener filter for removing the noise. Segmentation is processed using Watershed and Morphological. After the segmentation, features were extracted using Grey Level Co-occurrence Matrix (GLCM), Color, Geometrical shapes in order to improve the accuracy of dermoscopy image. Finally, the dataset is classified with some popular methods like KNN with 89%, Ensemble with 84% and SVM works better than the other two methods by giving the highest accuracy of 92%..
Index Terms:. Support Vector Machine (SVM), K -Nearest Neighbour (KNN), Gray Level Co-occurrence Matrix (GLCM), Median Filter, Weiner Filter, Thresholding
I. INTRODUCTION
Skin cancer is one of the dangerous problems which is increasing every year, it causes the maximum number of deaths compared to another type of cancer like lung cancer, breast cancer, cervical cancer etc. Skin is the largest organ of the body which is 1:7 of our body weight with the surface area of 1.75m2. The Human skin is divided into 3 layers which are Epidermis, Dermis and Subcutaneous tissue [1]. The Epidermis is the outer most layer of skin which offers Waterproof barrier and creating of skin tone. The dermis second layer after epidermis contains rough connective tissue, hair follicles, and sweat glands. The hypodermis is made of fat and connective tissue. The main function of the skin is to protect, prevent water and electrolyte loss and control the temperature through vasodilation, vasoconstriction and sweating. According to the Skin Cancer Foundation, skin cancer is the most common type of cancer In America nearly half of the population by the age of 65 diagnosed for some or the other type of skin cancer. Melanoma is accountable for around 75% of deaths globally [2]. This can be reduced by accurate analysis of skin cancer at an early stage. There are different types of skin cancer but not all are fatal, however if they are not treated properly a normal mole can also turn serious and change to melanoma. Skin cancer is susceptible to those parts of the skin which most of
Revised Manuscript Received on May 10 , 2019
Sanket Kumar, P.G. Scholar, Department of Computer Science, CHRIST (Deemed to be University), Bangalore, Karnataka, India
Dr. Chandra J, Associate Professor, Department of Computer Science, CHRIST (Deemed to be University), Bangalore, Karnataka, India.
the time is exposed to the sun, for instance, the scalp, face, lips, ears, neck, chest, arms and legs. Medical imaging is very important for clinical analysis. It is a combination of image modalities and processing the image for diagnosis and treatment purpose. It is the process of representing the interior or external body virtually. Lot of techniques that are used for cancer diagnosis are CT Scan, MRI, physical exam, laboratory test, dermoscopy test, Biopsy. One of the easiest ways is by using epiluminescent microscopy also known as dermatoscopy used by dermatologists, surgeons etc. also it is an alternative for the biopsy. By these techniques’ melanoma can be identified and the borderline of the lesion can be closely observed which can be positively diagnosed after the identification. CT scan and MRI are methods used for the internal image of the body by giving very accurate result for diagnosis of a Brain tumor and extremely helpful in defining body organ visualizations. Differences between normal and abnormal tissue are often clearer on an MRI image than a CT scan. Image processing is a process of changing the image to digital form, on which the operations can be performed in order to extract useful information from the image. There are numbers of steps it follows to extract the lesion from the normal dermoscopy image. By using different methods that are pre-processing, segmentation, features extraction and classification. In pre-processing the image are processed using gradient magnitude which is used in BW image for detecting the edge at which the pixel changes its level suddenly. The next step is Watershed Algorithm which is used for detecting the region and segmenting the lesion [3]. Watershed Algorithm used grayscale images where the gray scale topographic surface can be viewed. The topographic surface where intensity can be denoted by high intensity and low intensity are called as hills and valleys. All the valleys or local minima is been filled with different color, as soon as the valleys get overloaded it starts mixing with another color in other valleys. To stop this, barriers are created. Similarly, all the valleys are filled and barriers are created until all the peaks are under water it keeps on building barriers. Barrier will form the segmentation of the region. Now the morphological opening is used for small noise removal and morphologic closing is used to remove any small hole’s which is present in the image. Accurate segmentation increases the accuracy of results, for which Morphological opening and closing method is used which processes the geometrical shape based on a random function to obtain the border more meticulously.
Skin Cancer Classification using Machine
Learning for Dermoscopy Image
Pattern analysis is to identify the specific pattern of the lesion. Melanocytic have their general dermoscopy features and this can be a local pattern or global pattern where Local features combine individual or grouped characteristics about the lesion whereas Global pattern is a common pattern in the lesion.
II. RELATED WORK
Muhammad Ali Farooq et al. [4] have worked for classification of skin cancer by using PH2 dataset images along with Dull razor software for noise reduction. Active contours and Watershed hybrid were also methods which were used for segmenting the region. The highlight of using GLCM and Coarseness for classification along with SVM and ANN was the 85% accuracy that it yielded.
Omar Abuzaghleh et al. [5] have compared different features set to determine the best features for skin cancer detection. Work have done on 200 Dermoscopy images and the feature was extracted and five feature sets were calculated the following four features were calculated are Lesion Shape Feature, Lesion Orientation Feature, Lesion Margin Feature and Lesion Intensity Pattern Feature considerable improvement was observed with accuracy of 87%.
Wiem Abbes and Dorra Sellami [6] have focused on new features other than the ABCD rule, 7-point checklist, Menzies method and CASH algorithm which is used by many but are low-level features. The work is done using DermQuest dataset. Methods used are a median filter, thresholding and canny while feature extraction is done by shape features, color, texture. For color characterization k mean method is used and GLCM is used for feature extraction with 94% accuracy in the working model.
Hiam Alquram et al. [7] proposed a system for melanoma skin cancer detection and classification using SVM and in their work was done using Dermoscopy dataset where pre-processing is done using noise filter, median filter. Segmentation is processed using Otsu thresholding method. The texture feature is extracted using GLCM which focuses on feature extraction such as shape, color and other texture features. In addition to this PCA is used for reducing the number of features due to a different unit in feature set and comparison is done to obtain the best parameters.
Suleiman Mustafa et al. [8] have used color space by experimenting with luminance to enhance the visualization for Grab Cut segmentation, geometric and corner features, which are also used to train the SVM machines in learning the algorithm with promising results. Pre-processing has been done by using scale factor and delta to the scaled values to perform enhancements. HSV color space usually gets better information for image processing.
Yogendra Kumar Jain, Rashi Goel et al. [9] have used Back Engendering system (BPN), Spiral Radial Basis Function Network (RBF) and Extreme Learning Machine (ELM) in order to build the system.
Sarika Choudhari and Seema Biday [10] have worked on neural network system (NN) based method for detection of skin cancer, obtaining an image, filtering the image for
removing hair and noises are the different stages of detection by using the Maximum Entropy Threshold along with ANN which has yielded 86.66% accuracy.
Youssef Filali, et al. [11] have proposed an automated approach based on GLCM, EM Clustering for segmentation and to improvise on it they have used the morphological operator. GLCM texture is extracted and in order to classify the image, they have used SVM. Large database of 80 images is used in their work “Atlas of Dermoscopy”. They have achieved 83% accuracy in this domain. Idris Nayaz
Ahmed and Chaya P [12] have used the Wiener Filter for pre-processing. Other methods they have used are Distance Regularized Level Set (DRLS) strategy, Support vector machine (SVM) and GLCM. It is said that SVM is much better than another classifier, acquiring precision 91.66%, affectability 93.33% and specificity 90.00%.
Ammara Masood and Adel Al- Jumaily [13] have used histopathological images for a cancerous tissue. A combination of wavelet, statistical features, autoregressive parameters and differential evolution-based feature selection is used for feature extraction. The dimensional proposed framework is prepared and tried by utilizing a dataset of 150 histopathological pictures which fostered a precision of 89.1%.
Muhammad Ali Farooq et al. [14] have improved ALDS framework based on a probability by using active contours and watershed merged mask for segmenting out the mole and later SVM and Neural network. Classifier are incorporated for the classification of the segmented mole. Total combinations of 73 conventional features were selected in this paper where ANN classifier is used as a second level classifier to support the SVM and achieve accuracy of 90%.
Azadeh Noori Hoshyar et al. [15] have worked with ELM 7-point checklist, Menzies Method, Texture Analysis along with using different classifiers comprising of Linear Models, Polynomial Models, Neural Networks, Support Vector Machines, Semi–global Models such as Radial Basis Functions, Multivariate Adaptive Regression Splines
(MARS), Decision Trees, k–Nearest–Neighbours,
Projection-Based Radial Basis Function Network (PRBFN) with accuracy of 86.9%.
International Journal of Innovative Technology and Exploring Engineering (IJITEE) ISSN: 2278-3075, Volume-8 Issue-7, May, 2019
There are a lot of different methods used in different steps of the process. Which can be modified in order to increase the accuracy of the classification and that will be carried in our proposed work. Majority of work consider only 3 types of disease namely melanoma, squamous cell and seborrheic keratosis. But there is more disease which holds equal importance in medical field. So, this work focus in classifying 5 different types of cancer that are Actinic Keratosis, Basal cell, Dermatofibroma, Melanoma, Solar lentigo.
III. METHODOLOGY
Skin cancer classification is very important and it requires high accuracy for early detection of cancer. In this paper, feasible diagnosis system is planned by which stages of cancer are classified.
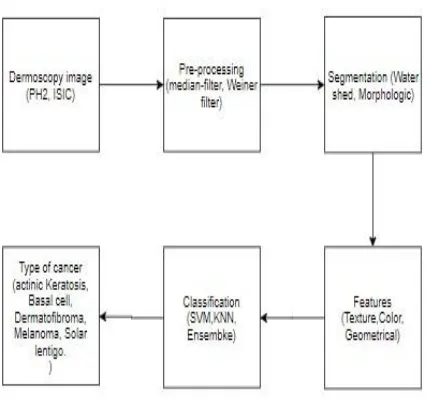
A. Proposed Framework
[image:3.595.50.264.396.600.2]This method is a way to help the diagnosis system and approach to provide aid to the dermatologist for classifying the lesion. In this part, the figure shows the proposed approach have following steps image preprocessing, image segmentation, features selection, classification. Fig 1 shows the steps of the proposed system, each steps have inbuilt processing and output of that goes to next step and finally classify with the results.
Fig 1: Proposed Framework
B. Pre-Processing
The Second step is pre-processing, where the input image is pre-processing using hybrid method using draw free hand, median filter for hair removal and unwanted bubbles and noise. Free mask techniques are used for selecting the effected region because some automatic segmentation does not provide with an anticipated result. Median filter is a technique that uses nonlinear digital filtering, which removes noise from the image. It uses box or cross pattern for making the window it compares the neighbor’s pattern and slides entry by entry over the entire image. It works better for speckle noise and salt and pepper
noise. Median filter works better in removing the noise while preventing the edge.
Median = rep (sv,mpv) (1)
Median is calculated as shown in equation 1 where rep is used for replace, sv represent sorted value, mpv represent median pixel value.
C. Segmentation
Next step is segmentation and is a very important and the most difficult step in the entire process. This is done in order to take out the cancerous region from the image which will be used later for the classification. The Watershed algorithm is used for better segmentation with morphology opening and closing method which gives us a better result than that of the Otsu thresholding and other methods. After the region is selected it has to be compared with the original image to differentiate the two regions.
1) Otsu Thresholding
This method is used for converting a grayscale image into monochrome and which is the common image processing tasks. It iterates all possible threshold value and each side of the pixel level is calculated for measurement of spread for pixel level. The main aim is to sum the background and foreground spread to be minimum. Within class
Variable=wb*vb*wf*vf (2)
It is the obtained by the sum of two variances multiplied by associate weight as shown in equation 2 where wb is weight background, vb is variable foreground, wf is weight foreground and vf is variable foreground. It works perfectly for the bi-modal histogram.
2) Watershed Algorithm
Watershed Algorithm used grayscale images where the gray scale topographic surface can be viewed. The topographic surface where intensity denoted by high intensity and low intensity also called as hills and valleys. All the valleys or local minima is filled with different colors but as soon as the valleys get overloaded, it starts to mix with other colors in other valleys. To stop this, a barrier is created. Similarly, all the valleys are filled and the barrier is created and overload until all the peaks are under water. Barrier forms the segmentation of the region. There is a necessity to remove the present noise and any small holes by using morphological Opening and morphologic closing.
In the region where the lesion is present in the original image, the unnecessary region then gets eliminated by subtracting the sure foreground and the background area. The selected region is denoted with 0-pixel value in the segmented image and then searched in the original image to get the region. Steps of segmentation are followed to the whole dataset and prepare the dataset for training the model, all the images are stored for features calculation which is done for the image to show
D. Feature Selection
This step contains all the common features which help in categorizing the classes of cancer. There are reportedly 34 features that are taken which includes the texture feature, color features, shape-based features etc. These features have been checked together along with different combinations which would be eventually beneficial for detecting types of cancer. GLCM is well known for pattern-based features where 22 features are extracted from the region after segmentation. Geometrical features are used for better classification which gives region properties such as area, major axis, minor axis, perimeter, diameter and roundness of the region. The classification with and without color is calculated and end shows which is more accurate. Color features are very essential for skin lesion classification. Six different colors are used for each lesion like Black, white, red, dark brown, blue-gray, and their presence in lesion are scored with percentage and stored as features. Color is been scored 1 if it presents more than 5% in the skin which tells its presence is more in lesion.
1) Gray Level Co-occurrence matrix
Gray Level Co-occurrence matrix is an image analysis technique for getting the texture features. The pixel of interest is chosen for texture features calculation use content of GLCM and intensity of variance is measured. Following steps are taken in GLCM.
Algorithm 1: GLCM 1: Quantize the image.
2: Create GLCM of matrix B*N where N is number of levels specified under Quantization
3: Calculate the selected features where the values used which is present in GLCM where Energy as given in Equation 2, Entropy, Contrast features, Correlation features and others are calculated.
2) Geometrical Region properties
Region properties are calculated such as Area which is the count of pixel in the region, centroid where regions center of mass is calculated, Eccentricity value is between 0 and 1 which is normalized second central moments, Major Axis Length is calculated as the max length of the ellipse which is having the same normalized, vice-versa for Minor Axis length where minor axis length is calculated similarly like Major axis, Perimeter is calculated for length of boundary for the object.
Value= regionprops(BW,prop) (4)
In equation 4 value contains all the output from the region which can be stored as a feature. Here BW is input image and prop is the properties for that image.
3) Color features
Color features of skin lesion are used for knowing the lesion color. There are a number of colors which are usually seen in lesion and the variation in color happens for the different stages of the lesion. As the stages of cancer increase, the color of the region is also affected. The normal skin lesion color will be brown, tan or black spot.
E. Classification
It is the algorithm in machine learning which is used for supervised learning in which the program learns from the data and then it uses it learning to classify new observation. The final step, is where the result lies. To achieve this, different classification type which frequently yields good results such as SVM, KNN and Ensemble in the proposed work are used. In machine learning and statistics, classification is used for
Identification to which categories their data belongs, on basic training of the data.
Classification is used for predict the discrete class label. Support Vector Machine is a classifier which uses the concept of separating hyperplane which is an optimal hyperplane which divides the class. One class is present on either side. SVM is improvised by using regulation value. Higher value leads to the result like right one illustrated in the image. In real time, a lot of data is trained for finding a perfect class which is a very difficult task and is time consuming. Hence, to improve this, regularization parameter, Kernel and gamma this is the turning parameter in SVM classifier.
KNN is used in pattern recognition and this method is a non-parametric method used for classification. In the feature space, the data are plotted. In KNN classification the output is considered as class membership and is classified on the basis on the number of votes by their neighbors, in this the neighbors give a weight consider 1:c where c be the distance of the neighbor.
Algorithm 2: KNN 1: Upload the data 2: Give value to K
3: Predicted class is calculated
4: By the use of Euclidean distance for calculating distance metric for calculating the distance between test and train data. There are other methods that can also apply are cosine, Chebyshev etc.
5: Calculated distance value is sorted in ascending order. 6: Pick the highest K value from array.
7: Pick the frequent class from rows. 8: Predicted class is returned.
Ensemble learning is used for improving the result it combines several models. It is meta-algorithm which combines different machine learning and makes one predicate model which decreases the error and improvises the learning model which, combines the features of a different model for giving the result. Datasets are classified into different types of cancer which are actinic Keratosis, Basal cell, Dermatofibroma, Melanoma, Solar lentigo.
IV. RESULT AND DISCUSSION
The first step is an image acquisition of the required area. For this, PH2 [17] and ISIC [18] dataset are used. This dataset contains both melanoma and non-melanoma wherein PH2 has common, atypical and melanoma images. The dataset contains a total of 200 images which are used for training and testing the model. Where in ISIC there are more than 30000 images of multiple types of
International Journal of Innovative Technology and Exploring Engineering (IJITEE) ISSN: 2278-3075, Volume-8 Issue-7, May, 2019
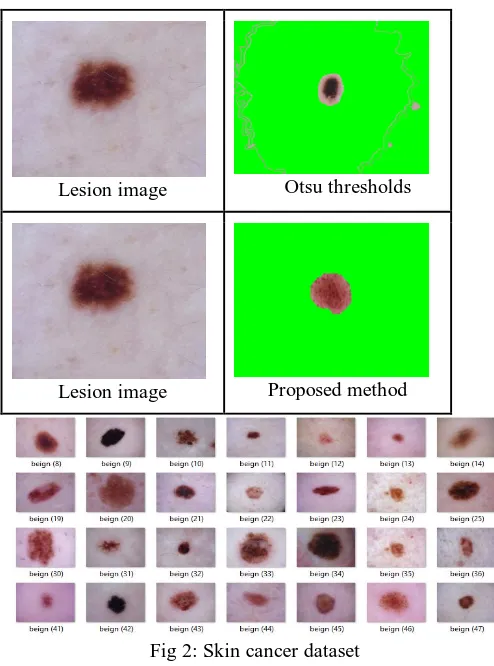
Fig 2: Skin cancer dataset
An initial step is that of Dermoscopy images as the dataset is downloaded from ISIC having large number of images. Original image contains noise and the unwanted regions that has to be removed and to achieve this, the median filter is used which removes the noise and increase the smoothness. The Second step is pre-processing where the input image that has done manual image pre-processing using the draw free hand. By applying the median filter for hair removal, unwanted bubbles and noise is reduced. Free mask is been used in MATLAB and the lesion image is selected because automatic segmentation has not provided us with an anticipated result
.
Fig 3 (a) Fig3 (b)
In Fig 3(a) image is taken and the pre-processing is applied to detect the border of the lesion, as shown in Fig (b) clearly the effected region is highlighted with yellow color.
Segmentation: This step is very important and the most difficult step in the entire process. This is done in order to take out the affected region from the image which will be used later for the classification. The Watershed algorithm is used for better segmentation with morphology opening and closing method which gives us better result than that of the Otsu thresholding and other methods. After the region is
[image:5.595.308.547.183.321.2]selected it has to be compared with the original image to differentiate the two regions.
Fig 4: Detection of lesion
In Fig 4 input image are inserted in the system to check to which class the cancer belongs. Which is only possible when the border are clearly visible so non cancer region can be separated from the image. Same is followed to all the images in dataset as shown in Fig 5.
Fig 5: Lesion image dataset
Features Selection: This step contains all the common features which help in categorizing the classes of cancer. , There are reportedly 33 features that are taken including the texture feature, color features, shape-based features, etc. These features have been checked together along with different combinations which would be eventually beneficial for detection of types of cancer GLCM is well known for pattern-based features where 22 features are extracted from the region after segmentation. Geometrical features are used for better classification which gives region properties such as area, major axis, minor axis, perimeter, diameter and roundness of the region. We have calculated the classification with and without color and end result is what makes the difference. Color features are very essential for skin lesion classification. 6 different colors are used for each lesion like Black, white, red, dark brown, blue-grey, and a score with percentage is stored as features. Color is been scored 1 if it present more than 5% in the region.
GLCM is one of the best methods used for texture properties calculation which is used in Image and where the similarities of same type of the images are calculated in order to separate the other type of properties from it. Different 22 features and taken as features for differentiating the class of cancer features are Energy, Entropy, Dissimilarity, Contrast, Inverse, Difference, correlation, Homogeneity, Autocorrelation, ClusterShade, cluster Prominence, Maximum probability, Sum of Squares, Sum Average, Sum Variance, Sum Entropy, Difference variance, Difference entropy, Information measures of correlation, Information measures of correlation, Maximal correlation coefficient, Inverse difference normalized (INN), Inverse difference moment normalized (IDN). They are combined with other features such as geometrical and color feature. Some of the features are listed in below
Table 1.
Lesion image Otsu thresholds
[image:5.595.47.260.547.648.2]Table 1: Shape based features
Input Area Diamete r
Round Pr
Imag e 1
1.44 450.86 0.83 1554.41
Imag e 2
1.18 1072.37 0.80 3755.70
Imag e 3
1.61 887.47 0.36 4590.11
[image:6.595.305.549.204.394.2]Shape features are calculated and gives area, diameter, perimeter, roundness, circularity. Different shape features are also calculated because as day passes the size of the lesion changes. Change in shape should also be calculated. These features are some common types that is to be calculated.
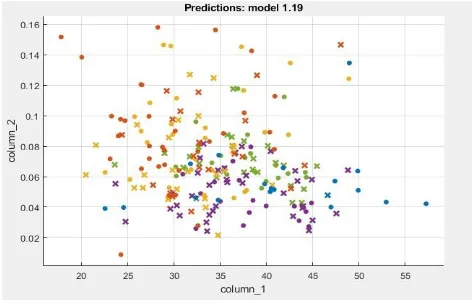
Fig 6: Prediction dot graph
This model uses data mining and probability to show the outcome of the data. It has all the input image data. It uses historical data so the future event can be predicted. In this, the different color dots show different types of cancer and all are scatted so that the model is created.
[image:6.595.50.288.299.451.2]The prediction model is created on which the classifier is applied and the data present are predicted from it. Like SVM, KNN, Ensemble is applied to this for the prediction.
Fig 7: parallel coordinate plot
Fig 7: The parallel coordinate plot is high dimensional
geometry and multivariate data are visualized using a parallel coordinate plot. It is plotted in n-dimensional space and n parallel lines are drawn for visualization of data. This method is used for visualization of statistical data which have 3 important things that are an order of data, rotation and axes scaling. By this order are used for calculation of features discovery. Rotation is used for parallel coordinate translation and if the lines go out of axes it is been rotated. Here X-axis shows the features of the model and Y-axis shows the value of those features.
Fig 8: Roc curve
[image:6.595.305.561.564.639.2]Roc curve, this show the diagnostic ability of the classifier. It is plotted by using true positive against false positive rate, the Graphical way of presenting part of the confusion matrix. Its shows true positive rate on Y axis with false positive rate on X axis. Each model has a different ROC curve. It is mostly used for binary classification. For multi classification the data should be binarize then the ROC can be plotted for different label where each level represents different class.
Table 2: Observation’s for classification
Classification result with different methods and different accuracy is observed. The proposed work is done with 3 types of input image size. The 1st experiment is done using 30 images where both benign and malignant images are present and their features are calculated and classified with 3 different methods with an accuracy of 92 for SVM, 88 for KNN, and 85 for Ensemble. Similarly, it did for 60 image dataset and 90 image datasets with accuracy from 83-92%.
No of images
No of features
SVM KNN Ensemble
30 34 86% 72% 79%
60 34 88% 88% 80%
[image:6.595.48.289.601.764.2]International Journal of Innovative Technology and Exploring Engineering (IJITEE) ISSN: 2278-3075, Volume-8 Issue-7, May, 2019
hoto The highest accuracy obtained is 92% which concludes in
our observation that SVM is one of the best classifiers among other 2 types. The result shows different types of cancer which are indicated by actinic Keratosis (0), Basal cell (1), Dermatofibroma (2), Melanoma (3), Solar lentigo (4).
V. CONCLUSION
Skin cancer classification is done with the help of SVM, KNN and Ensemble, the image is pre-processed using the hybrid method that are wiener filter and median filter. After pre-processing the lesion is extracted using the segmentation method like Watershed algorithm followed with morphology. Features are extracted like texture features, geometrical features and color features. The classification result of different techniques is compared for their performance. The computed performance shows that SVM is better than the other two classifiers giving the highest accuracy of 92%.
VI. ACKNOWLEDGMENT
I would like to thank Prof. Joy Paulose, for his valuable suggestions and guidance at every step for completing this paper.
REFERENCES
1. Paul Wighton , Tim K. Lee ; Harvey Lui , David I. McLean , M. Stella Atkins. “Generalizing Common Tasks in Automated Skin Lesion Diagnosis” [2011]
2. "Skin Cancer Treatment (PDQ®)". NCI. 25 October 2013. Archived from the original on 2014. pp. Chapter 5.14. ISBN 9283204298. 5 July 2014. Retrieved 30 June 2014.
3. World Cancer Report 2014. World Health Organization.
4. Muhammad Ali Farooq, Rana Hammad Raza “Automatic Lesion Detection
System (ALDS) for Skin Cancer Classification Using SVM and Neural Classifiers”
5. Omar Abuzaghleh, Miad Faezipour* and Buket D. Barkana “A
Comparison of Feature Sets for an Automated Skin Lesion Analysis System for Melanoma Early Detection and Prevention”
6. Wiem Abbes and Dorra Sellami “High-Level features for automatic skin
lesions neural network based classification”
7. Rashi Goel and Saranjeet Singh “Skin cancer detection using GLCM matrix
analysis and SVM classifier”
8. Suleiman Mustafa, Ali Baba Dauda, Mohammed Dauda “Image Processing
and SVM Classification for Melanoma Detection” 2017
9. G.Subha Vennila and L.Padma Suresh “Dermoscopy Image Segmentation
and Classification using Machine Learning Algorithms” 2012
10. Sarika Choudhari and Seema Biday “Artificial Neural Network for
Skin Cancer Detection” 2014
11. Youssef Filali, Assia Ennouni, My Abdelouahed Sabri, Abdellah Aarab
“Multiscale approach for skin lesion analysis and classification” 2017. 12. Idris Nayaz Ahmed, Chaya P “Segmentation and Classification of Skin
Cancer Images”[2014].
13. Ammara Masood, Adel Al- Jumaily “Differential Evolution based Advised
SVM for Histopathological Image Analysis for Skin Cancer Detection” 2015.
14. Muhammad Ali Farooq, Muhammad, Aatif Mobeen Azhar, Rana Hammad
Raza “Automatic Lesion Detection System (ALDS) for Skin Cancer Classification Using SVM and Neural Classifiers” [2016]
15. Azadeh Noori Hoshyar, Adel Al- Jumaily, Riza Sulaiman “Review On
Automatic Early Skin Cancer Detection” 2011
16. V. Jeya Ramya, J. Nagarajan, R. Prathipa and L. Ashok Kumar “Detection
of Melanoma Skin Cancer Using Digital Camera Images”2015
17. D. Gutman, N. C. F. Codella, E. Celebi, B. Helba, M. Marchetti, N. Mishra,
and A. Halpern, “Skin Lesion Analysis toward Melanoma Detection: A
Challenge at the International Symposium on Biomedical Imaging (ISBI) 2016, hosted by the International Skin Imaging Collaboration (ISIC),” arXiv e-print arXiv:1605.01397, 2016.
18. Mendonça Teresa, Pedro M. Ferreira, Jorge Marques, Andre R. S.
Marcal, Jorge Rozeira, "PH2 - A dermoscopic image database for research and benchmarking", Published in the Proceedings of 35th International Conference of the IEEE Engineering in Medicine and Biology Society, July 3–7, 2013.
AUTHORS PROFILE
Sanket Kumar is PG Scholar in Department of Computer Science, CHRIST (Deemed to be University), Bangalore, Karnataka, India. He has studied his B.C.A. from Bangalore. His research area is Image Processing, Data Analytics.
Chandra J. is an Associate Professor at Department of Computer Science, CHRIST (Deemed to be University), Bangalore, Karnataka, India. She holds a Masters in Computer Applications from Bharathidasan University. She has MPhil in Computer Science from Vinayaka Mission University and PhD in Hindustan University. Her research interests include Artificial Neural Network, Data Mining, Genetic algorithm, genomics, Machine Learning, big data analytics and Predictive analytics.