Abstract: The contribution of a plant is highly important for both human life and environment. Diseases will affect plant, like all humans and animals. Various diseases may affect plant which disturbs the plants normal growth. Leaf, stem, fruit, root, and flower of the plant may get affected by these diseases. Without proper care the plant may die or its leaves, flowers, and fruits drop. Finding of such infections is required for exact distinguishing proof and treatment of plant sicknesses. The current technique for plant malady discovery utilizes human contribution for distinguishing proof and characterization of illnesses and these strategies endure with time-unpredictability. PC supported programmed division of illnesses from plant leaf utilizing delicate registering can be fundamentally valuable than the current techniques. In this paper, we proposed a method using Artificial neural network (ANN) for identification, classification and segmentation of diseases in plant leaf automatically. In the proposed system capturing the leaf images is done first and then contrast of the image is improved by using Contrast Limited Adaptive Histogram Equalization(CLAHE) method. Then, color and texture features are extracted from the segmented outputs and the ANN classifier is then trained by using that features and it could able to separate the healthy and diseased leaf samples properly. Exploratory outcomes demonstrate that the arrangement execution by ANN taking list of capabilities is better with an exactness of 98%.
Keywords: Equalization, classification, segmentation, artificial neural network and accuracy.
I. INTRODUCTION
PCs have evolved to be an important device in an exceedingly range of applications like medical, medical, military, agriculture, engineering etc. with its capability to process the data like pictures taken from some computing devices. A picture contains significant data that can be recovered by utilizing some computational technique. Plants assume a significant job in every one of the parts of life. They fill in as a spine to support the earth. Plants do experience the ill effects of infections, which influences the ordinary development of plants. These infections influence total plant including leaf, bloom, leafy foods. Location of such plant maladies is a significant undertaking to perform. The current strategy for the distinguishing proof and arrangement of infections from a plant is finished with the assistance of human mediation.
Revised Manuscript Received on August 01, 2019
Bharath Subramani, Assistant Professor, Department of Electronics and
Communication Engineering,
PSNA College of Engineering and Technology, Dindigul, Tamilnadu, India-624622
Selvapandian Arumugam, Assistant Professor, Department of
Electronics and Communication Engineering,
PSNA College of Engineering and Technology, Dindigul, Tamilnadu, India-624622
Balakumaresan Ragupathy, Assistant Professor, Department of
Electronics and Communication Engineering,
PSNA College of Engineering and Technology, Dindigul, Tamilnadu, India-624622
Specialists through unaided eye mention objective facts about the illnesses of a plant by consistent observing of plants over an enormous timeframe. Different methodologies for recognizing the illness in plant leaf are talked about. Y. Lu et.al [1] present the survey on the automatic identification and diagnosis of rice disease which are highly desired in the field of agriculture. V.Singh et.al [2], implemented a method to detect and classify the plant leaf diseases. P. B. Padol and et.al [3], proposed the technique for detection and classification of grape leaf diseases using SVM classification algorithm. J. G. A. Barbedo et.al [4] present the detection and classification of leaf diseases from 12 different plant species-based color transformation, color histograms and a pair- wise based classification system. J. K. Patil et.al [5], proposed the technique named content-based image retrieval (CBIR) for retrieving diseased leaves of soybean. M. Ramakrishnan et.al [6], used a method for identification of plant leaf disease and classification in the groundnut leaf. He performed the enlargement techniques for detection of unhealthy region of the plant leaves. Z.-Y. Liu et.al [7] implemented the technique for detection and classification of plant leaf disease and develop an intelligent information system to recognize rice seeds variety based on image processing and Artificial Neural Network. Neumann et.al [8] proposed a method to make image analysis task in agriculture in which beet leaves and other plant leafs are processed to detect plant diseases. I. Kaur et.al [9] proposed the examination work, plant leaf sicknesses are identified and grouped utilizing the picture handling methods. L.Yuan et.al [10], presents the new method for monitoring crop diseases and pests. A. Camargo et.al [11], reports a machine vision framework for the distinguishing proof of the visual side effects of plant maladies, from hued pictures of the cotton crops. More often than not, these current methodologies of sickness distinguishing pieces of proof are tedious and unwieldy. Along these lines, to screen the plant ailment at a beginning time, utilization of some programmed strategy can be very helpful. In this paper, computer aided identification, segmentation and classification of disease from plant leaves is proposed. The proposed method uses modified K-means to assign segmentation to ANN and to find the affected region for the different disease present on the plant leaves. Combination of modified K-means algorithm with ANN achieves an efficient result in plant disease diagnosis.
II. METHODS
In this section, the basic steps for plant leaf disease detection and classification using proposed method is shown fig.1.
Computer Aided Classification and Detection of
Leaf Disease using ANN
Fig 1. Frame work of the proposed method A. Image data set
In the present work, plant infections found on agribusiness/cultivation crops to be specific, contagious, bacterial, viral, nematodes inadequacy and typical (not influenced) are considered for acknowledgment and order. This constitutes 6 classes. The examination considers 140 example pictures for acknowledgment and arrangement reason. The arrangement of 140 example pictures utilized in this work was gotten from branch of plant pathology, at the University of Agricultural Sciences, Dharwad, INDIA. At first, the signs and indications of ailment are seen on plant leaves. The approaches for recognizable proof and characterization of plant maladies influencing the leaves of farming/cultivation harvests have been created.
B. Pre-processing
Picture quality is complete for the delayed consequences of examination, affecting both the capacity to distinguish includes under examination and precision of ensuing estimations. Picture improvement strategies are utilized to underscore highlights of intrigue and feature certain subtleties covered up in the picture. To improve the nature of the picture, pre-preparing steps are connected over the picture. Pre-preparing of the picture incorporates conceal amendment, expelling relics, and organizing. A few pictures, initially from camera, show uneven lighting called conceal. Because of variety in open air lighting conditions, a few areas are more brilliant and some others are darker than the mean an incentive for the entire picture. This wonder is an outcome of incorrectness in the framework. The pictures contain a few antiques incorporates scratches, coat or imprint, pieces of residue or grating particles. Contrast Limited Adaptive Histogram Equalization (CLAHE) method is adopted for image contrast enhancement, it works on little segments of the image rather than the whole image. As the name indicates that CLAHE method segments the original image into contextual regions and then for each segments HE is applied individually. It makes the concealed highlights of the image unmistakably noticeable and spreading of used gray values. Bilinear interpolation is utilized to join the neighbouring tiles for removal of artificially induced boundaries. The contrast inhomogeneous regions can be restricted to adding noise that might be exist in the original image.
C. Segmentation
In picture division, the detachment of the given picture into homogenous districts as for specific highlights is finished. clustering is a technique by which the enormous arrangements of information are assembled into groups of littler sets or portions of comparative information. In present work,
modified K-means clustering is utilized for sectioning a picture into three gatherings.
For most piece of the green shaded pixels is concealing. In this progression, we determined an edge esteem that is utilized for these pixels. In view of this edge esteem, for the most part green pixels are gets veiled: if pixel force of the green segment is not exactly the pre-figured edge esteem, at that point zero worth is doled out to the red, green and blue segments of this pixel in the tainted groups, inside the limits, expel the covered cells. Acquire the valuable portions to order the leaf infections. Fragment the segments utilizing Genetic Algorithm (GA) for doing clustering properly, the hunt capacity of GAs can be utilized, to set of unlabeled focuses in N-measurement into K groups. On picture information, we have connected a similar thought in our proposed plan. We have taken a shading picture of size m x n and each pixel has Red, Green and Blue segments. Each chromosome demonstrates an answer, which is an arrangement of K cluster centers. Populace is instated in different adjusts arbitrarily and from existing chromosome best chromosome gets by in each round for the following round handling. In the initial step of wellness calculation the dataset of pixel is bunched by closest separate group focuses such that each pixel xi of color image is put into the respective cluster with cluster Z_j for j=1,2,….,K by the following equations
Where,
In the further advance new group focuses are gotten by ascertaining the mean of every pixel of the allocated clusters. The new center of cluster Zi is given by for the cluster Ci as
(2) Presently the wellness capacity is figured by computing Euclidean separation between the pixels and their individual clusters by utilizing following conditions
(3)
(4)
Modified K-Means Algorithm
a) First gap the dataset into K number of clusters and allot the information guides haphazardly toward the groups.
b) At that point for every datum point, figure the Euclidean separation, from the information point to each group. c) On the off chance that the information point is nearest to its very own cluster, at that point leave it where it is.
d) Move it into the close-by cluster, if the information point isn't nearest to its own group.
e) Rehash all means until a whole go through every one of the information focuses.
D. Feature extraction
The component extraction is utilized to separate the data that can be utilized to discover the essentialness of the given example. The principle sorts of highlights are shape, shading and surface, which are for the most part utilized in picture preparing method. Here for highlight extraction the strategy utilized shade of a picture are considered, to go to the novel highlights, which demonstrates that picture. Over the customary dim scale portrayal, in the obvious light range, the utilization of shading picture highlight gives an extra component to picture trademark. There are three noteworthy numerical procedures in the shading co-event technique. To begin with, transformation of the RGB pictures of leaves is done into HSI shading space portrayal. After consummation of this procedure, to create a shading co-event grid, every pixel guide is utilized, which results into three shading co-event frameworks, one for each of HSI. The features computed include contrast, uniformity, maximum probability homogeneity, diagonal variance, difference variation, entropy, inverse difference moment, correlation which is shown in table 1. Hence in this system, color and texture features are extracted to get better accuracy. At first, it is need to compute the color and texture features for classification, before we use ANN to train the classifier.
Table- I: Formulae for features where, p - probability function
i,j - co-occuring pairs d - number of samples θ - angle of deviation
E. Recognition and Classification
The acknowledgment procedure comprises of two stages, preparing and characterization. Arrangement of picture is finished by utilizing ANN calculation.
Artificial Neural Network (ANN)
ANN is a data processing model that is inspired by the way biological nervous schemes, such as the brain to process the data. The main element of this model is the structure of the information processing system. It is made out of countless interconnected handling components (neurons) working as one to tackle exact issues. ANN is prepared and tried utilizing pictures of plant illnesses. The example pictures are partitioned into two parts and one half is utilized for preparing and other is utilized for testing. The shading and surface highlights are utilized to prepare and test neural system model. The rate precision of acknowledgment and order is characterized as the effectively perceived example pictures to the complete number of test pictures.
(5)
In this work we will be focusing on four different diseases which affects the plant leaves are as follows: Alternaria alternate, Bacterial blight, Anthracnose, Cercospora leaf spot and it is shown in table 2.
Leaf Disease name Cause/
symptoms
Effect Suitable
climatic condition Alternaria alternata Alternariaalte rnataf. sp.lycopersici / Cankers
in stem.
spread to whole plants
Tomato fruit affected with brown cankers Moist warm temperature Anthracnose Colletotrichu mspp./
appears on
leaves as
small and
irregular yellow, brown, dark-brown, or black spots.
Affected plants develop dark, water-soaked lesions Coolwet weather Bacterial blight Pseudomonas savastanoi/It include angular lesions, starts
with small
yellow to
brown spots.
The centres
will turn into dark reddish-brow n and dry out.
The lesions Expand and then appear as drydead spots. Wet weather Cercospora leaf spot Cercosporaca nescens/ The symptoms
appear on
leaves as
water-soaked
spot with
greyish borders
Leaf may
become unshaped and wrinkled.
High humid
Table- II: Types of diseases and their causes/symptoms, effects and suitable climatic conditions.
III. RESULTSANDDISCUSSIONS A. Classification of Disease
As discussed in the introduction, solution is composed of four phases. Initially, disease affected dataset is considered as the input image. At that point picture is improved utilizing complexity constrained versatile histogram evening out by dispersing the force of the picture utilizing combined dissemination work. At that point picture power is reestablished to get upgraded picture.
S.No Features Formulae
1 Contrast ∑i∑j|i-j|
2p(i,j,d,θ)
2 Uniformity(Energy) ∑i∑j p(i,j,d,θ) 2
3 Maximum
Probability Maxij p(i,j,d,θ) 4 Homogeneity ∑i∑j p p(i,j,d,θ) /(1+|i-j|)
3 Inverse difference
moment of order 2 ∑i∑j 1/(1+(i-j)
2) p(i,j,d,θ)
6 Difference variation Variance of ∑p(i,j,d,θ) i∑j |i-j|
This improved picture is sectioned utilizing modified k-algorithm as three fragments as infection influenced ROI, Unaffected ROI and rest foundation ROI. From these sections, malady influenced picture part is considered to check the sort of ailment and to discover the percentage of infection influenced divide. In this matrix, we are maintaining the disease symptoms by calculating the different feature values. In view of these qualities, highlight are matches with master dataset values. ANN is utilized to discover the sort of infection by coordinating with the element classes. Likewise, the level of infection influenced bit is assessed. At long last, the precision of results is registered.
Figure.2 shows the process of identification and classification of Alternaria alternate disease.
Fig.2 Process of identification and classification of Alternaria alternate disease (First column- Original input image, Second column- Enhanced image, Third column- Segmented ROI).
Figure.3 shows the process of identification and classification of Bacterial blight disease.
Fig.3 Process of identification and classification of Bacterial blight disease (First column- Original input image, Second column- Enhanced image, Third column- Segmented ROI).
Figure.4 shows the process of identification and classification of Anthracnose disease.
Fig.4 Process of identification and classification of Anthracnose disease (First column- Original input image, Second column- Enhanced image, Third column- Segmented ROI).
Figure.5 shows the process of identification and classification of Cercospora leaf spot disease.
Fig.6 Process of identification and classification of healthy leaves (First column- Original input image, Second column- Enhanced image, Third column- Segmented ROI).
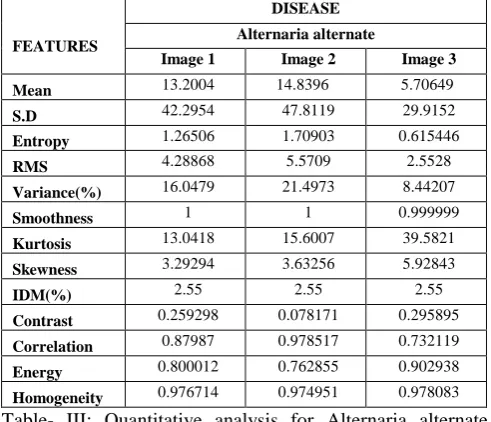
B. Quantitative Analysis
The feature extraction of various features for leaf images are extracted and summarized in database table as a specific entry for each disease. The first section presents the results individualized for each plant images. Here, the comparison of various features for the three images after identification of plant disease as Alternaria alternata are evaluated as follows:
FEATURES
DISEASE
Alternaria alternate
Image 1 Image 2 Image 3
Mean 13.2004 14.8396 5.70649
S.D 42.2954 47.8119 29.9152
Entropy 1.26506 1.70903 0.615446
RMS 4.28868 5.5709 2.5528
Variance(%) 16.0479 21.4973 8.44207
Smoothness 1 1 0.999999
Kurtosis 13.0418 15.6007 39.5821
Skewness 3.29294 3.63256 5.92843
IDM(%) 2.55 2.55 2.55
Contrast 0.259298 0.078171 0.295895
Correlation 0.87987 0.978517 0.732119
Energy 0.800012 0.762855 0.902938
Homogeneity 0.976714 0.974951 0.978083
[image:5.595.47.290.48.242.2]Table- III: Quantitative analysis for Alternaria alternate disease.
Fig .7 Graphical analysis of features for Alternaria alternata disease
Here, the comparison of various features for the three images after identification of plant disease as Bacterial blight (BB) are evaluated as follows:
FEATURES
DISEASE
Bacterial blight
Image 1 Image 2 Image 3
Mean 21.01016 27.6109 22.7544
S.D 53.7892 59.1547 57.3395
Entropy 2.87044 2.20661 1.96146
RMS 7.31484 5.54855 6.21388
Variance(%) 28.2936 23.7449 31.267
Smoothness 1 1 1
Kurtosis 11.5658 5.67562 8.14521
Skewness 3.06233 1.99073 2.5054
IDM(%) 2.55 2.55 2.55
Contrast 2.68611 0.514737 2.18199
Correlation 0.425071 0.552317 0.580498
Energy 0.558137 0.523533 0.533253
[image:5.595.303.553.109.410.2]Homogeneity 0.912283 0.95125 0.90043
Table- IV: Quantitative analysis for Bacterial blight disease.
Fig .8 Graphical analysis of features for Bacterial blight disease.
Here, the comparison of various features for the three images after identification of plant disease as Anthracnose are evaluated as follows:
FEATURES
DISEASE
Anthracnose
Image 1 Image 2 Image 3
Mean 14.5825 13.68 24.3841
S.D 48.7528 40.1558 47.9203
Entropy 1.31055 1.50267 2.81951
RMS 4.93734 5.23002 7.54115
Variance(%) 22.6274 15.3373 20.3609
Smoothness 1 1 1
Kurtosis 13.7375 11.5978 5.48632
Skewness 3.40321 3.0491 2.03525
IDM(%) 2.55 2.55 2.55
Contrast 1.33877 0.553505 0.418137
Correlation 0.525291 0.76676 0.857885
Energy 0.750313 0.727974 0.555333
Homogeneity 0.934336 0.943949 0.933353
[image:5.595.46.292.390.601.2] [image:5.595.304.549.526.729.2] [image:5.595.45.292.632.746.2]Fig .9 Graphical analysis of features for Anthracnose disease.
Here, the comparison of various features for the three images after identification of plant disease as Cercospora leaf spot are evaluated as follows:
FEATURES
DISEASE
Cercospora leaf spot
Image 1 Image 2 Image 3
Mean 44.1781 71.8515 28.7571
S.D 76.8477 83.074 52.4431
Entropy 3.32197 5.12011 3.85912
RMS 8.68949 11.4814 9.26747
Variance(%) 54.9424 56.8262 24.4226
Smoothness 1 1 1
Kurtosis 3.41159 1.82704 8.79473
Skewness 1.43069 0.649732 2.38853
IDM(%) 2.55 2.55 2.55
Contrast 1.31978 0.488549 0.498085
Correlation 0.854801 0.958015 0.877535
Energy 0.480227 0.268733 0.453099
Homogeneity 0.919416 0.940233 0.926901
[image:6.595.45.290.51.187.2]Table- VI: Quantitative analysis for Cercospora leaf spot disease
Fig.10 Graphical analysis of features for Cercospora leaf spot disease.
Here, the comparison of various features for the three images after identification of input leaves as healthy leaves are evaluated as follows:
FEATURES
DISEASE
Healthy leaves
Image 1 Image 2 Image 3
Mean 51.2904 31.507 35.9273
S.D 70.0072 50.2684 64.0483
Entropy 5.07922 3.80079 3.24062
RMS 10.4594 9.43807 8.36129
Variance(%) 29.3618 21.093 34.4343
Smoothness 1 1 1
Kurtosis 3.10911 4.78026 3.70728
Skewness 1.17011 1.5851 1.50846
IDM(%) 2.55 2.55 2.55
Contrast 0.38796 0.724852 0.757251
Correlation 0.950035 0.835599 0.898844
Energy 0.227233 0.353032 0.442433
Homogeneity 0.929342 0.912979 0.929496
[image:6.595.304.550.180.291.2]Table- VII: Quantitative analysis for healthy leaves.
Fig.11 Graphical analysis of features healthy leafs. The table.9 shows the graph of classification accuracy of plant diseases affecting leaves using combined features with ANN classifier and also proposed method is compared with the accuracy of existed SVM classifier. The overall accuracy of the algorithm was 97%, which is a relatively good result given that four different diseases were considered. The direct correlation with different strategies found in the writing is troublesome, on the grounds that practically every one of them were intended to manage just a couple of ailments of explicit plant species. Be that as it may, in order to help such an examination, anyway flawed, two different strategies were executed dependent on the data contained in the productions depicting the calculation. So as to check the amount of the mistake rates watched for the calculation are because of issues in the programmed division of the leaf and side effects, the outcomes got when playing out the divisions physically are additionally displayed. Table 9 displays the correctness’s watched for each plant illness utilizing every calculation.
Diseases Accuracy of
Proposed System
Accuracy of SVM[9] Alternaria
alternata 96.7742 96.7742
Anthracnose 98.849 96.7742
Bacterial blight 97.236 96.7742
Cercospora Leaf
Spot 98.849 98.3871
Healthy leaves 98.0002 96.7742
[image:6.595.48.292.246.451.2]Table- VIII: Comparative analysis of accuracy.
[image:6.595.46.289.474.601.2] [image:6.595.304.544.516.721.2]From the graph, it is observed that the maximum classification accuracy of 99% has occurred with images of Cercospora leaf spot and Anthracnose disease. The minimum classification accuracy of 96% has occurred with images of Alternaria alternata disease. The average classification accuracy of 98% is achieved with images of Bacterial blight disease and healthy leaves.
The test results show that the proposed methodology is a profitable methodology, which can fundamentally bolster a precise discovery of plant infection in a little computational exertion. The principle favorable position of this proposed methodology is that, extensively fewer highlights is conveyed to accomplish better grouping precision and to diminish calculation time. It shows that ANN accomplishes a huge improvement in the grouping precision over SVM. ANN demonstrated to be an integral asset for programmed characterization of plant sicknesses considered in the present work.
IV. CONCLUSION
Perceiving the plant disease is the primary motivation behind the proposed methodology. Accordingly, the proposed calculations are tried on five plant ailments with typical which impact the plant leaves. The created classifier uses shading and surface highlights for characterization of plant maladies and influencing the plant leaves. Despite the fact that these highlights have given diverse exactness’s in separation for various pictures of plant malady influencing plant leaves, the very mix of highlights has ended up being compelling. The primary favourable position of this proposed methodology is that, significantly fewer highlights is sent to accomplish better arrangement exactness and to diminish calculation time. The test results demonstrate that the proposed methodology is an important methodology, which can fundamentally bolster a precise identification of plant infection in a little computational exertion. It indicates that ANN achieves a significant improvement in the classification accuracy over SVM. ANN ended up being an incredible asset for programmed grouping of plant infections considered in the proposed computer aided identification and detection system. But, there is scope for enhancement in the classification accuracy.
REFERENCES
1. Y. Lu, S. Yi, N. Zeng, Y. Liu, and Y. Zhang, ``Identi_cation of rice
diseases using deep convolutional neural networks,'' Neurocomputing,
vol. 267, pp. 378_384, Dec. 2017, doi:
10.1016/j.neucom.2017.06.023.
2. V. Singh and A. K. Misra, ``Detection of plant leaf diseases using image segmentation and soft computing techniques,'' Inf. Process.
Agricult.,vol. 4, pp. 41_49, Mar. 2017, doi:
0.1016/j.inpa.2016.10.005.
3. P. B. Padol and A. A. Yadav, ``SVM classi_er based grape leaf disease
detection,'' in Proc. Conf. Adv. Signal Process. (CASP), Jun. 2016, pp. 175_179, doi: 10.1109/CASP.2016.7746160.
4. J. G. A. Barbedo, L. V. Koenigkan, and T. T. Santos, ``Identifying multiple plant diseases using digital image processing,'' Biosyst. Eng.,
vol. 147, pp. 104_116, Jul. 2016, doi:
10.1016/j.biosystemseng.2016.03.012.
5. J. K. Patil and R. Kumar, ``Analysis of content based image retrieval
for plant leaf diseases using color, shape and texture features,'' Eng.Agricult., Environ. Food, vol. 10, pp. 69_78, Apr. 2016, doi: 10.1016/j.eaef.2016.11.004.
6. M. Ramakrishnan and A. S. A. Nisha, ``Groundnut leaf disease
detection and classi_cation by using back probagation algorithm,'' in
Proc. IEE ICCSP Conf., Apr. 2015, pp. 964_968, doi:
10.1109/ICCSP.2015.7322641.
7. Y. Lu, S. Yi, N. Zeng, Y. Liu, and Y. Zhang, ``Identification of rice
diseases using deep convolutional neural networks,'' Neurocomputing,
vol. 267,pp. 378_384, Dec. 2017, doi:
10.1016/j.neucom.2017.06.023.
8. M. Neumann, L. Hallau, B. Klatt, K.Kersting, and C. Bauckhage,
``Erosion band features for cell phone image based plant disease classi_cation,'' inProc. 22nd IEEE Int. Conf. Pattern Recognit., Aug. 2014, pp. 3315_3320,doi: 10.1109/ICPR.2014.571.
9. I. Kaur, G. Aggarwal, and A. Verma, ``Detection and classication of
disease affected region of plant leaves using image processing technique,'' Indian J. Sci. Technol., vol. 9, no. 48, pp. 1_13, 2016,doi: 10.17485/ijst/2016/v9i48/104765.
10. L. Yuan, Z. Bao, H. Zhang, Y. Zhang, and X. Liang, ``Habitat
monitoring to evaluate crop disease and pest distributions based on multi-source satellite remote sensing imagery,'' Optik_Int. J. Light
Electron Opt., vol. 145,pp. 66_73, Sep. 2017, doi:
10.1016/j.ijleo.2017.06.071.
11. A. Camargo and J. S. Smith, ``Image pattern classification for the identi-_cation of disease-causing agents in plants,'' Comput. Electron.
Agricult.,vol. 66, no. 2, pp. 121_125, 2009, doi:
10.1016/j.compag.2009.01.003.
AUTHORSPROFILE
Mr.S. Bharath received the ME and BE degrees from